The application of digital cameras to monitor the environment is becoming global and changing the way of phenological data collection. The technique of repeated digital photographs to monitor plant phenology (phenocams) has increased due to its low-cost investment, reduced size, easy set up installation, and the possibility of handling high-resolution near-remote data. Considering the widespread use of phenocams worldwide, our main goals here are: (i) to provide a step-by-step guide for phenocam set up in the tropics, reinforce its appliance as an efficient tool for monitoring tropical phenology and foster networking, (ii) to discuss phenocam applications for biological conservation, management, and ecological restoration. We provide the concepts and properties for image analysis which allow representing the phenological status of the vegetation. The association of a long-term imagery data with local sensors (e.g., meteorological stations and surface-atmosphere flux towers) allows a wide range of studies, especially linking phenological patterns to climatic drivers; and the impact of climate changes on plant responses. We show phenocams applications for conservation as to document disturbances and changes on vegetation structure, such as deforestation, fire events, and flooding and the vegetation recovery. Networks of phenocams are growing globally and represent an important tool for conservation and restoration, as it provides hourly to daily information of monitored systems spread over several sites, ecosystems, and climatic zones. Moreover, websites enriched by vegetation dynamic imagery data can promote science knowledge by engaging citizen science participation.
The use of digital cameras to document plant changes is not novel. Photographs have been used to monitor landscape since 1965 by Hastings and Turner to verify changes in the ecosystem dynamics and structure of the arid southwest region of the US. Thompson et al. (2002) used photographic registers for the long-term study of glacial retreat in the Antarctic ice sheet. Repeated digital images have been used to document changes in cultural landscapes (Peñuelas and Boada, 2003; Webb et al., 2007); to measure vegetation growth and biomass (Crimmins and Crimmins, 2008; Graham et al., 2009); to detect plant stress and nitrogen status (Wang et al., 2004) and to monitor crops (Slaughter et al., 2008). More recently, the application for monitoring leaf exchanges patterns or leafing phenology (Richardson et al., 2007, 2009; Nagai et al., 2011) has brought the technique to the agenda of global change research and conservation (Richardson et al., 2013; Morellato et al., 2016).
Phenology is an integrative environmental science focused on monitoring, understanding, and predicting recurrent life cycles events of organisms, which are mainly related to climate (Morellato et al., 2016). Leafing is the plant phenological event that defines the growth season and controls crucial ecosystems processes such as, nutrient cycling, water storage, regulates productivity in terrestrial ecosystems, and the dynamics of carbon sequestration (Reich, 1995; Baldocchi et al., 2005).
Phenological studies have been efficiently applied to track effects of environmental changes on plants and animals in temperate regions, answering questions about the current scenario of global climate change and stimulating the search for innovative tools of plant monitoring (Polgar and Primack, 2011). Detect plant responses to environmental changes across tropical systems, especially in the Southern Hemisphere, is an important question on the global agenda since few studies have addressed trends related to global warming (Rosenzweig et al., 2008; Morellato et al., 2013, 2016; Chambers et al., 2013). However, the tropical high diversity of species precludes the observation of many species across several sites due to the intense human labor and costs (Alberton et al., 2014; Morellato et al., 2016).
The technique of repeated photographs to monitor plant phenology may overcome those difficulties. The application has increased due to its low-cost, reduced size, easy set up, and the possibility of handling high-resolution data, making digital cameras reliable tools for a wide range of ecological applications (Crimmins and Crimmins, 2008; Morisette et al., 2009; Graham et al., 2010; Nasahara and Nagai, 2015; Brown et al., 2016). Digital cameras for plant phenology observation, also called phenocams, have allowed the detection of leaf phenological events through the analysis of color changes along time. By quantifying the red, green, and blue (RGB) color channels, it is possible to estimate, for instance, leaf flushing and senescence, using the green and red channels, respectively (Ahrends et al., 2009; Morisette et al., 2009; Richardson et al., 2009).
The term “Near-surface remote phenology” consists in the use of sensors installed on the ground, as the phenocams, with the objective of monitoring ecosystem-scale vegetation changes. Digital cameras monitoring canopy vegetation has an important role by filling the “gap of observations” between satellite monitoring and the traditional on-the-ground phenology (Alberton et al., 2014; Brown et al., 2016; Morellato et al., 2016; Morisette et al., 2009). The use of imagery data over the traditional phenological observations allows simultaneous multi-sites monitoring, long-term monitoring collecting high-frequency data (daily, hourly), and reduced human labor fieldwork for data acquisition. Phenocams networks are already covering a wide range of ecosystems in the world (Richardson et al., 2013; Brown et al., 2016). The main networks websites are the Phenocam Network in the United States (http://phenocam.sr.unh.edu – as of January 2017), the EuroPhen in Europe (http://european-webcam-network.net – as of January 2017) and the Phenological Eyes Network (PEN) in Japan (http://pen.agbi.tsukuba.ac.jp – as of January 2017). Together these initiatives combine more than 250 outdoor cameras (Brown et al., 2016; Nasahara and Nagai, 2015). For the tropics, we have the Tropidry project as a successful example of ecological project with intense multidisciplinary data collection, including the use of phenology towers with phenocams, covering dry tropical sites (http://tropi-dry.eas.ualberta.ca/ – as of May 2017). In Brazil, the e-phenology Network (http://www.recod.ic.unicamp.br/ephenology – as of January 2017) introduced in this paper, target the challenge of monitoring different vegetation types from dry forest, grasslands, and cerrado savannas to rainforests.
Therefore, considering the worldwide applications of phenocams in ecological studies, our main goals here are: (i) to provide a step-by-step guide for phenocam set up in the tropics, reinforce its appliance as an efficient tool for monitoring tropical phenology, (ii) to show how phenocams can provide key contributions to biological conservation, and (iii) to encourage this promising research field in Brazil and tropical areas based on the e-phenology project experience, and foster networking and e-science collaborative research.
Phenocams as tools for the monitoring of plant phenologyDigital images are typically based on the RGB color model (red, green, and blue color channels). These channels encode the brightness values of the scene and can be combined in more than 16 million of colors, representing basically all the colors perceived by humans (Cheng et al., 2001). Through the quantification of the RGB color channels, it is possible to calculate vegetation indices, which are related to leaf color changes representing the phenological status of the vegetation (Richardson et al., 2007; Sonnentag et al., 2012) (Fig. 1).

By capturing daily digital images of a given site, we derivate time series encoding RGB color changes over time. Thus, the leaf patterns can be described based, for instance, on the proportion of the green fraction in the images (Richardson et al., 2007). The association of digital imagery data with local sensors (e.g., meteorological stations and surface-atmosphere fluxes) uncovers a wide range of research opportunities, especially linking phenological patterns to climatic drivers, and analyzing long-term data to detect phenological shifts due to the impact of anthropogenic changes (Polgar and Primack, 2011; Brown et al., 2016; Morellato et al., 2016).
The collection of daily vegetation color changes has been motivated also by the need to understand ecosystem-scale energy fluxes (Baldocchi et al., 2005; Richardson et al., 2007). Studies from temperate vegetation have found the start of the vegetation greenness controls the gross primary productivity (GPP) curves (Richardson et al., 2010; Migliavacca et al., 2011; Keenan et al., 2014). Therefore, temporal changes in the vegetation drive carbon exchange processes via influencing the photosynthesis process, respiration, and litter production (Peichl et al., 2014).
Most of the studies using phenocams have been developed in the Northern hemisphere, covering mainly deciduous forests (Richardson et al., 2007, 2009; Nagai et al., 2011). However, the application of repeated digital photographs is also efficient for the phenology monitoring of temperate grasslands (Inoue et al., 2015; Julitta et al., 2014), peatland (Peichl et al., 2014), and evergreen forest (Toomey et al., 2015). Its reliability for tropical vegetation was recently validated for woody cerrado savanna (Alberton et al., 2014) and applied for tropical forest (Nagai et al., 2016; Lopes et al., 2016). The use of camera-derived vegetation indices in association with leaf demography-ontogeny models has been recently applied in the Amazon forest to investigate ecosystem-scale photosynthetic seasonality (Wu et al., 2016). However, there is still little focus on the species level analysis and on grasslands, mountains and other tropical vegetation.
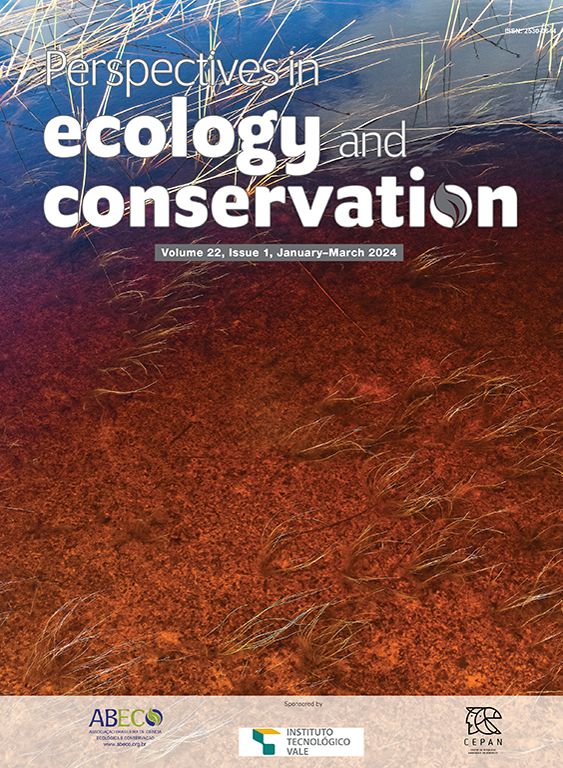
Procedures for phenological monitoring using digital camerasDigital cameras are reliable tools for the monitoring of vegetation because they have low price and easy setup, while providing high frequency and resolution data. Here, we introduce the main steps for phenology camera set up and basic information about image processing for data analysis (Fig. 1). A detailed protocol is available in the Supplementary Material.
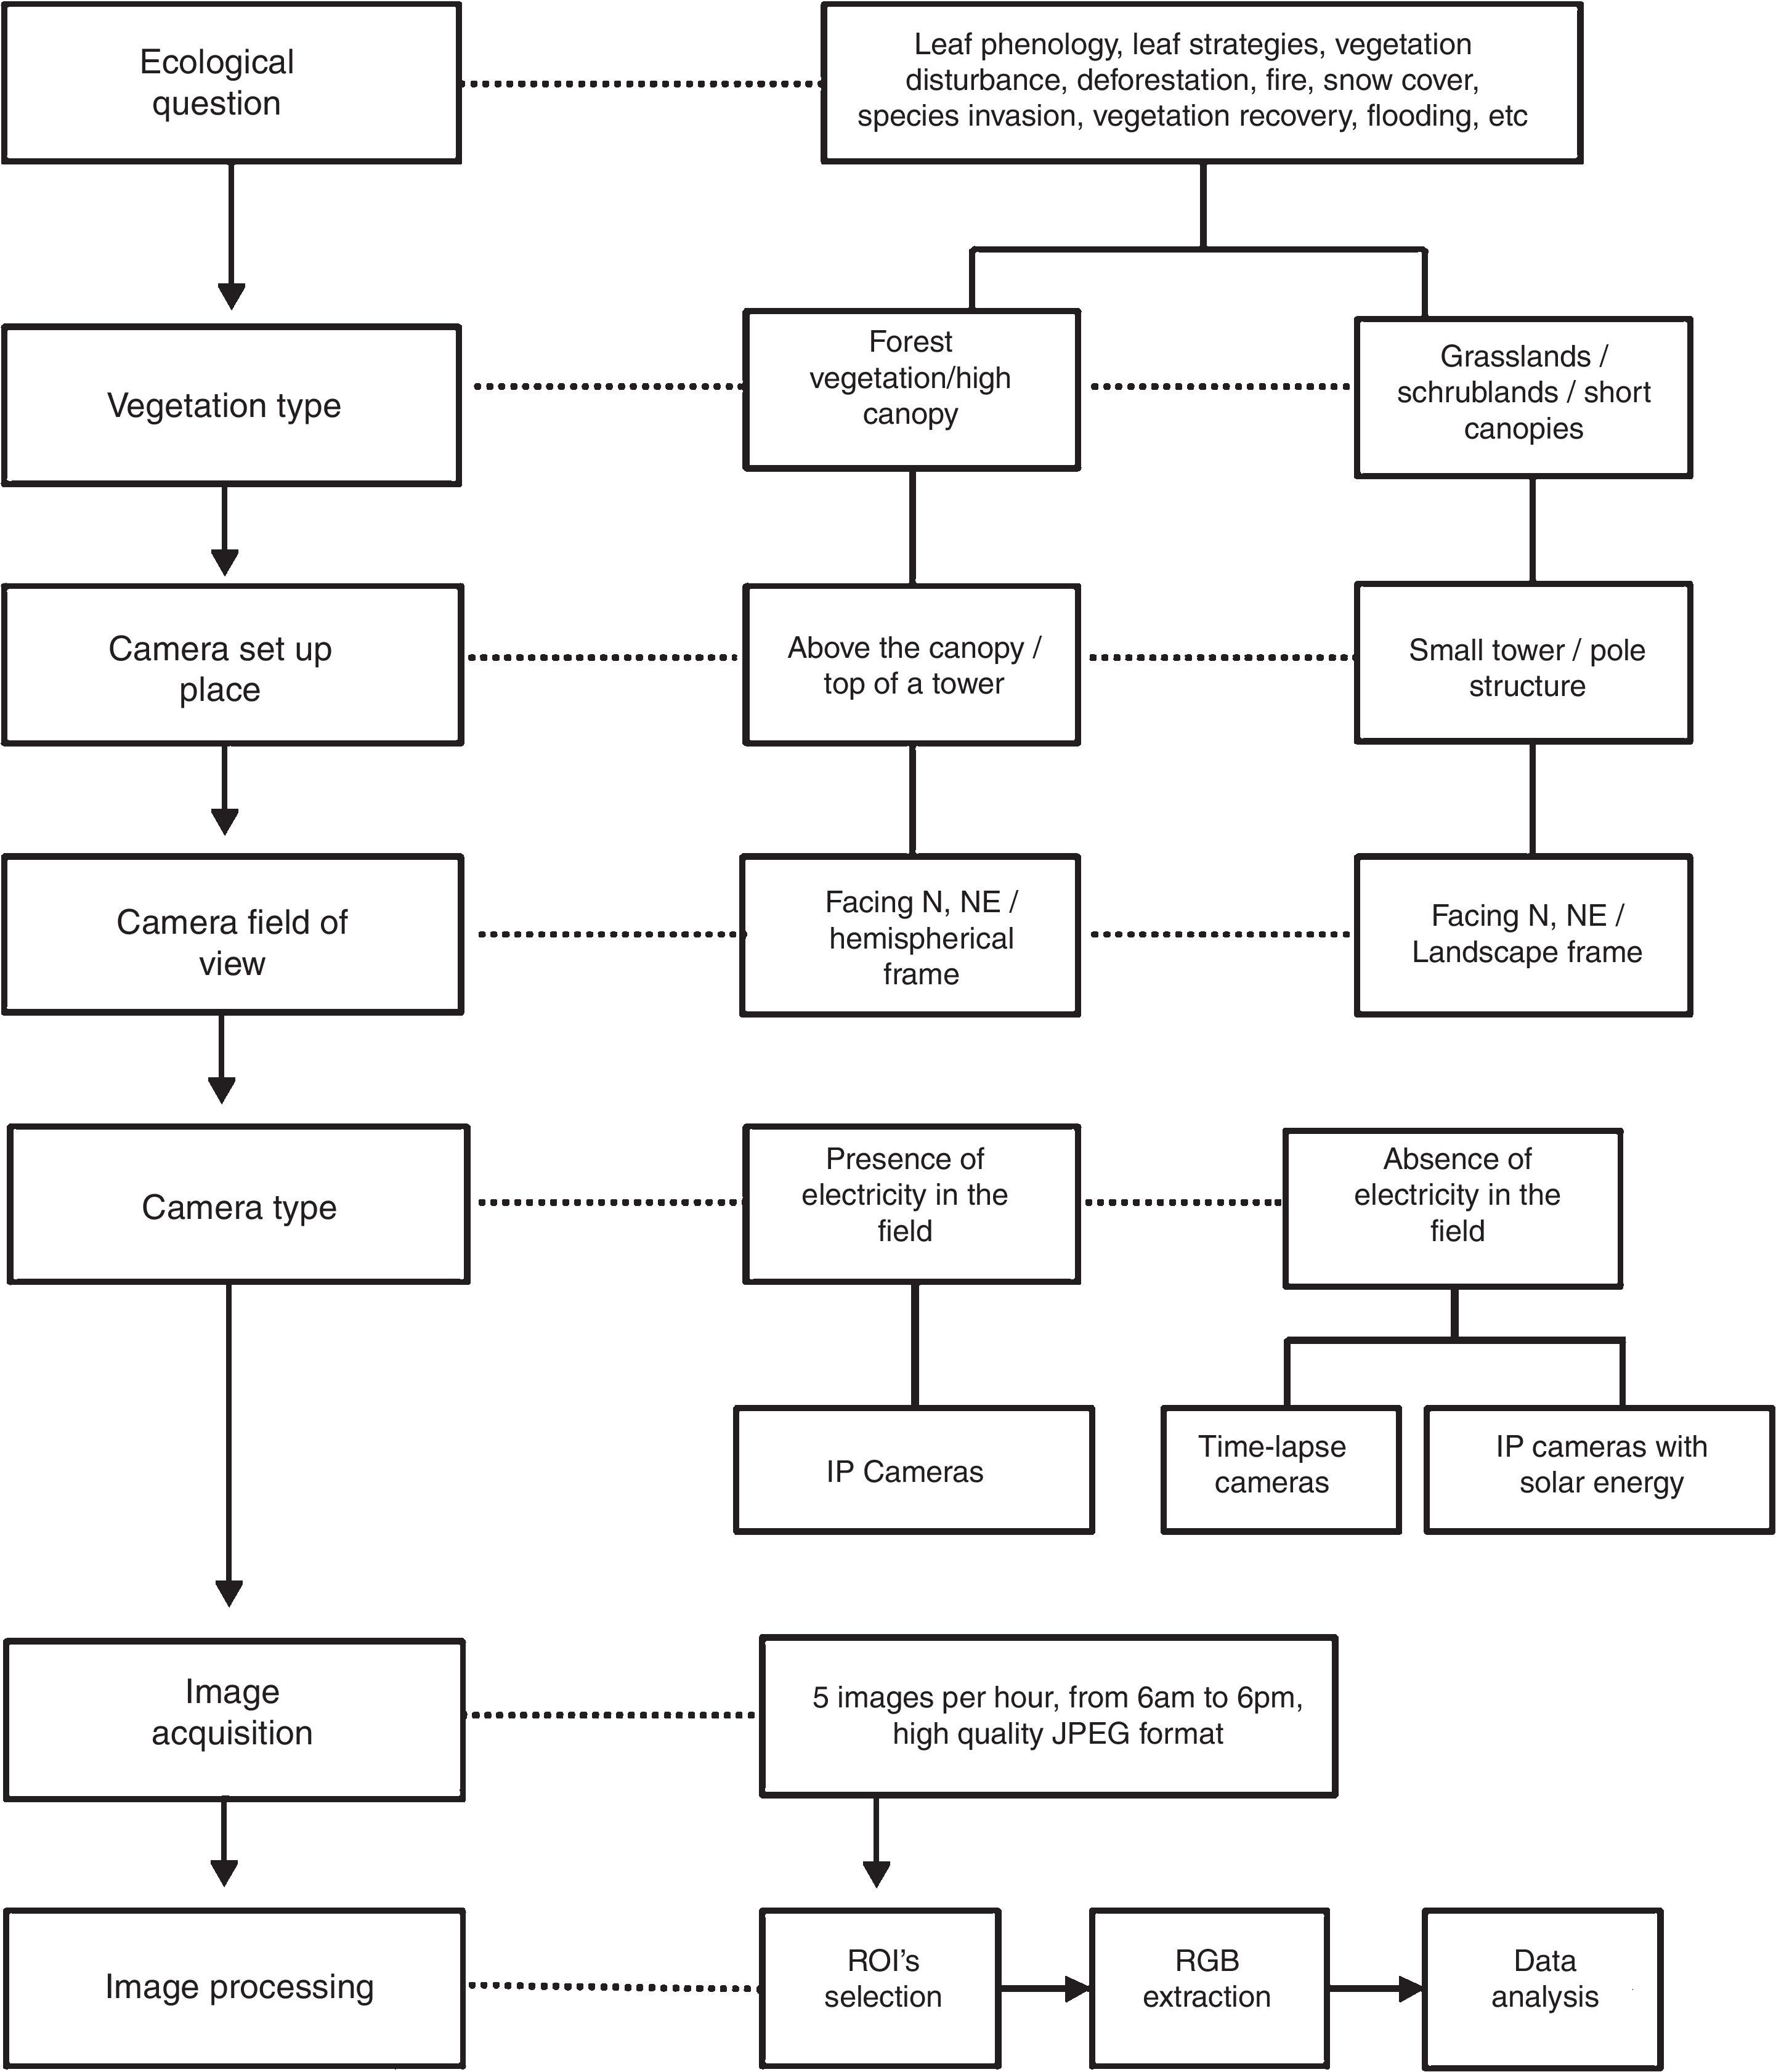
Camera set up and image settingsIn general, the camera is placed in a tower built in the middle of vegetation (Fig. 2a and b). The choice of the site and the field of view must maximize the vegetation to be monitored. Hemispherical lens cameras are reliable for capturing images of the canopy, reducing crown cover among individual species (Fig. 2c). Cameras should be positioned facing North – Northeast to maximize the light over the canopy and to minimize lens flare. Cameras can be set up on small towers, close to the ground, to capture landscape images (Fig. 2d and e) when the focus are shrublands, grasslands, or other vegetations with short canopies and across heterogeneous landscapes as rupestrian grasslands (Fig. 2f).
 sketch of the hemispherical lens camera mounting design for forest canopy; (B) camera set up in the field; (C) sample image captured by the hemispherical lens digital camera in the cerrado sensu stricto vegetation (Itirapina, SP); (D) sketch of the camera mounting design for a landscape perspective; (E) camera set up in the field, (F) sample image of the heterogeneous landscape in the Serra do Cipó mountain range (Santana do Riacho, Minas Gerais State, Brazil).")
Brazilian sites from e-phenology network and their different phenology monitoring setups for woody and open vegetation: (A) sketch of the hemispherical lens camera mounting design for forest canopy; (B) camera set up in the field; (C) sample image captured by the hemispherical lens digital camera in the cerrado sensu stricto vegetation (Itirapina, SP); (D) sketch of the camera mounting design for a landscape perspective; (E) camera set up in the field, (F) sample image of the heterogeneous landscape in the Serra do Cipó mountain range (Santana do Riacho, Minas Gerais State, Brazil).
Different digital cameras have been used in repeated photography monitoring (see Sonnentag et al., 2012; Steenweg et al., 2017). Internet protocol (IP) cameras are ideal because they can be connected to a network and the image download performed remotely. For instance, Stardot IP cameras record landscape images, have been successfully applied in temperate ecosystem monitoring, and were chosen as the standard camera for two of the major networks in North Hemisphere (Brown et al., 2016). Hemispherical lens (also called fish-eye) have been chosen for monitoring tropical vegetation sites (Alberton et al., 2014; Nagai et al., 2016) and by PEN (Nasahara and Nagai, 2015). The fish-eyes lens (360°) improve the selection of crowns with more precision and less covered areas (see Alberton et al., 2014).
We recommend capturing a high frequency of images (a set of 3–5 images per hour, from 6 a.m. to 6 p.m.), which provides fine-tuned information about phenology, a confident quality data collection, and also a high volume of data for light calibration, smoothing and the development of computational tools (Alberton et al., 2014; Almeida et al., 2014, 2015a; Almeida et al., 2016b). When it is not possible due to storage constraints, we recommend taking at least one image per hour during the midday hours (10 a.m. to 2 p.m., for more details see the SM). A complete meteorological station or at least some minimum set of sensors (rain gauge, thermometers, and Photosynthetically Active Radiation (PAR) sensors) is an important additional component to phenology towers. If not possible, it is important to search for the closest meteorological station to the study site.
Color information analysisThe image analysis usually depends on the definition of regions of interest (ROI). The ROI is a region within the input images defined for analysis (Fig. S1 and see Alberton et al. (2014). After defining a ROI, we can remove irrelevant areas, such as those lacking vegetation or depicting the tower structure. Therefore, we define the sample size as ROIs from crowns of several species, a population, a portion of the canopy, a community profile, or a habitat or vegetation type in a heterogeneous landscape (Fig. S1).
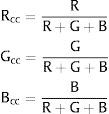
Several indexes have been applied to detect leaf color changes in time series of digital images exploring the RGB color channels (Richardson et al., 2007; Nagai et al., 2011; Sonnentag et al., 2012; Zhao et al., 2012; Zhou et al., 2013). Woebbecke et al. (1995) was one of the first to calculate several indexes using RGB channels of digital images to evaluate which are better to detect weeds considering different types of soil, residue, and light conditions. A normalized index called RGB chromatic coordinates (RGBcc) was developed by Gillespie et al. (1987) and it is considered up to now the most efficient to detect the color of plants in relation to their background (Sonnentag et al., 2012).
The RGB chromatic coordinates (Rcc, Gcc, and Bcc) is a normalized index, defined by dividing each component (R, G, or B) by the sum of all components (R+G+B):
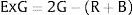
The Excess Green (ExG) index is also applied in color time series analysis (Sonnentag et al., 2012). This metric has proved to be a consistent color index, able to distinguish between green plants and their background (soil, residue), as well as to minimize variations in illumination, enhancing the green signal of the plants (Woebbecke et al., 1995).
After performing the RGB color extraction and the vegetation index computation, it is necessary a data filtering to minimize noise in the time-series information (RGBcc) caused by illumination effects of seasonal changes and time of day (Sonnentag et al., 2012). To that end, the 90th percentile value is calculated from all daily values in a 3-day window (Sonnentag et al., 2012).
Phenocams contributions for biological conservationThe importance of phenology for biodiversity conservation and ecological restoration has been recently explored by Morellato et al. (2016) and Buisson et al. (2017) respectively, with a special focus on conservation of tropical systems (Morellato et al., 2016). Phenology is recognized as an essential biodiversity variable required for study, report, and manage biodiversity (Pereira et al., 2013), pointing out the potential of remote sensing phenology and phenocam networks. Therefore, near-surface phenology with cameras can play a key role for biodiversity conservation at several scales. On the other hand, phenology has not yet been included in the formal guidelines or recommendations for ecological restoration by SER (Society for Ecological Restoration), but Buisson et al. (2017) bring a fresh perspective on why and how phenology should be incorporated to ecological restoration guidelines. Systematic, long-term phenological monitoring programs are needed at local to large spatial scales to ensure conservation and effective management and for the success of ecological restoration programs.
Plant responses to climateThe search for the main factors triggering plant phenology is of paramount importance for better understanding plant responses facing climate changes and the conservation of species to ecosystems (Polgar and Primack, 2011; Morellato et al., 2016). Plant phenology triggers remain poorly understood across the tropics. Therefore, systematic and long-term phenological observations are needed at large spatial scales for tropical ecosystems (Morellato et al., 2013; Chambers et al., 2013). However, high diversity of species precludes the observation of many species across several sites, due to the intense human labor and high costs (Alberton et al., 2014; Morellato et al., 2016).
The e-phenology network was built based first on a core cerrado area where we tested and validated all protocols considering the local long-term cerrado phenology project (Alberton et al., 2014). We expanded the network, integrating flux measurements towers and larger research projects, choosing sites across a seasonality gradient. We are reaching out several key tropical vegetations from Amazon forest, Atlantic rainforest, Cerrado, to Caatinga, tracking changes and investigating drivers for phenology. Also, within the Amazon-FACE project, we will be able to monitor vegetation phenological responses to CO2 enrichment on Amazon forest. Elevated CO2 (eCO2) would affect photosynthesis biochemistry leading to an increase of productivity for tropical ecosystems (Norby et al., 2016).
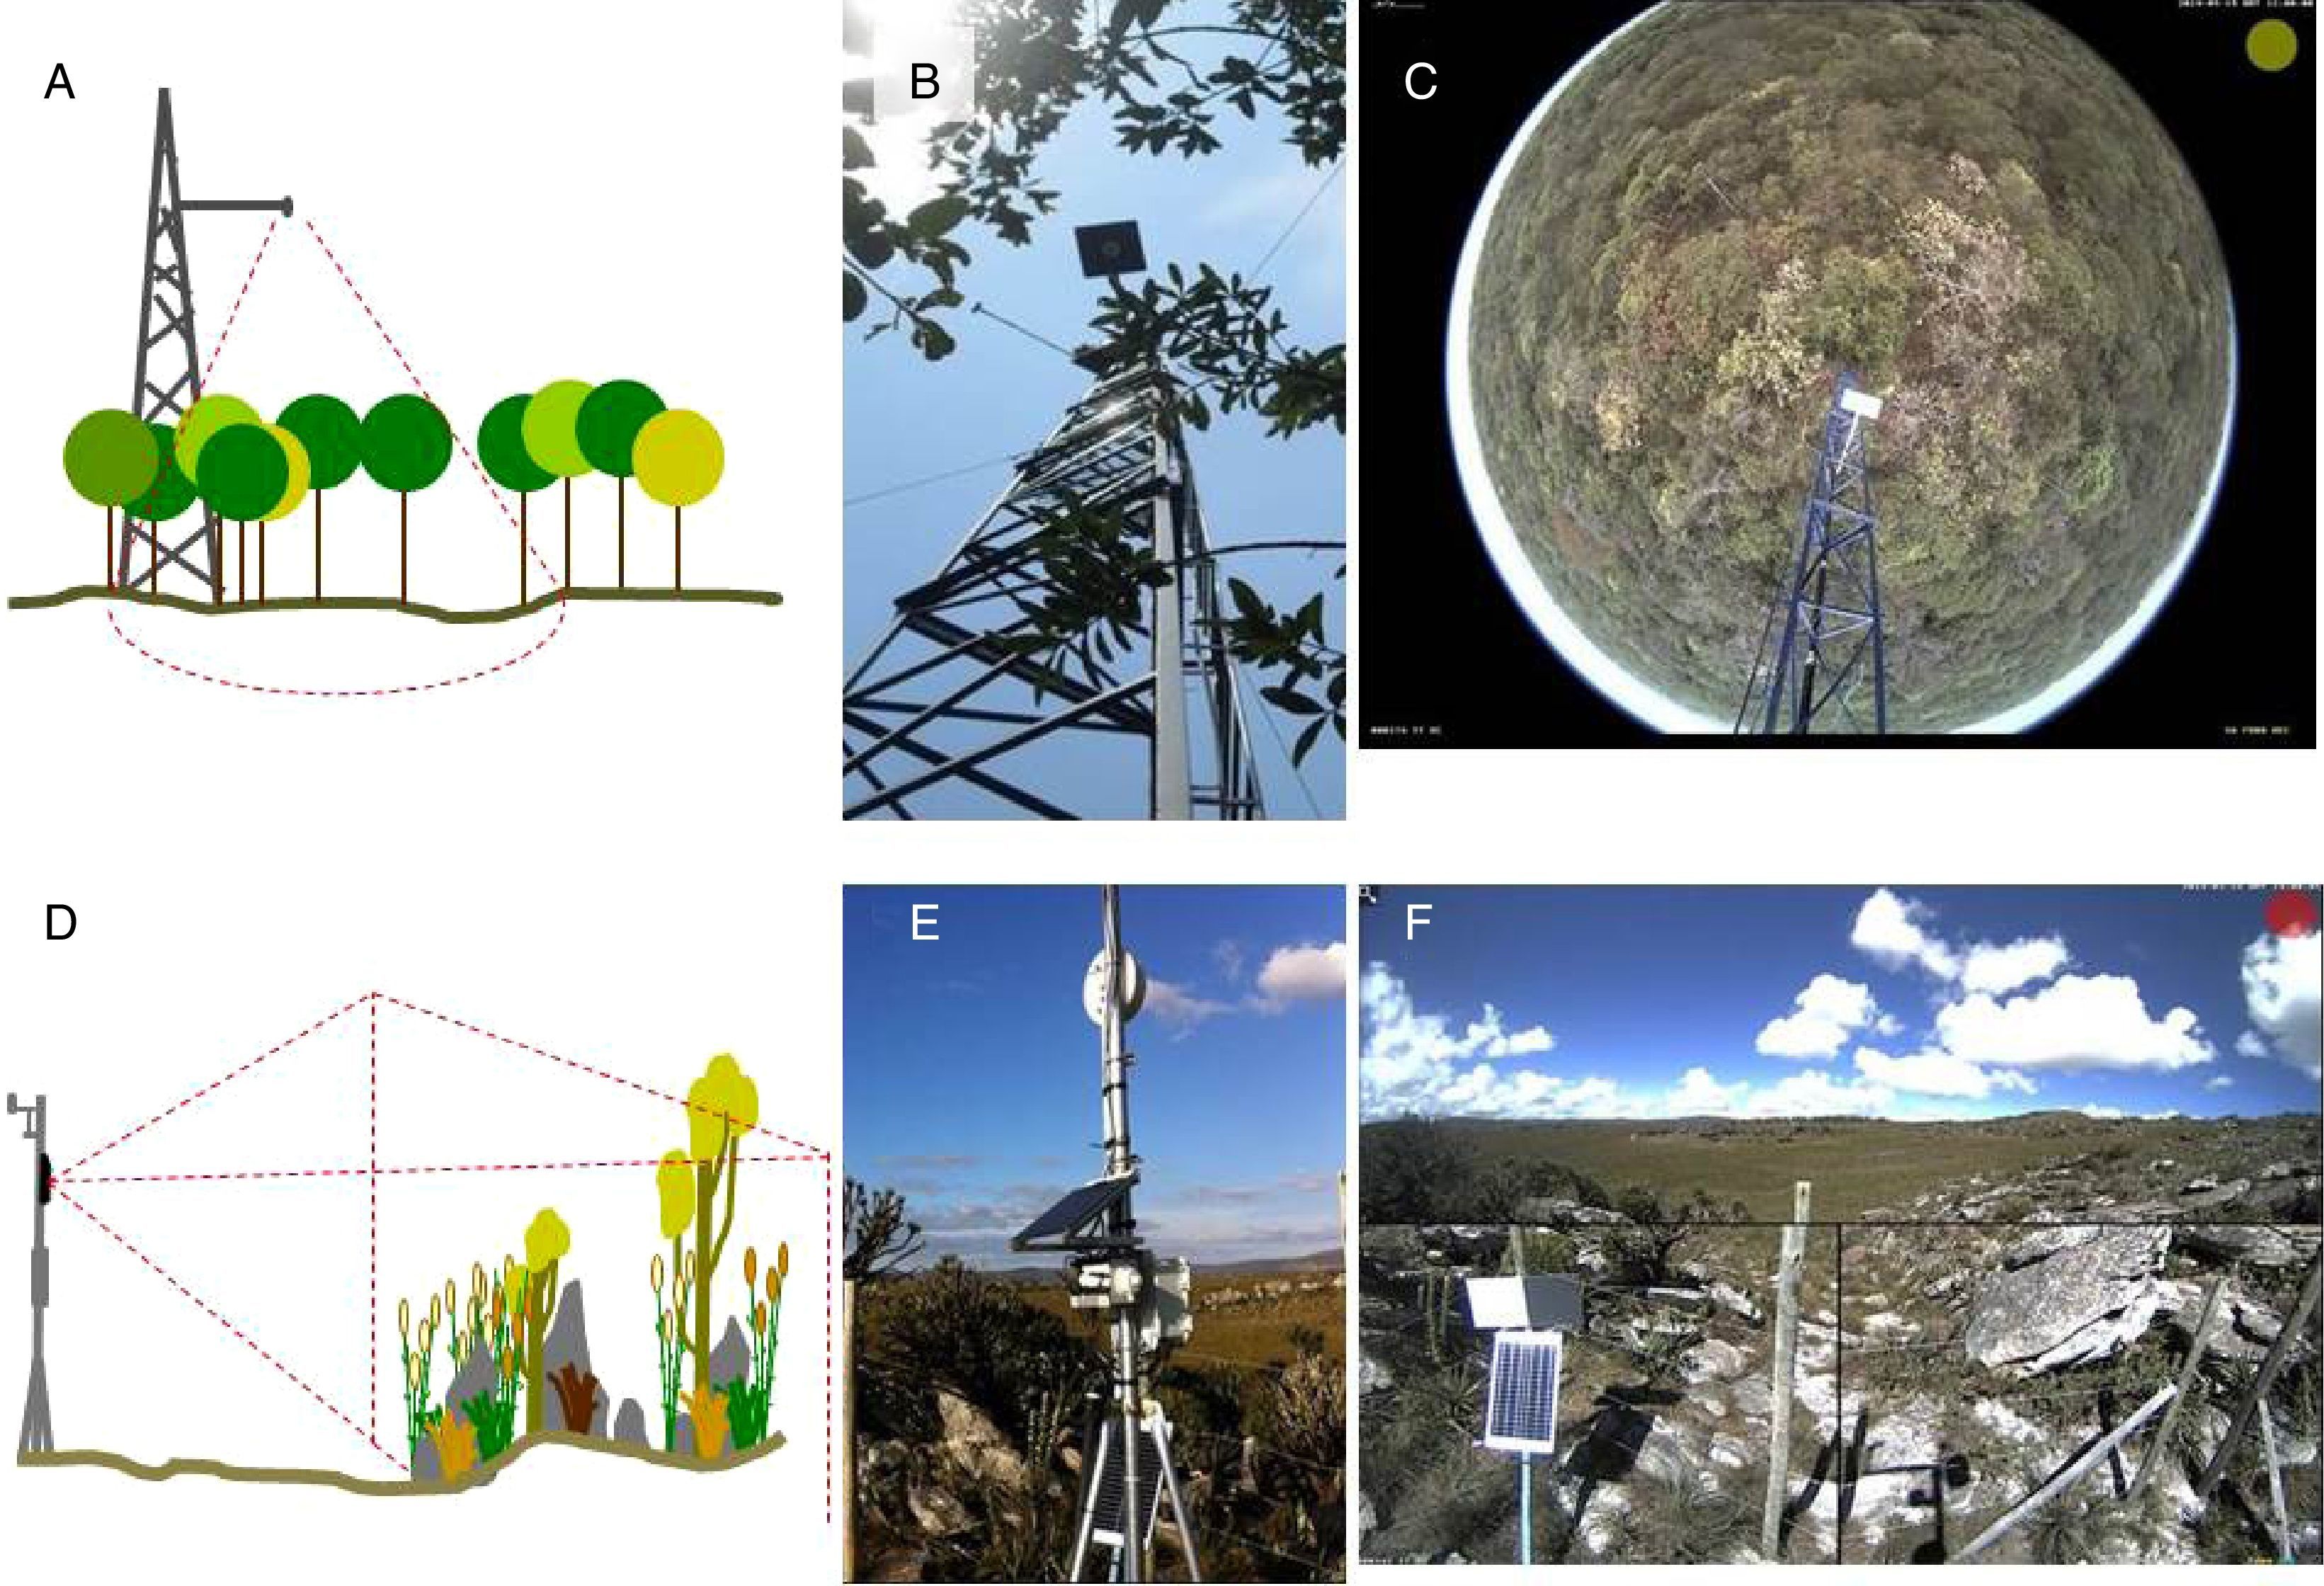
Through daily color changes information in association with daily measurements of climatic variables (Fig. 3a and b), a wide range of questions might be investigated. For instance, modeling leaf phenology patterns of multi sites and time series to investigate drivers of leaf development and senescence. Another important approach is in the ecosystem scale studies. Vegetative phenology has a significant role in the Dynamic Global Vegetation Models (DGVM). These models are based on a coupled information between plant biogeography and biogeochemical process to simulate ecosystem fluxes and climate shifts in a climatic change scenario (Foley et al., 1998). In the tropics, understand leaf phenological stages is essential to better estimate measurements of gross primary productivity (GPP), because there is a gap of knowledge about drivers of carbon fluxes (Restrepo Coupe et al., 2017). Camera derived color time series might provide high frequency and quality information to understand photosynthetic seasonality as the vegetation responses and feedbacks to a changing climate (Richardson et al., 2013; Restrepo Coupe et al., 2017).
 using phenocam imagery, in relation to local seasonal patterns of daily precipitation (blue bars) and air temperature (black line). In both graphics, Gcc values represent a 3-day window filter time-series of the growing season length (from day of the year DOY 152 to 214, 2013-2014) of two cerrado savanna physiognomies, a cerrado campo sujo vegetation (A) and a cerrado sensu stricto (B), both located at Itirapina municipality, São Paulo State, Brazil.")
Vegetation canopy greenness, as quantified by green chromatic coordinate (Gcc; green dots) using phenocam imagery, in relation to local seasonal patterns of daily precipitation (blue bars) and air temperature (black line). In both graphics, Gcc values represent a 3-day window filter time-series of the growing season length (from day of the year DOY 152 to 214, 2013-2014) of two cerrado savanna physiognomies, a cerrado campo sujo vegetation (A) and a cerrado sensu stricto (B), both located at Itirapina municipality, São Paulo State, Brazil.
Phenocams can monitor one to several tropical vegetation types and species with a reduced manpower and high temporal scale (daily basis). Near remote monitoring systems using digital repeated photograph can be also one of the most powerful tools to observe and detect shifts on vegetation structure to land-use changes, disturbances, climate warming and pre- and post-restoration of natural and agroecosystem. Changes detected by cameras such as events of deforestation, fire, flooding, vegetation recovery after disturbances, and species invasion, likely help to take fast and appropriated conservation and management measures.
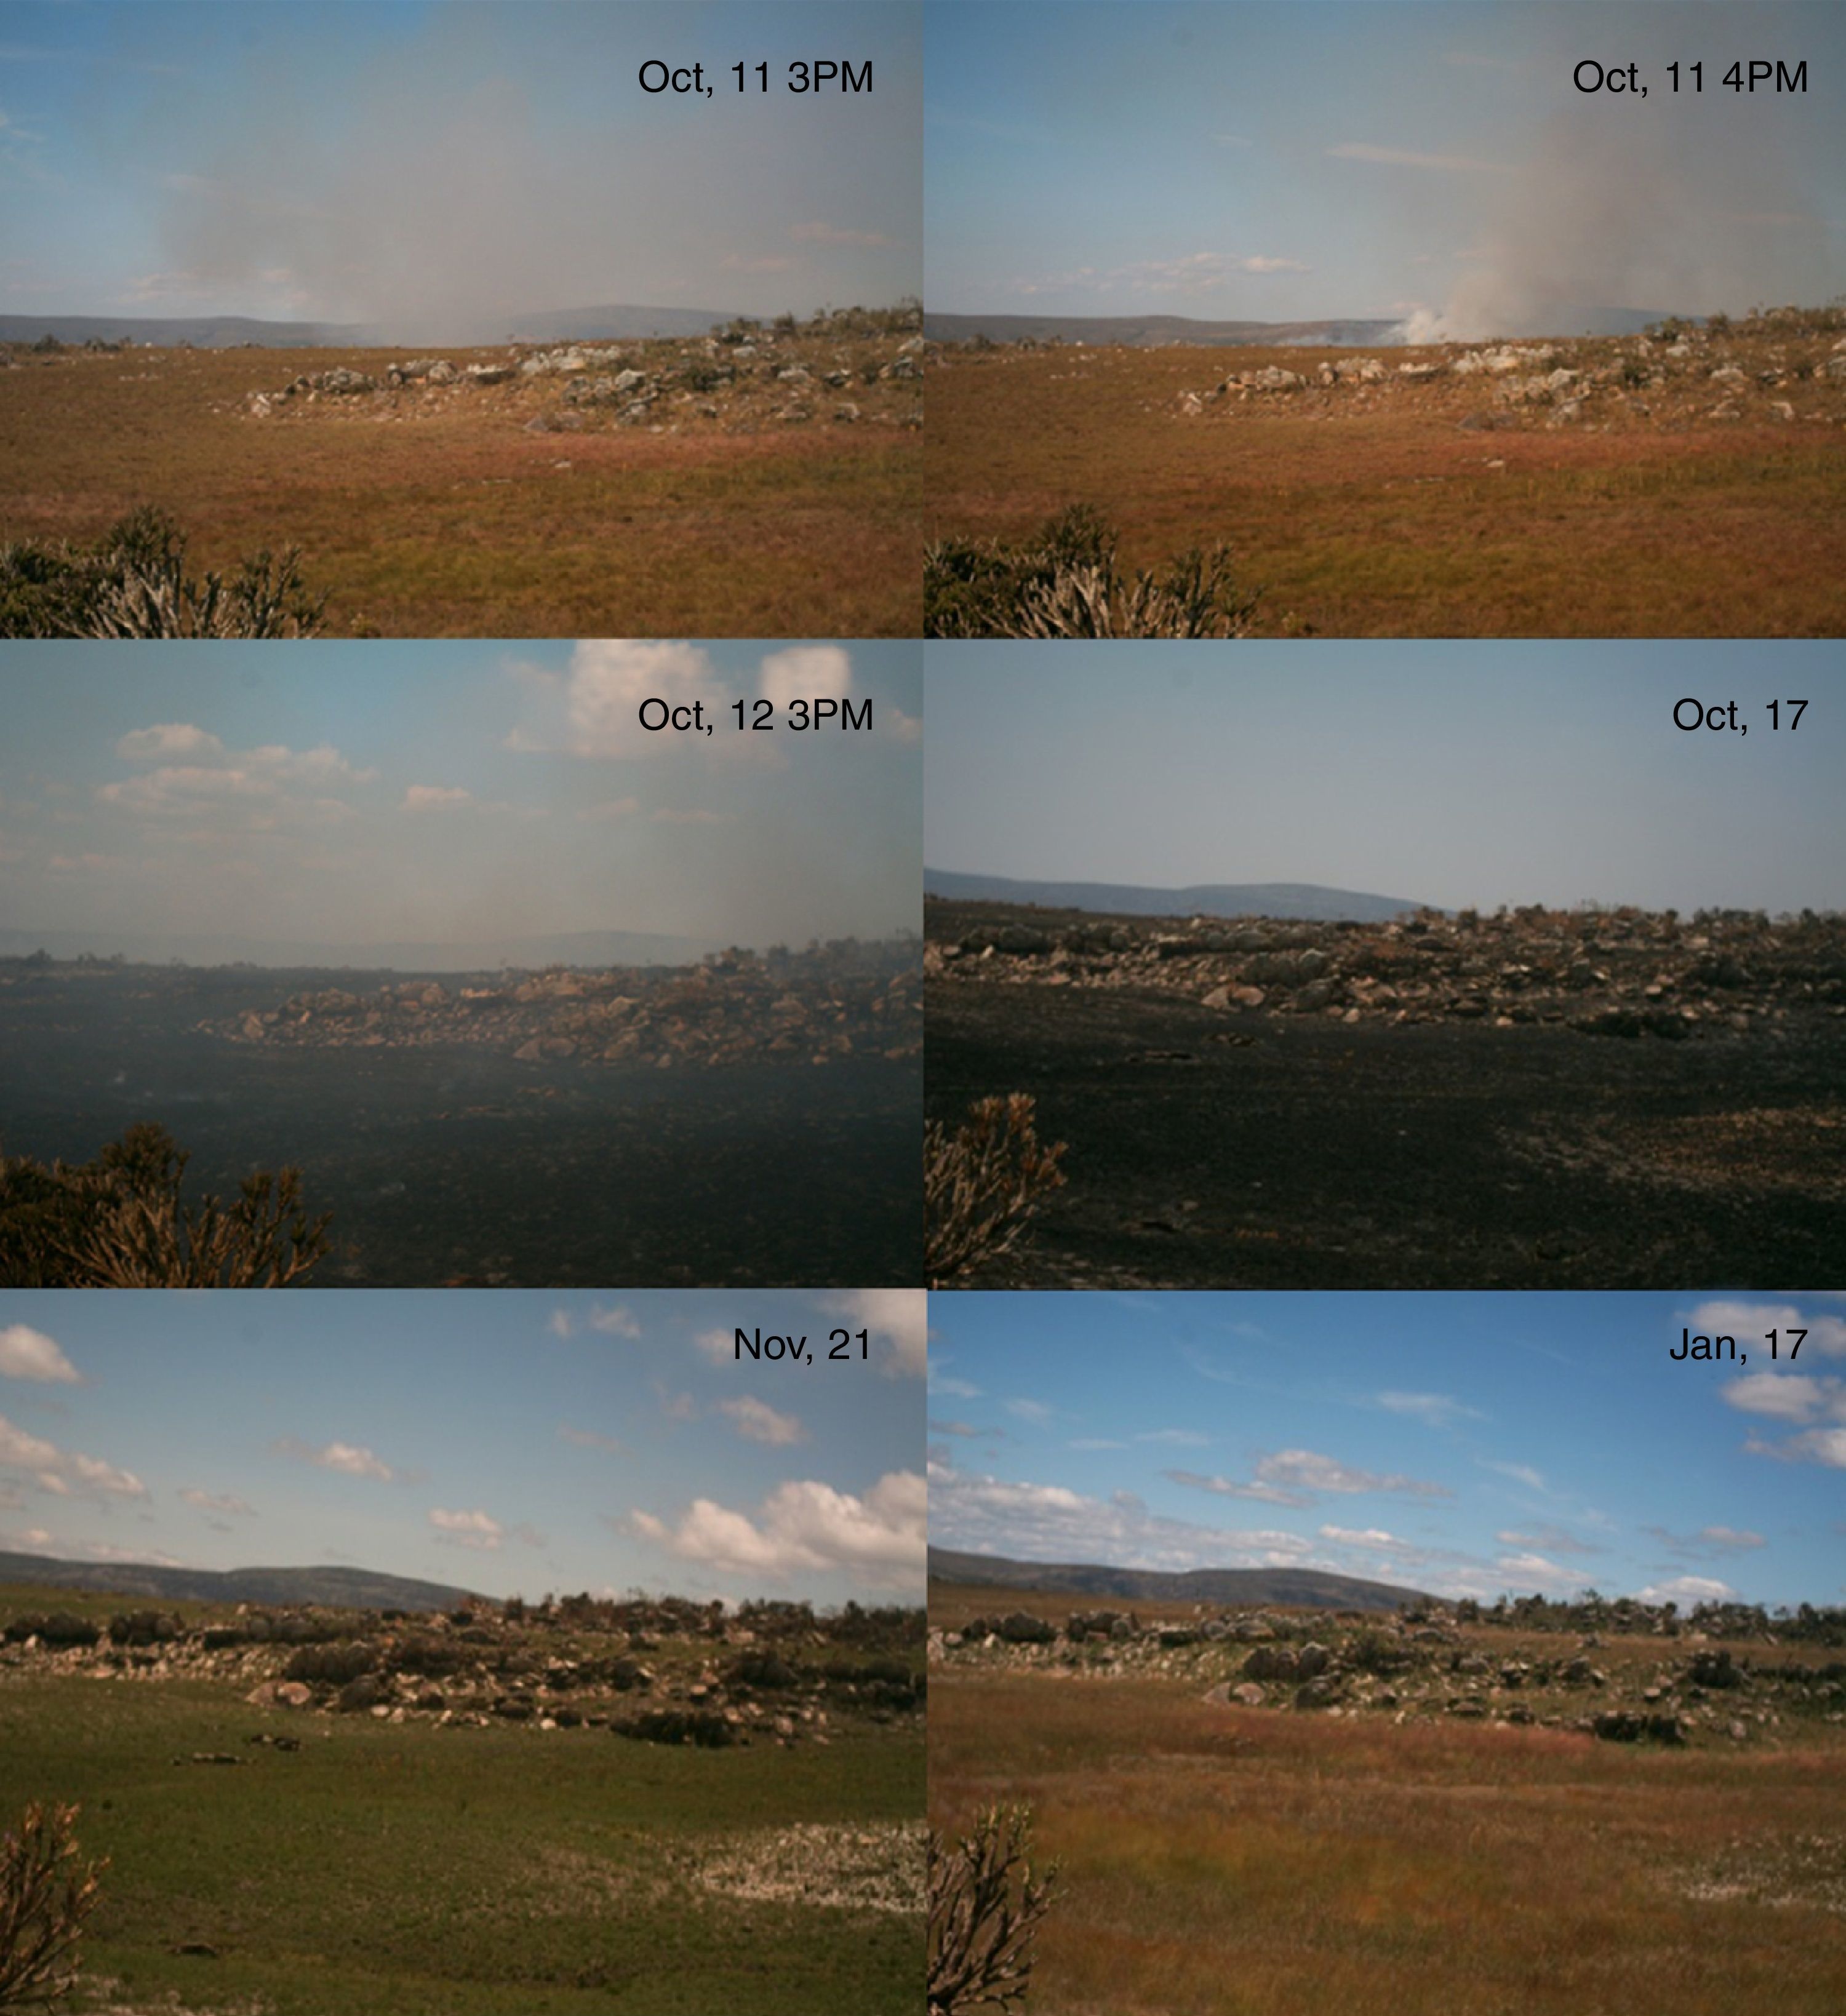
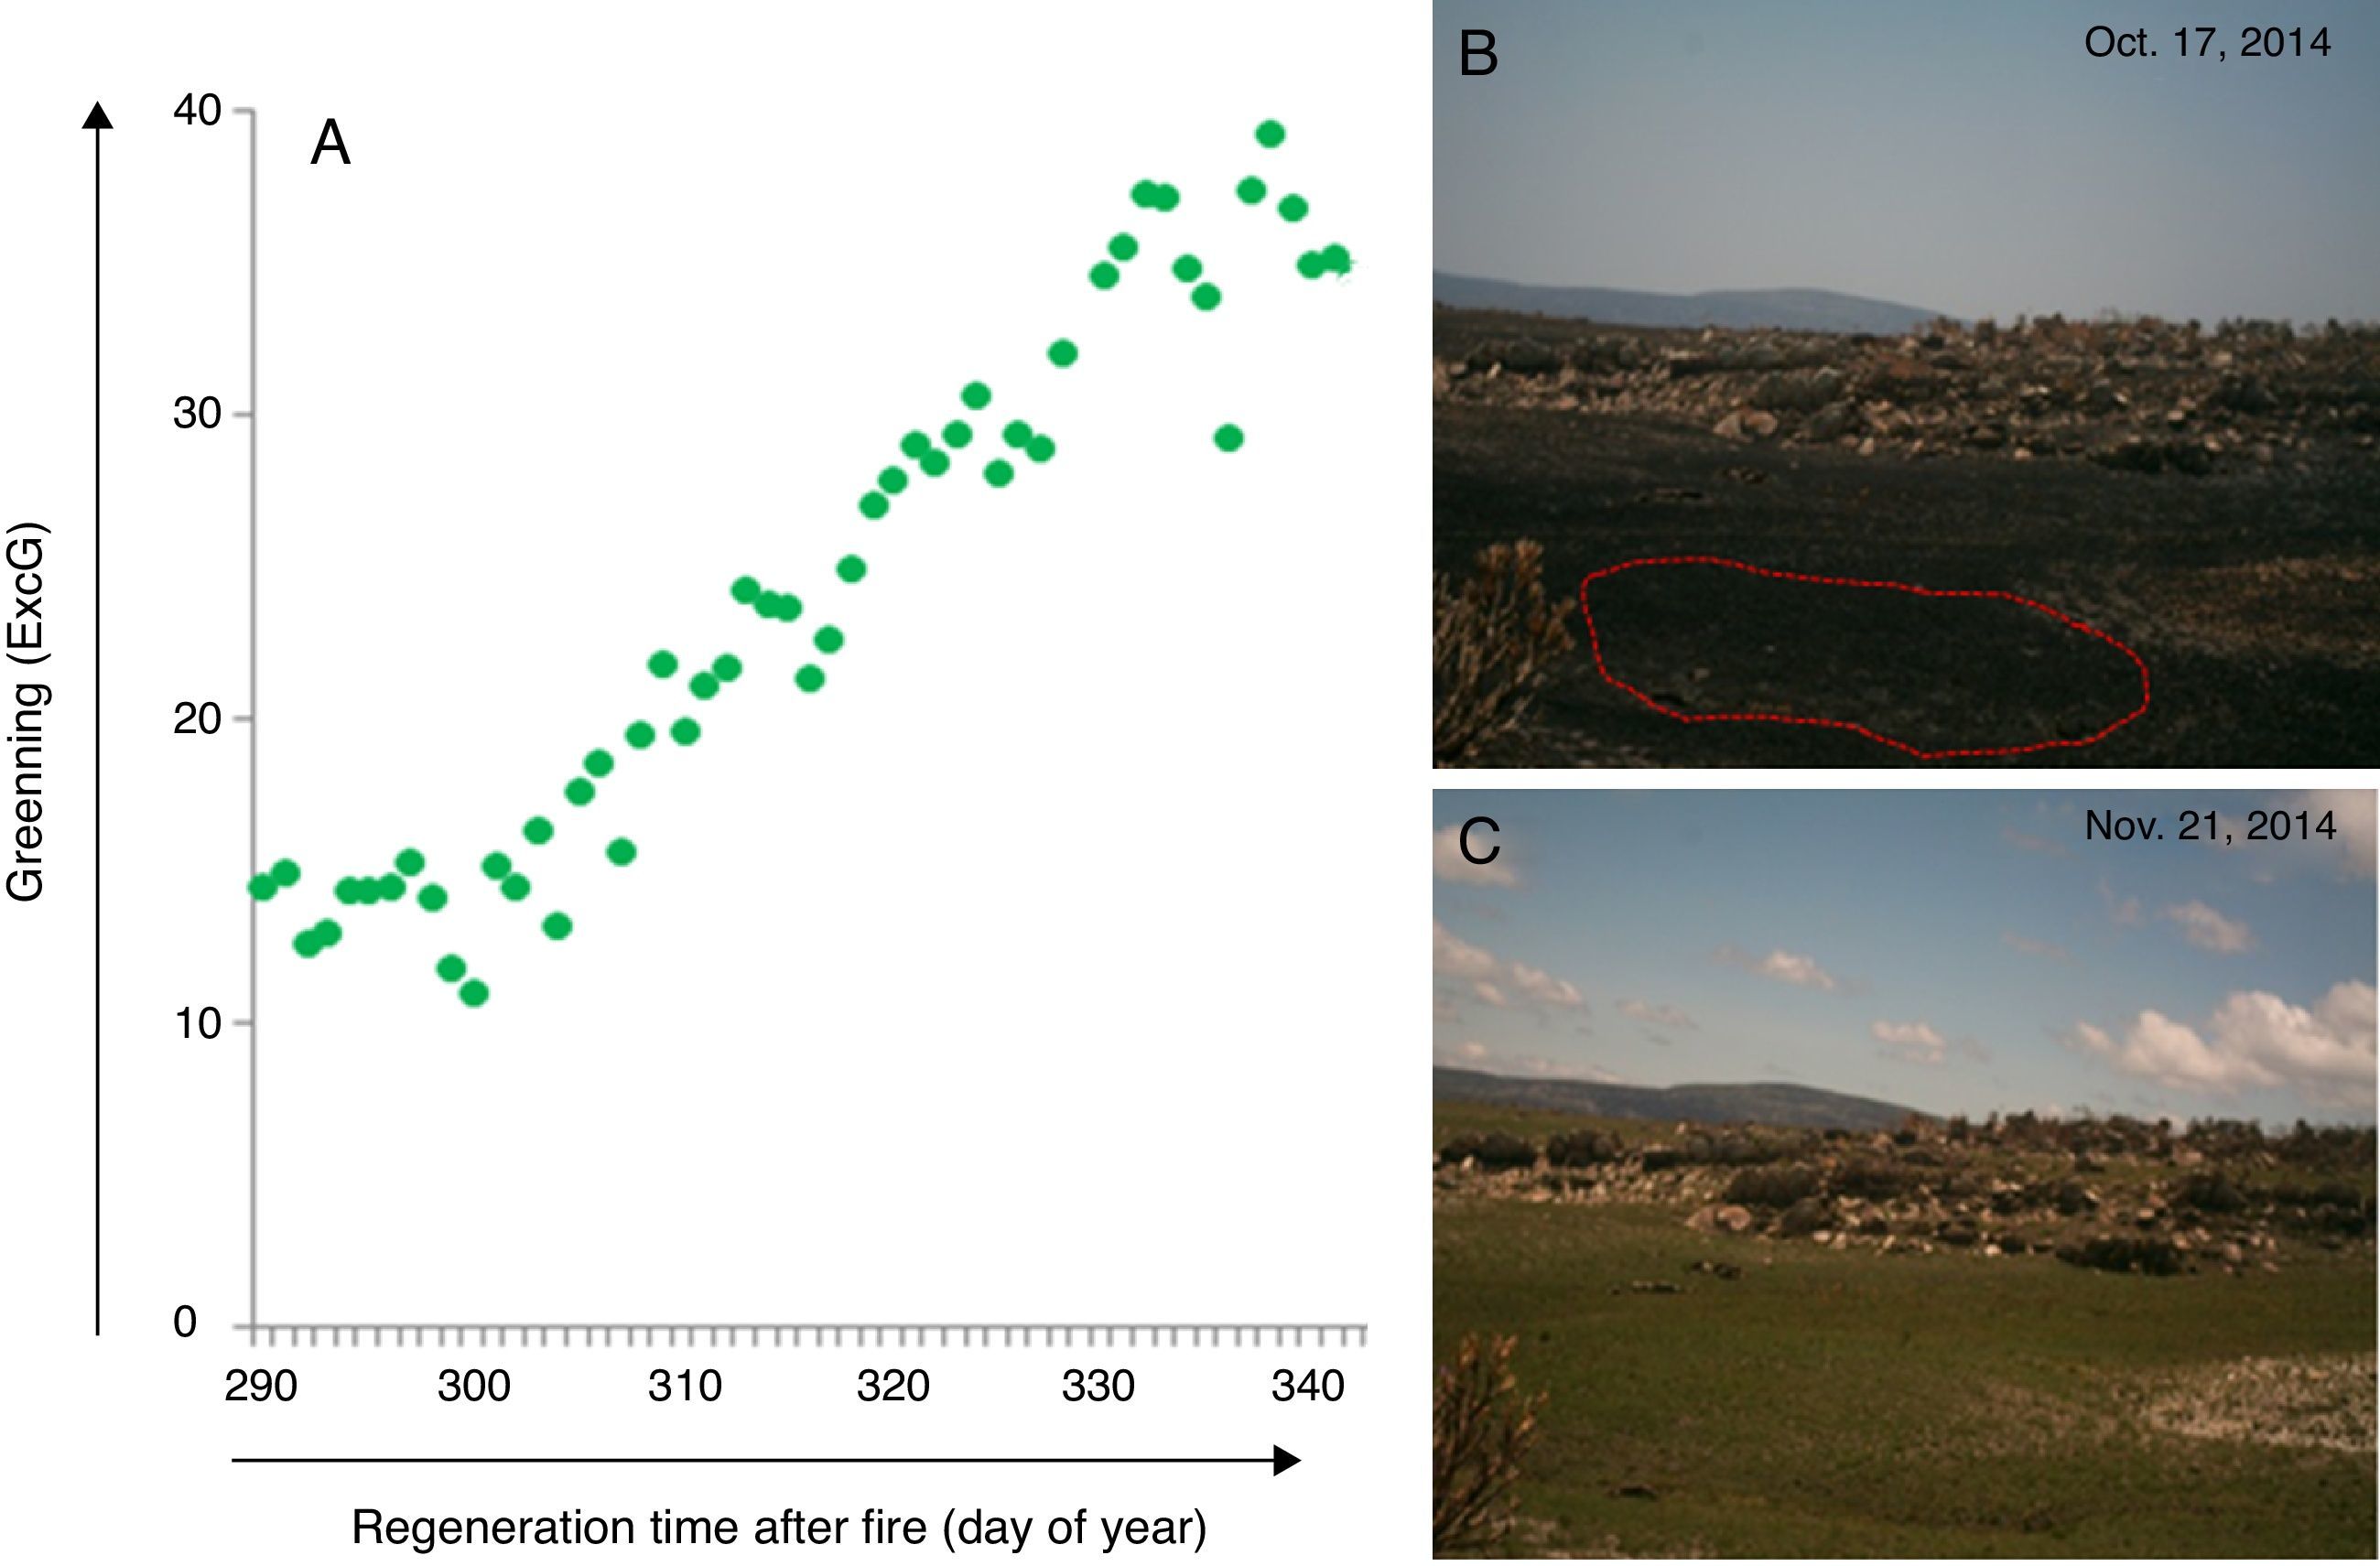
For example, digital cameras from e-phenology project have been integrated into the Brazilian long-term ecological program (PELD) conducted in the fire-prone vegetation mosaic of campo rupestre of Serra do Cipó, Minas Gerais, Southeastern Brazil (PELD CRSC, Fernandes, 2016, http://labs.icb.ufmg.br/leeb/index_peld.html). The resulting time series are the first description of the leafing patterns across four campo rupestre vegetations (Borges in prep.). The phenocam monitoring system has also allowed detecting the time of fire occurrence and vegetation recovery after fire in real time at Serra do Cipó (Fig. 4) (Alberton, Alvarado et al. in prep.). Through a set of daily photographs, it is possible to visualize the process of post fire vegetation recovery showing the regrowth response of this wet grassland vegetation (Fig. 5, see legend for more details), also tracked by the camera derived vegetation index (Fig. 5a and b). Anthropogenic fire may threat even the campo rupestre fire-prone vegetation, since the time, intensity, and frequency of human-induced fires impose additional stress on plants (Alvarado et al., 2017). The time lapse cameras are therefore accessible tools to monitor, manage and prevent fire.

 Graphic representing a camera derived vegetation index (Excess Green) extracted from a set of photographs showing the greening curve after a fire event. (B) First day after fire event as represented by the day of year 291; (C) vegetation recovered after 34 days; Green dots represent Green daily value of the 90th percentile of the Excess green index (90th ExcG) from digital images taken by a time lapse camera every hour, from 6:00 h to 18:00 h.")
Post-fire vegetation recovery scheme of a wet grassland habitat at Serra do Cipó, south of Espinhaço Mountain Range, Minas Gerais State, Brazil. (A) Graphic representing a camera derived vegetation index (Excess Green) extracted from a set of photographs showing the greening curve after a fire event. (B) First day after fire event as represented by the day of year 291; (C) vegetation recovered after 34 days; Green dots represent Green daily value of the 90th percentile of the Excess green index (90th ExcG) from digital images taken by a time lapse camera every hour, from 6:00 h to 18:00 h.
Phenological information has a key role in restoration process, such as timing improvement for restoration implementation, provides suitable indicator to assess restoration success, and allows schedule restoration actions through continuum monitoring (Buisson et al., 2017). Phenocams can improve restoration by matching key steps raised by Buisson et al. (2017) for restoration projects, such as: identifying and monitoring fire regime; using phenological metrics as indicators of restoration success, optimizing fire management; and improving restoration monitoring with continuum vegetation record that might be used to evaluate predefined goals and future practices of the restoration process. Successful restoration ideally requires previous knowledge of the vegetation structure and species’ phenology, a critical information to define restoration practices, access the post-restoration success, plan management actions and improve new restoration procedures (e.g., Carter and Blair, 2012).
Biological conservation in a digital worldPhenocams networks built in interactive websites enriched with dynamic vegetation imagery may engage volunteer participation of population to generate science knowledge, playing an important role in education for conservation and citizen science programs. One example is the project called Season Spotter (Kosmala et al., 2016). Through volunteer participation involving tasks as detection of flowers and new leaves in an image database, the project has gained useful science knowledge. The main results were related to: detection of reproductive phenophases; selection of tree individuals by the users, facilitating the scaling from organisms to ecosystems; and the validation of phenological observations by the images, which improves the development of new algorithms for automatic detection. Besides, these initiatives go beyond scientific knowledge valuing citizen participation and boosting population interest for nature conservation.
The growth of cameras sensors technology has the potential to build global networks able to monitor not only plants, but also all biodiversity. A worldwide system with standardized metadata, field protocols, and databases developed by scientific community and integrated with citizen science participation, is one of the actions needed to achieve the objectives of the Convention on Biological Diversity's 2011–2020 plans. Current applications to collect ecological data using remote cameras have been used by eMammal and TEAM projects (Steenweg et al., 2017). Examples of focal species included were: grizzly bear (Ursus arctos), tragopan (Tragopan blythii), wolverine (Gulo gulo), mule deer (Odocoileus hemionus), coyote (Canis latrans), African bush elephant (Loxodonta africana), and others. The studies involved not only biodiversity measurements, but also the underlying causes of biodiversity changes (e.g., impacts of climate change and trophic interactions in a cervid in Brodie et al., 2014; evaluating landscape connectivity in Barrueto et al., 2014; camera surveys including large carnivors and herbivores communities, and the effects in food webs respectively in Ripple et al., 2014; Hooper et al., 2012; and evaluate reproductive success in female grizzly bears in Fisher et al., 2014).
The ongoing addition of new devices, high-resolution data survey, and sensor networks has improving the quality of data collected in biological studies, but at the same time increasing the magnitude of scientific data collected. Big data is one important challenge for biodiversity conservation. This leads to the next generation of scientific problems, which will require the establishment of multidisciplinary teams (Hey and Hey, 2006). e-Science is about the collaboration of key areas of science, as a network of research initiative focused on the specification and implementation of a set of tools and technologies capable of supporting, improving, and speeding up data analysis, knowledge discovery, and decision making (Hey and Hey, 2006). The e-phenology was designed as an e-Science project, and we present some examples of our research on digital camera image analysis and the tools devised in the context of e-Science collaboration. We use machine learning algorithms to plant species identification concerning the identification of each tree crown of the vegetation in the image (Almeida et al., 2014). The tool helps important steps from plant identification in the field to the definition of new ROIs for the image analysis speeding up the process and allowing grouping similar species in an image even with no previous identification, a useful tool for conservation remote monitoring systems. Through the years, several approaches have been proposed to support the identification of individuals of particular species (Almeida et al., 2015b; Almeida et al., 2016b; Faria et al., 2016a; Faria et al., 2016b). We developed a tool to map the greenness in the image time series, the chronological percent map by PhenoVis (Leite et al., 2016). A database specific for phenological data was also developed in the framework of e-phenology project do deal with big-data issues and improve access to information (Mariano et al., 2016).
ConclusionsWe have presented a first-step protocol with the main information about repeated photography method and set up (Supplementary Material), to increase the potential of a new tropical phenology research program in this promising area, fostering network and collaboration (Box 1).
- •
install phenocams in a wide variety of landscapes and ecosystems, taking advantage of low-cost cameras when necessary.
- •
use electricity in the towers whenever it is possible, when setting up powerful cameras.
- •
choose sensors with good seal capability, adopt careful procedures in the installation process considering problems as excess of humidity, sun exposition, and invasion by bugs.
- •
standardize images formats and settings for multi-site monitoring.
- •
integrate your phenocams to a network, facilitating wide-scale collaborative research, enabling combine information across biomes and climatic zones, and widening the applicability for biodiversity conservation.
- •
set up new cameras in association with sites where long-term studies are being developed, such as the Brazilian Long-term Ecological Research PELD (Projetos Ecológicos de Longa Duração) and flux towers.
- •
explore tools or even create your own software and scripts for images processing, to support and facilitate data analysis.
- •
establish a e-Science collaborative research with computer scientists, improving visual and image analysis techniques, big-data management, investing in a new generation of “hybrid” scientists with a multidisciplinary profile and larger spectrum of actuation.
Phenology has its well-defined role in conservation biology (Morellato et al., 2016) and, in this context, we demonstrate that near-surface remote phenology and phenocam networks are powerful tools for conservation. Besides the capability of a fine temporal resolution associated with wide spatial monitoring coverage, phenocams can bring new information for management and restoration practices at several sites and environments, and can also be applied in education for conservation and citizen science through websites with phenological databases enriched by imagery data. The creation of phenology networks, still lacking for tropical countries, will broader and fine-tune research on phenological drivers and long-term monitoring to investigate and model the impacts of climate changes in the tropics. The pioneer e-phenology is the venue to reach those goals in Brazil. Lastly, phenocams could be easily integrated as a monitoring tool at any conservation unity, aggregating invaluable information of wide use for researchers and managers, from phenology to ecosystem dynamics and changes over space and time.
Our research is supported by FAPESP, the São Paulo Research Foundation (grants #2010/52113-5 and #2013/50155-0 FAPESP-Microsoft Research Virtual Institute). LPCM and RST receive a Research Productivity Fellowship from CNPq, the National Council for Scientific and Technological Development (grants #306243/2010-5 and #306587/2009-2). FAPESP also provided fellowships to BA (grants #2014/00215-0 PhD and #2016/01413-5 BEPE), LFC (grant #2014/13354-8), BDB (grant #2014/07700) and GM (grant #2011/51523-8). GM receives a PhD fellowship from CNPq (grant #162312/2015-6). We have also been benefited from funds from CNPq, CAPES (Coordination for the Improvement of Higher Education Personnel), and FAPESP (grants #2007/52015-0, #2007/59779-6, #2009/18438-7, #2010/51307-0, and #2016/06441-7). We thank the members of the Phenology Laboratory from UNESP, and RECOD Laboratory from UNICAMP and all our collaborators, especially: Dr Magna Soelma from Embrapa Petrolina and leader of the Caatinga Flux Project, Dr. Humberto Rocha and his technical-team from the IAG (USP), Dr GW Fernandes, Reserva Vellozia and the PELD-CRSC and all the research team supported by CNPq, the Cedro Company, the Parque Nacional da Serra do Cipó, private land owners, and the Instituto Florestal de São Paulo for allowing the research in the ecological stations, reserves and sites.
The following are the supplementary data to this article:

