

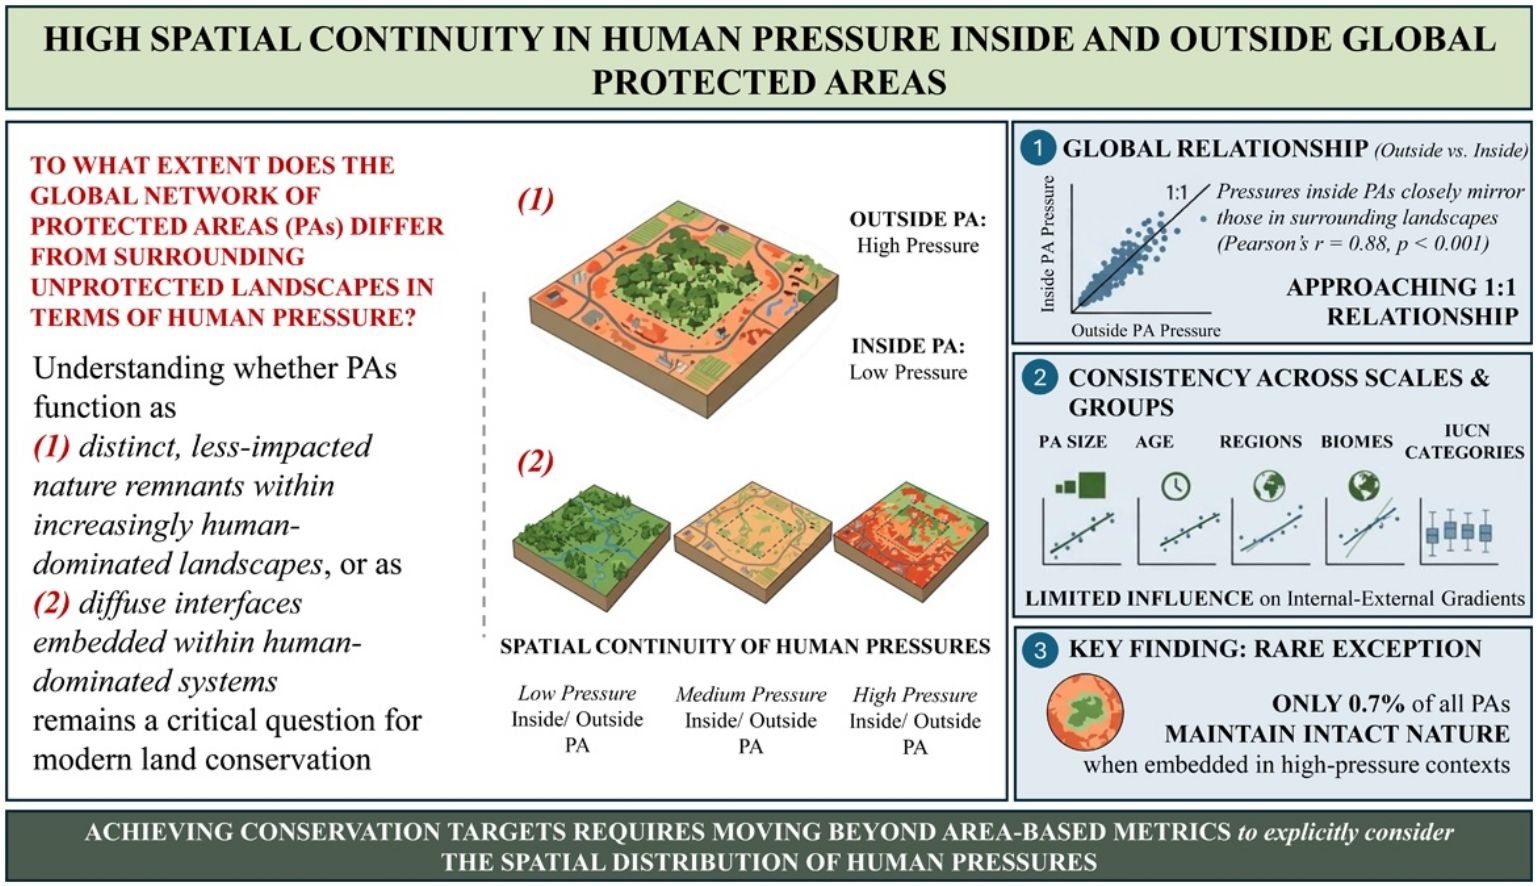

Protected areas (PAs) are often viewed as distinct, less-impacted nature remnants within increasingly human-dominated landscapes. However, whether this perceived ecological contrast holds true at the global level has never been systematically assessed. Here, using Human Footprint data for over 149,000 terrestrial PAs, we provide the first global analysis of the spatial continuity of human pressure inside and outside PA boundaries. We find that pressures inside PAs closely mirror those in surrounding landscapes, approaching a 1:1 relationship (global Pearson’s r = 0.88, p < 0.001), a pattern consistent across regions, biomes, IUCN categories, PA sizes, and years of establishment, and robust across multiple spatial scales. Notably, only 0.7% of all protected patches maintain low internal pressure while being embedded in highly pressured landscapes. The pervasive lack of spatial contrast between protected areas and surrounding multi-use landscapes indicates that achieving ambitious conservation targets may require moving beyond area-based metrics to explicitly consider the spatial distribution of human pressures within and around PAs.
Human activities are driving biodiversity loss at an unprecedented scale, compromising not only species survival but also the ecosystem services essential for human well-being and global stability (IPBES, 2019). Land-use change, direct exploitation of natural resources, pollution, and urban expansion are strongly associated with this accelerating crisis (Díaz et al., 2015; Jaureguiberry et al., 2022). In response, protected areas (PAs) have become a central strategy in global conservation efforts. Today, approximately 17% of the Earth’s land surface is under some form of protection, and international frameworks, such as the Kunming-Montreal Global Biodiversity Framework, aim to expand this to 30% by 2030 (the “30×30” target) (CBD, 2022; UNEP-WCMC and IUCN, 2024).
Yet, designation alone does not ensure ecological integrity. Many PAs are embedded in profoundly anthropogenic landscapes, with significant human pressures occurring inside their borders (Jones et al., 2018; Mu et al., 2021; Vijay and Armsworth, 2021). But despite growing evidence of high internal pressure, a fundamental question remains: to what extent does the global network of PAs differ from surrounding unprotected landscapes in terms of human pressure? Previous research has largely been regional (e.g., focused on tropical forests) or limited to single stressors (e.g., forest loss, built-up areas) (Fuente et al., 2020; Joppa et al., 2008; Laurance et al., 2012), leaving a critical gap in understanding the spatial continuity of human pressure inside and outside PA boundaries worldwide.
Understanding whether PAs function as isolated "islands" of nature or as diffuse interfaces embedded within human-dominated systems remains a critical question for modern land conservation (Geldmann et al., 2019; Laurance et al., 2012; Watson et al., 2014). On a planet increasingly shaped by human activity, high spatial continuity between PAs and their surroundings may arise from both historical land-use patterns prior to designation (legacy effects) and progressive post-designation encroachment. More than 150 years after the creation of the first modern PAs, evaluating the resulting global spatial configuration, specifically the degree of continuity or contrast in cumulative pressures across boundaries, is essential for understanding the structural role of the global PA network in the Anthropocene.
To address this, we present the first global assessment of spatial continuity in cumulative human pressure across protected and unprotected lands. Using the global Human Footprint index (Mu et al., 2022; Sanderson et al., 2002; Venter et al., 2016), a 1-km resolution metric of cumulative human pressure, we examine how key structural attributes, such as size, age, and IUCN management categories (which range from strict nature reserves to multiple-use areas) shape these internal-external gradients across global regions and biomes. By revealing how PAs are structurally embedded within broader landscapes of human influence, this analysis provides new, globally comprehensive insights into the spatial configuration of protected lands, offering a critical foundation for informing conservation strategies and progress toward the United Nations Sustainable Development Goals.
MethodsCumulative human pressure datasetThis study used the 2018 Human Footprint dataset developed by Mu et al. (2022), which integrates multiple anthropogenic pressures at a spatial resolution of 1 km². The cumulative human pressure metric combines data on built infrastructure, intensive agriculture, grazing, population density, night lights, roads, railways, and navigable waterways. These pressure layers have been shown to correlate directly with biodiversity patterns (Allan et al., 2017; Williams et al., 2020).
In this study, thresholds for categorizing “intact nature” and “intense human pressure” follow the conventions established by Mu et al. (2022) and Venter et al. (2016), which are widely used in global and regional conservation research (Ward et al., 2020). Specifically, a Human Footprint value of ≥4 denotes landscapes primarily characterized by grazing or overlapping anthropogenic stressors, marking the onset of significant human influence likely to threaten biodiversity through habitat conversion. Values exceeding 7 correspond to intensive agricultural use, typically involving more than 20% land cover, or the co-occurrence of multiple stressors (e.g., grazing areas adjacent to roads with high light pollution). Values greater than 10 indicate highly modified, built-up environments or areas experiencing several simultaneous pressures (e.g., intensive agriculture combined with infrastructure and light pollution). These thresholds provide a standardized framework for interpreting spatial patterns of human pressure and assessing their ecological implications.
Protected areas databaseWe selected terrestrial PAs formally classified under IUCN categories I-VI from the March 2023 release of the World Database on Protected Areas (WDPA) by UNEP-WCMC (https://www.protectedplanet.net/en), and excluded all units designated as “Not Reported” or “Not Assigned”. We excluded Antarctica and Greenland from the analysis. Following previous global studies, we extracted PAs by selecting units larger than 1 km² with a designation status of “designated”, “inscribed”, “adopted”, or “established” (Jones et al., 2018; UNEP-WCMC and IUCN, 2024). Additionally, we excluded PAs designated after 2018 to align with the cumulative human pressure dataset used in this study. The final dataset comprised 149,137 individual PA records globally.
Protected areas and unprotected surroundingsTo avoid boundary conflicts, overlapping PAs, and to ensure external buffers represent true non-protected matrices rather than neighboring reserves, we employed a dissolution process using the dissolve tool in ArcGIS Pro 2.8. This step merged all PA polygons into a single geospatial entity. Subsequently, the “Multipart to Single Part” function was applied to generate individual PAs from this unified dataset. To ensure that the selected PAs were larger than the resolution of the Human Footprint dataset (1-km grid cell size), we filtered the dataset to include only those units with an area greater than 5 km². This approach resulted in the identification of 24,853 merged PAs.
For the unprotected surroundings, we created a 10-km buffer around each resulting merged PA, subsequently excluding any overlapping areas within the global PA network to ensure they strictly represented adjacent unprotected lands. Each merged PA and its buffer were assigned a unique identifier to ensure accurate spatial pairing. While the optimal buffer size may vary across ecological and socio-economic contexts, a 10-km buffer represents a compromise. It captures immediate anthropogenic pressures (e.g., agriculture, infrastructure, urbanization) while avoiding the inclusion of more distant, potentially unrelated areas, enabling consistent global comparisons.
To assess the robustness of our spatial framework, we conducted two complementary sensitivity analyses. First, we evaluated human pressure levels across a continuous distance gradient extending up to 50 km (at 1-km intervals) from PA boundaries to confirm that the primary 10-km buffer captures a stable regional signal. Second, we tested the sensitivity of our internal-external patterns to buffer selection by contrasting the 0−10 km buffer against alternative discrete buffer widths (10−20 km and 20−30 km).
Mean human pressure calculationsWe calculated mean Human Footprint values for each merged PA and its surrounding unprotected landscape using zonal statistics in ArcGIS Pro 2.8. Features were internally rasterized using the cell-center method, such that raster cells were included only if their centers fell within the polygon, thereby minimizing misclassification of boundary pixels. To further account for potential edge effects, we performed an alternative sensitivity analysis by applying a 1-km exclusion buffer to both sides of the PA boundaries. Finally, to evaluate the robustness of our results against potential dataset biases, we replicated the global internal-external spatial analyses using an independent cumulative human pressure dataset (Venter et al., 2016).
Analysis of structural attributes: IUCN categories, size, and ageTo evaluate how structural and management attributes shape internal-external human pressure dynamics, we analyzed internal-external relationships using Pearson correlation coefficients (r) and Locally Estimated Scatterplot Smoothing (LOESS) models across gradients of PA size, IUCN management category (Dudley, 2008; Stolton et al., 2013), and age (year of designation).
The structural effects of PA size (i.e., total merged PA area) were assessed both as a continuous variable (using log-transformed values) and across five discrete size classes: 5–100 km², 100–500 km², 500−1,000 km², 1,000–5,000 km², and greater than 5,000 km² (where each interval excludes the lower bound and includes the upper bound).
Because merged PAs could incorporate different management goals or establishment histories into a single continuous unit, historical age (designation year) and IUCN management categories were evaluated exclusively for PAs composed of a single, individual administrative record.
For the management analysis, this filter resulted in 18,276 single-PA units classified according to IUCN categories (74% of the analytical dataset; Supplementary Table S1). To assess these across a gradient of legal restrictiveness, these PAs were classified into three analytical groups based on the IUCN framework (Dudley, 2008; Stolton et al., 2013): (i) strict protection (Categories I-II), focusing on ecosystem preservation with minimal human intervention; (ii) active conservation management (Categories III-IV), which are primarily biodiversity-oriented but allow targeted management interventions; and (iii) protected landscapes and sustainable use approaches (Categories V-VI), which explicitly recognize the role of human-nature interactions and the sustainable use of natural resources as part of their conservation objectives.
For the historical analysis, the filter resulted in 16,426 single-PA units with available designation years (66% of the analytical dataset; Supplementary Table S1). The effects of PA age were assessed both as a continuous variable (calendar year of designation) and across seven discrete chronological classes covering the period where 95% of global conservation units were established: 1950–1960, 1960–1970, 1970–1980, 1980–1990, 1990–2000, 2000–2010, and 2010−2018 (where each interval excludes the lower bound and includes the upper bound).
Spatial extent of the analysisThe analysis was conducted at both global and regional levels, considering regions that are globally distributed as well as biomes. Global regions were defined based on shared ethnic, economic, and historical characteristics, categorized as follows: Eastern Europe and Central Asia, Latin America and the Caribbean, North America and Australia-New Zealand, Southeast Asia and Oceania, Southwest Asia and North Africa, Sub-Saharan Africa, and Western Europe. Country assignments to these regions follow the classification detailed in Supplementary Table S2. Biome boundaries were sourced from Ecoregions2017©Resolve (available at https://ecoregions.appspot.com/).
ResultsGlobal and regional baseline of human pressure within protected areasBefore evaluating the spatial contrast across protection boundaries, we established a comprehensive baseline of cumulative human pressure strictly within protected lands. Globally, an estimated 33% of protected lands are exposed to intense human pressure (Human Footprint ≥4), driven primarily by grazing lands, croplands, and built environments. This internal pressure, however, varies markedly across geographic regions: in Western Europe, for instance, over 75% of protected area territory exceeds this pressure threshold, and at a national level, more than 80% of countries globally manage protected networks where at least 75% of the protected surface experiences similarly intense human influence (Supplementary Figs. S1, S2). This widespread anthropogenic footprint within boundaries provides critical context for analyzing whether PA networks act as distinct, less-impacted remnants or merely reflect broader landscape-level pressures.
Spatial continuity of human pressure inside and outside protected areasAt a global level, human pressures within PAs closely mirror those of their surrounding unprotected landscapes (Pearson’s r = 0.88, p < 0.001), revealing a high degree of spatial continuity inside and outside protection boundaries, as illustrated conceptually and empirically (Fig. 1A and B). The strength of this relationship changes slightly along the gradient of external pressure: In landscapes with minimal external human pressure, internal pressures are similarly low and minor differences are observed, as expected. As external human pressure intensifies, internal pressure within PAs also increases, though at a slightly reduced rate. When external pressure reaches ∼12 units on the Human Footprint scale (0–50), a level indicative of very intense human impact, internal pressure increases proportionally but remains ∼3 units lower, demonstrating a consistent, parallel relationship between pressures inside and outside PAs (Fig. 1A).
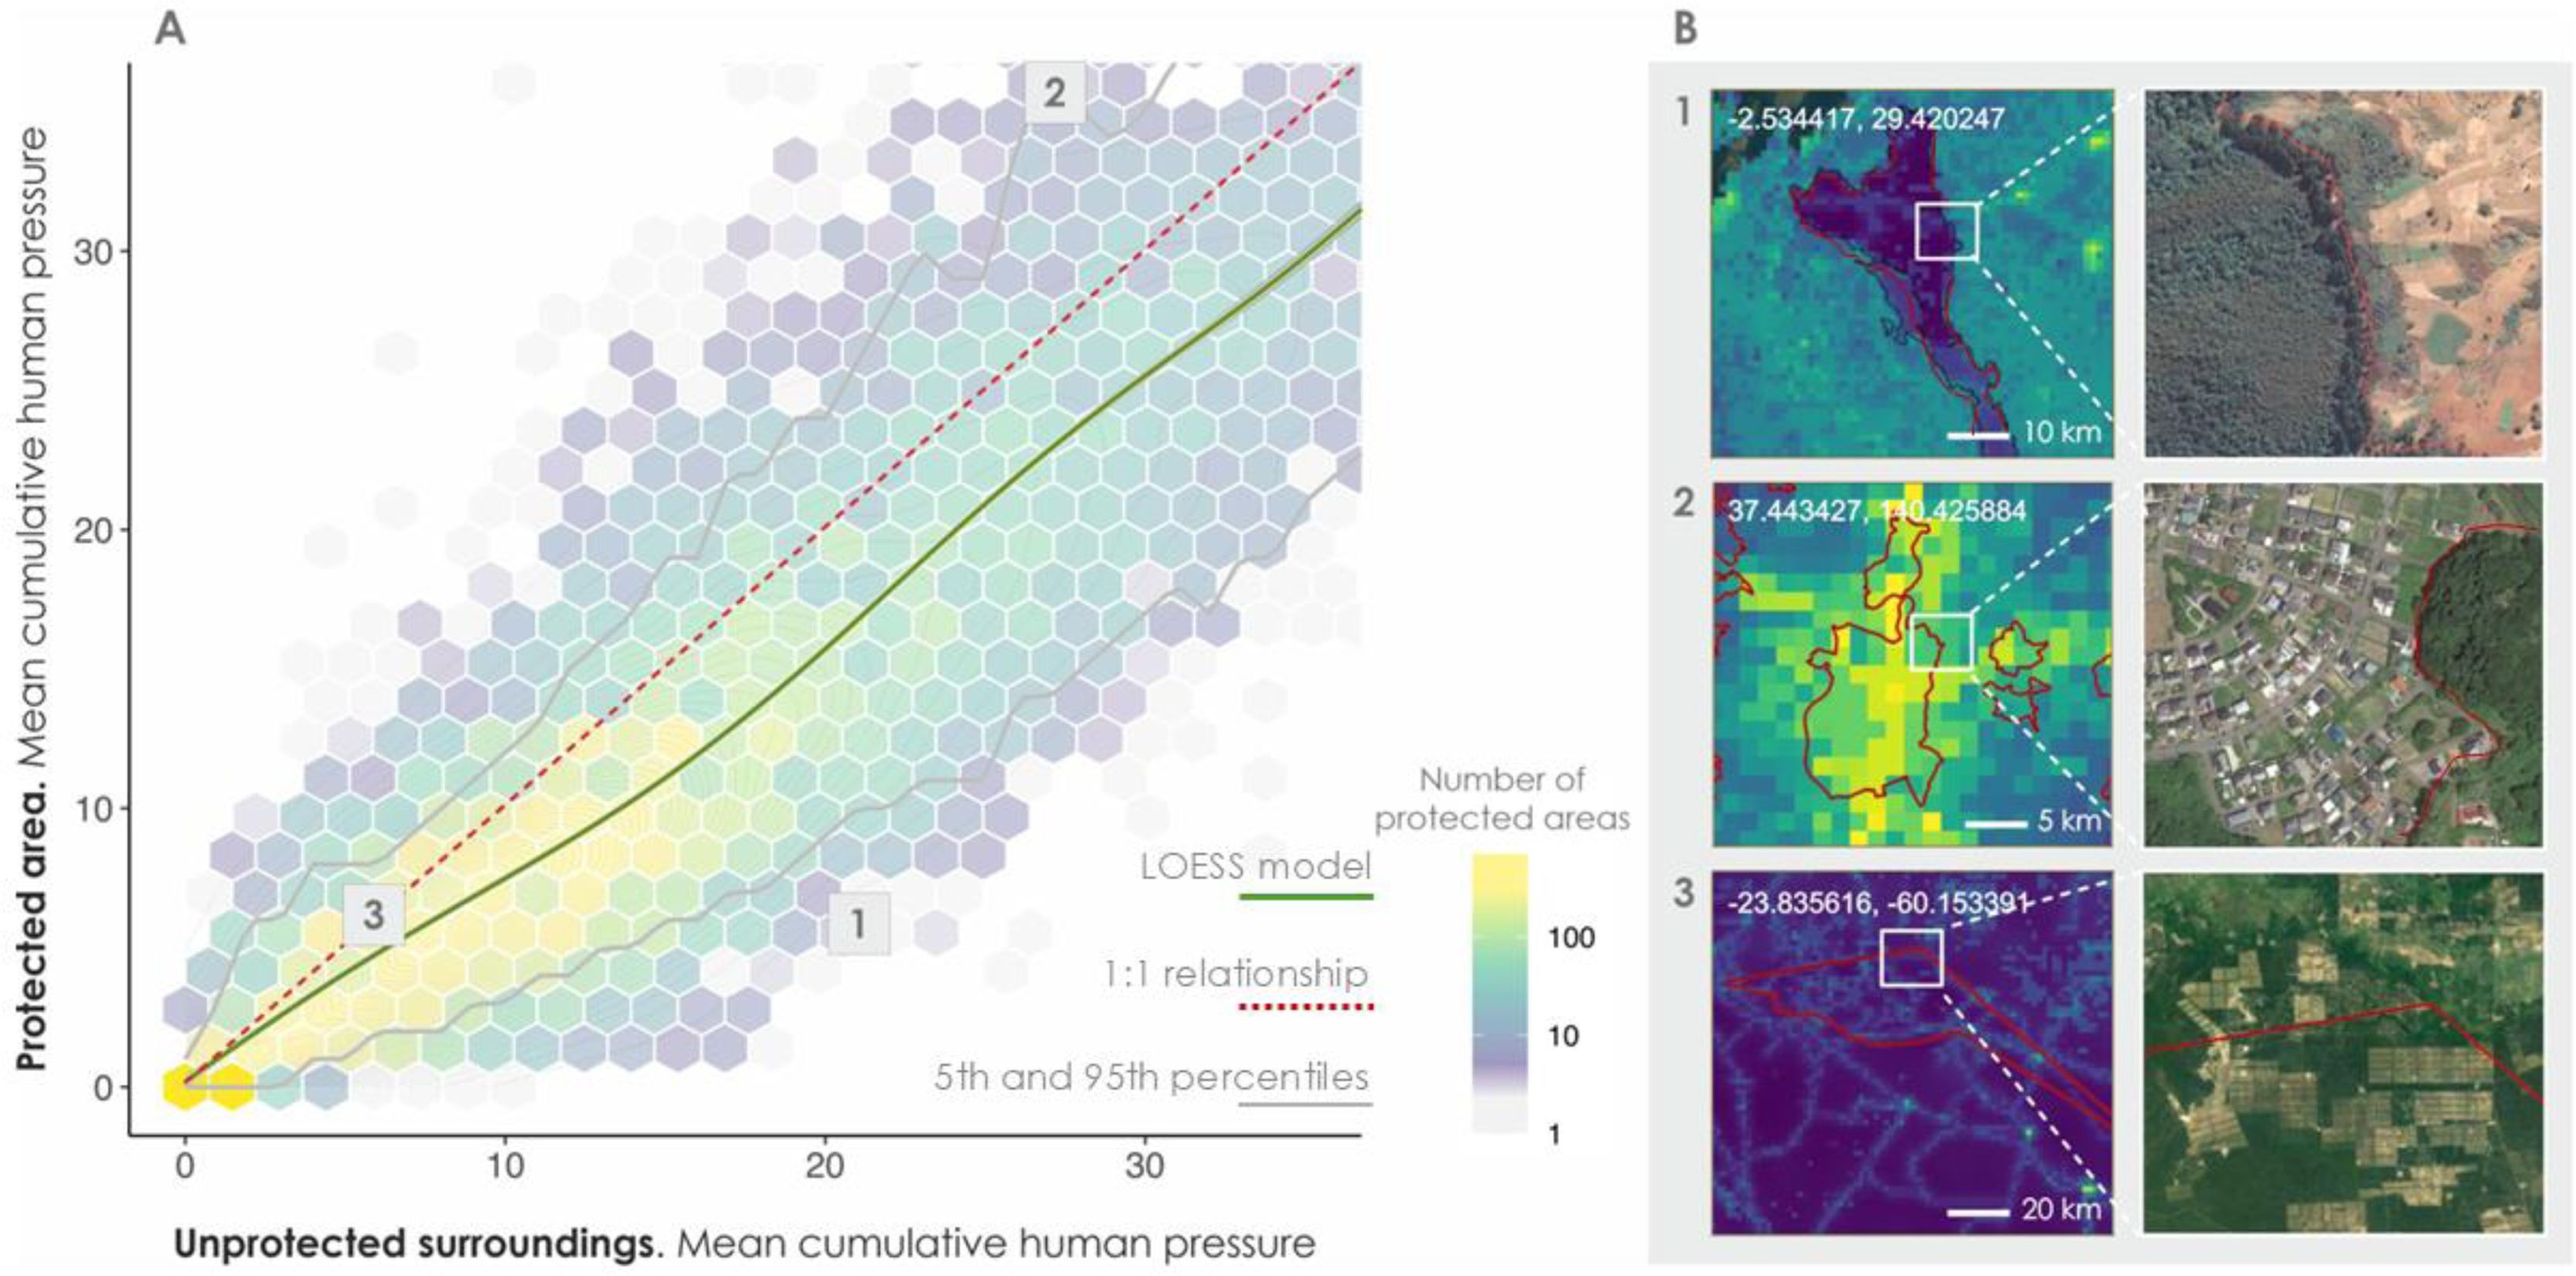
Global pattern of internal-external human pressure in protected areas. (A) Mean cumulative human pressure inside PAs (y-axis) versus in surrounding unprotected areas (10-km buffer; x-axis). Due to the large number of overlapping points, values are aggregated into hexagonal cells, with bright yellow cells indicating higher density of PAs. A LOESS model is presented in green to visualize the relationship between the two variables. The red line represents the 1:1 relationship, and the gray lines indicate the 5th and 95th percentiles. (B) Schematic examples of different “internal-external” levels of human pressure. The left column shows raster maps of cumulative human pressure, with brighter yellow cells indicating higher human pressure. The right column presents corresponding high-resolution satellite imagery obtained from Google Earth in 2025 (Map data ©2025 Google), highlighting landscape features at PA boundaries. Coordinates refer to the centroid of the rectangle shown in each image and are reported in the WGS84 geographic coordinate system. Red lines indicate the boundaries of PAs.
Notably, PAs that retain “intact nature” (internal pressure <4) while being surrounded by intense human pressure are exceptionally scarce (6.6% of all PAs). Among these intact PAs, 2.4% are surrounded by external pressures >7, typically associated with intensive agriculture or multiple co-occurring stressors, and only 0.7% by very high-pressure levels >10, indicative of built-up or heavily modified environments, raising important questions about the role of the global PA system in conserving low-pressure areas.
The observed spatial continuity is highly robust and independent of methodological choices, such as edge effects at PA boundaries or buffer configurations. After removing a conservative 1-km strip along all PA borders to enforce a strict 2-km separation between internal and external zones, the strong correlation between internal and external pressures persists (global Pearson’s r = 0.82, p < 0.001). This indicates that boundary pixel misclassification does not drive the global pattern. Similarly, human pressure levels remain consistently stable across an extended distance gradient up to 50 km from PA boundaries, confirming that the primary 10-km buffer captures a representative landscape signal rather than a localized edge artifact. This spatial continuity is further confirmed by alternative buffer widths (10−20 km, 20−30 km) and an independent Human Footprint dataset (Supplementary Figs. S3–S6).
This structural pattern holds across major global regions, biomes, and countries, indicating the pervasive continuity of human pressures across protection boundaries regardless of geographic context (Fig. 2A and B; Supplementary Fig. S7). National-level correlations are overwhelmingly positive, and pressure differentials between PA interiors and surrounding areas remain consistently narrow across biomes and regions (Supplementary Figs. S8, S9). At the regional and biome levels, correlation coefficients remain remarkably strong and stable, ranging from 0.83 to 0.89 (p < 0.001) across most regions, with minor exceptions, such as in sub-Saharan Africa (r = 0.79) or tundra environments (r < 0.7) (Supplementary Tables S3, S4). However, this global continuity of human pressures across PAs and their unprotected surroundings does not imply global uniformity. Pressure centroids vary meaningfully across regions and biomes (Fig. 2A and B), largely reflecting broader differences in land-use history and human pressure intensity. For example, PAs in Western Europe and Southeast Asia and Oceania exhibit some of the highest cumulative pressure values globally (Fig. 2A; Supplementary Figs. S1, S2), despite long-standing conservation infrastructures.
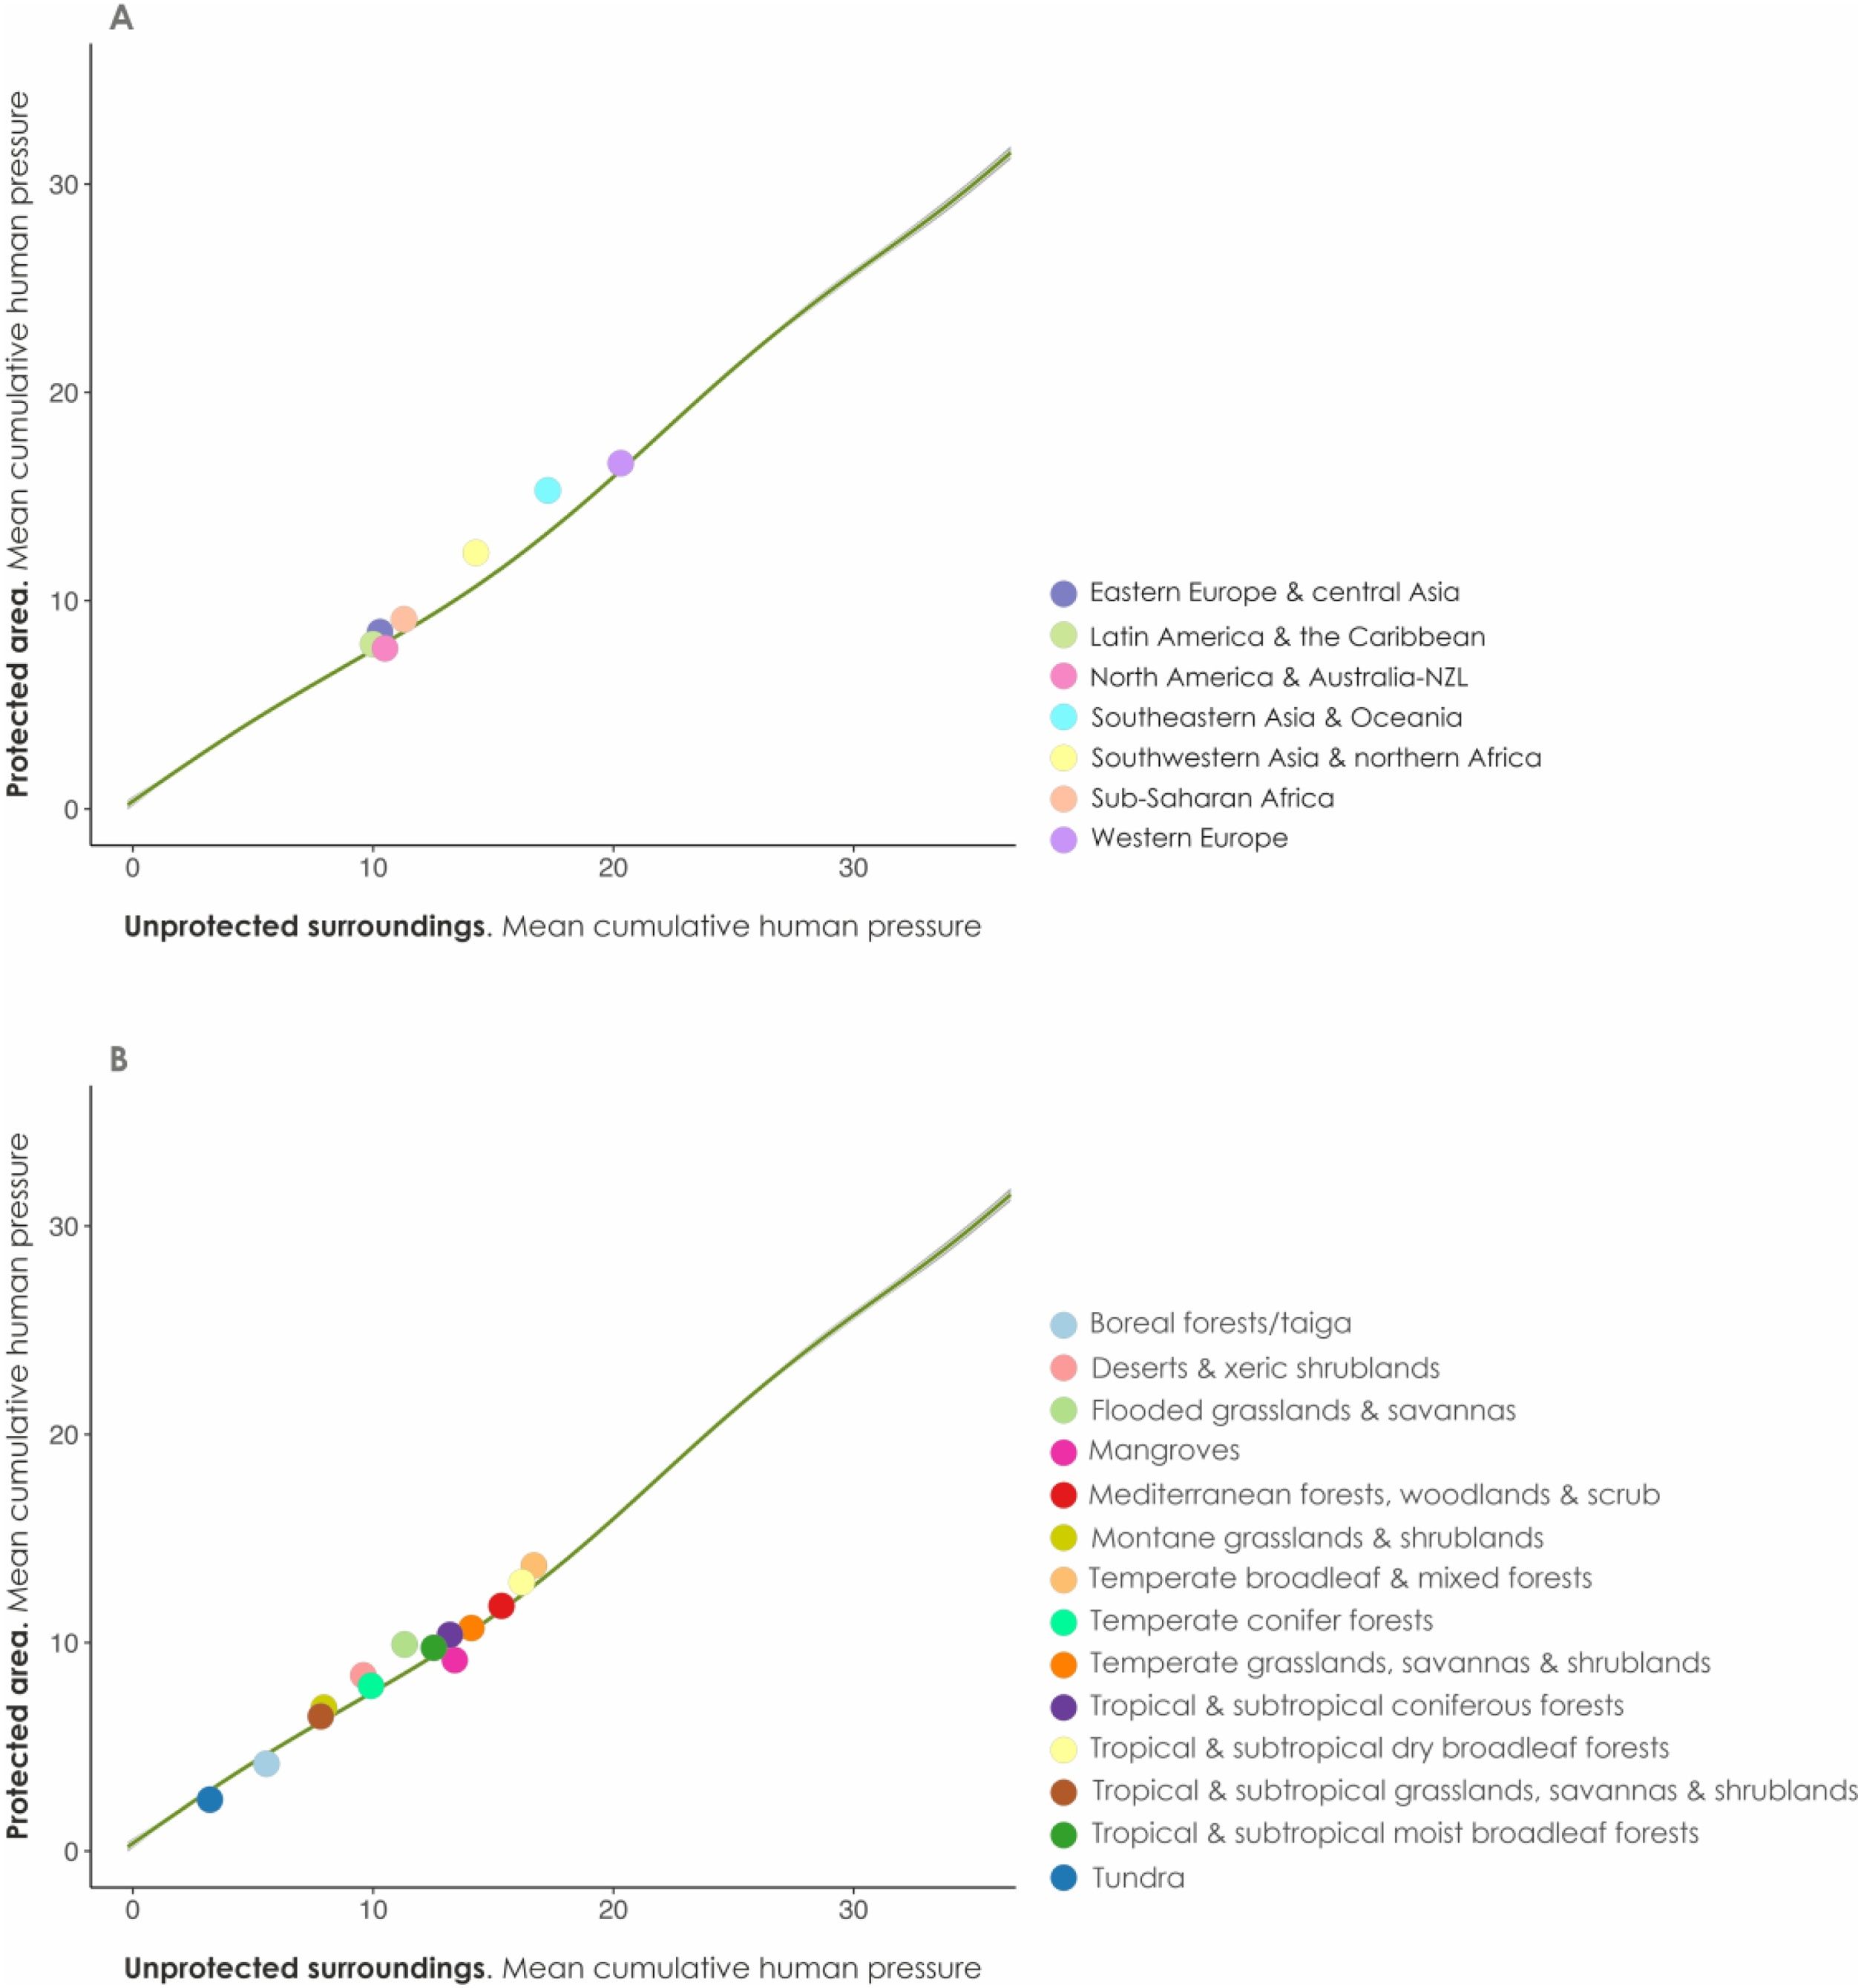
Internal-external human pressure relationships across regions and biomes. Relationship between mean cumulative human pressure inside PAs (y-axis) and in surrounding unprotected areas (10-km buffer; x-axis), shown by (A) global regions and (B) biomes. Each dot represents the centroid (mean value) of a given region or biome. The green LOESS curve illustrates the general trend across all units. Despite differences in overall pressure levels, regions and biomes consistently follow the same internal-external gradient, highlighting a globally pervasive structure of spatial continuity.
To test whether different management regimes influence internal-external relationships, we analyzed pressure levels across the gradient of IUCN designations. Remarkably, despite a moderately higher contrast between internal and external human pressures in Categories I–II (Fig. 3A and B), our results reveal that the external-internal human pressure relationship remains robust across all IUCN management categories, both globally and regionally (Supplementary Fig. S10). Interestingly, aside from a drop in Category Ia (r = 0.76), Categories Ib and II, despite being formally designated for strict nature conservation, show some of the highest internal-external pressure correlations (r = 0.84 and 0.85, respectively) (Supplementary Table S5). This consistency indicates that internal-external pressure patterns are not primarily determined by management regime but rather reflect broader structural and spatial factors that transcend formal, original, protection objectives.
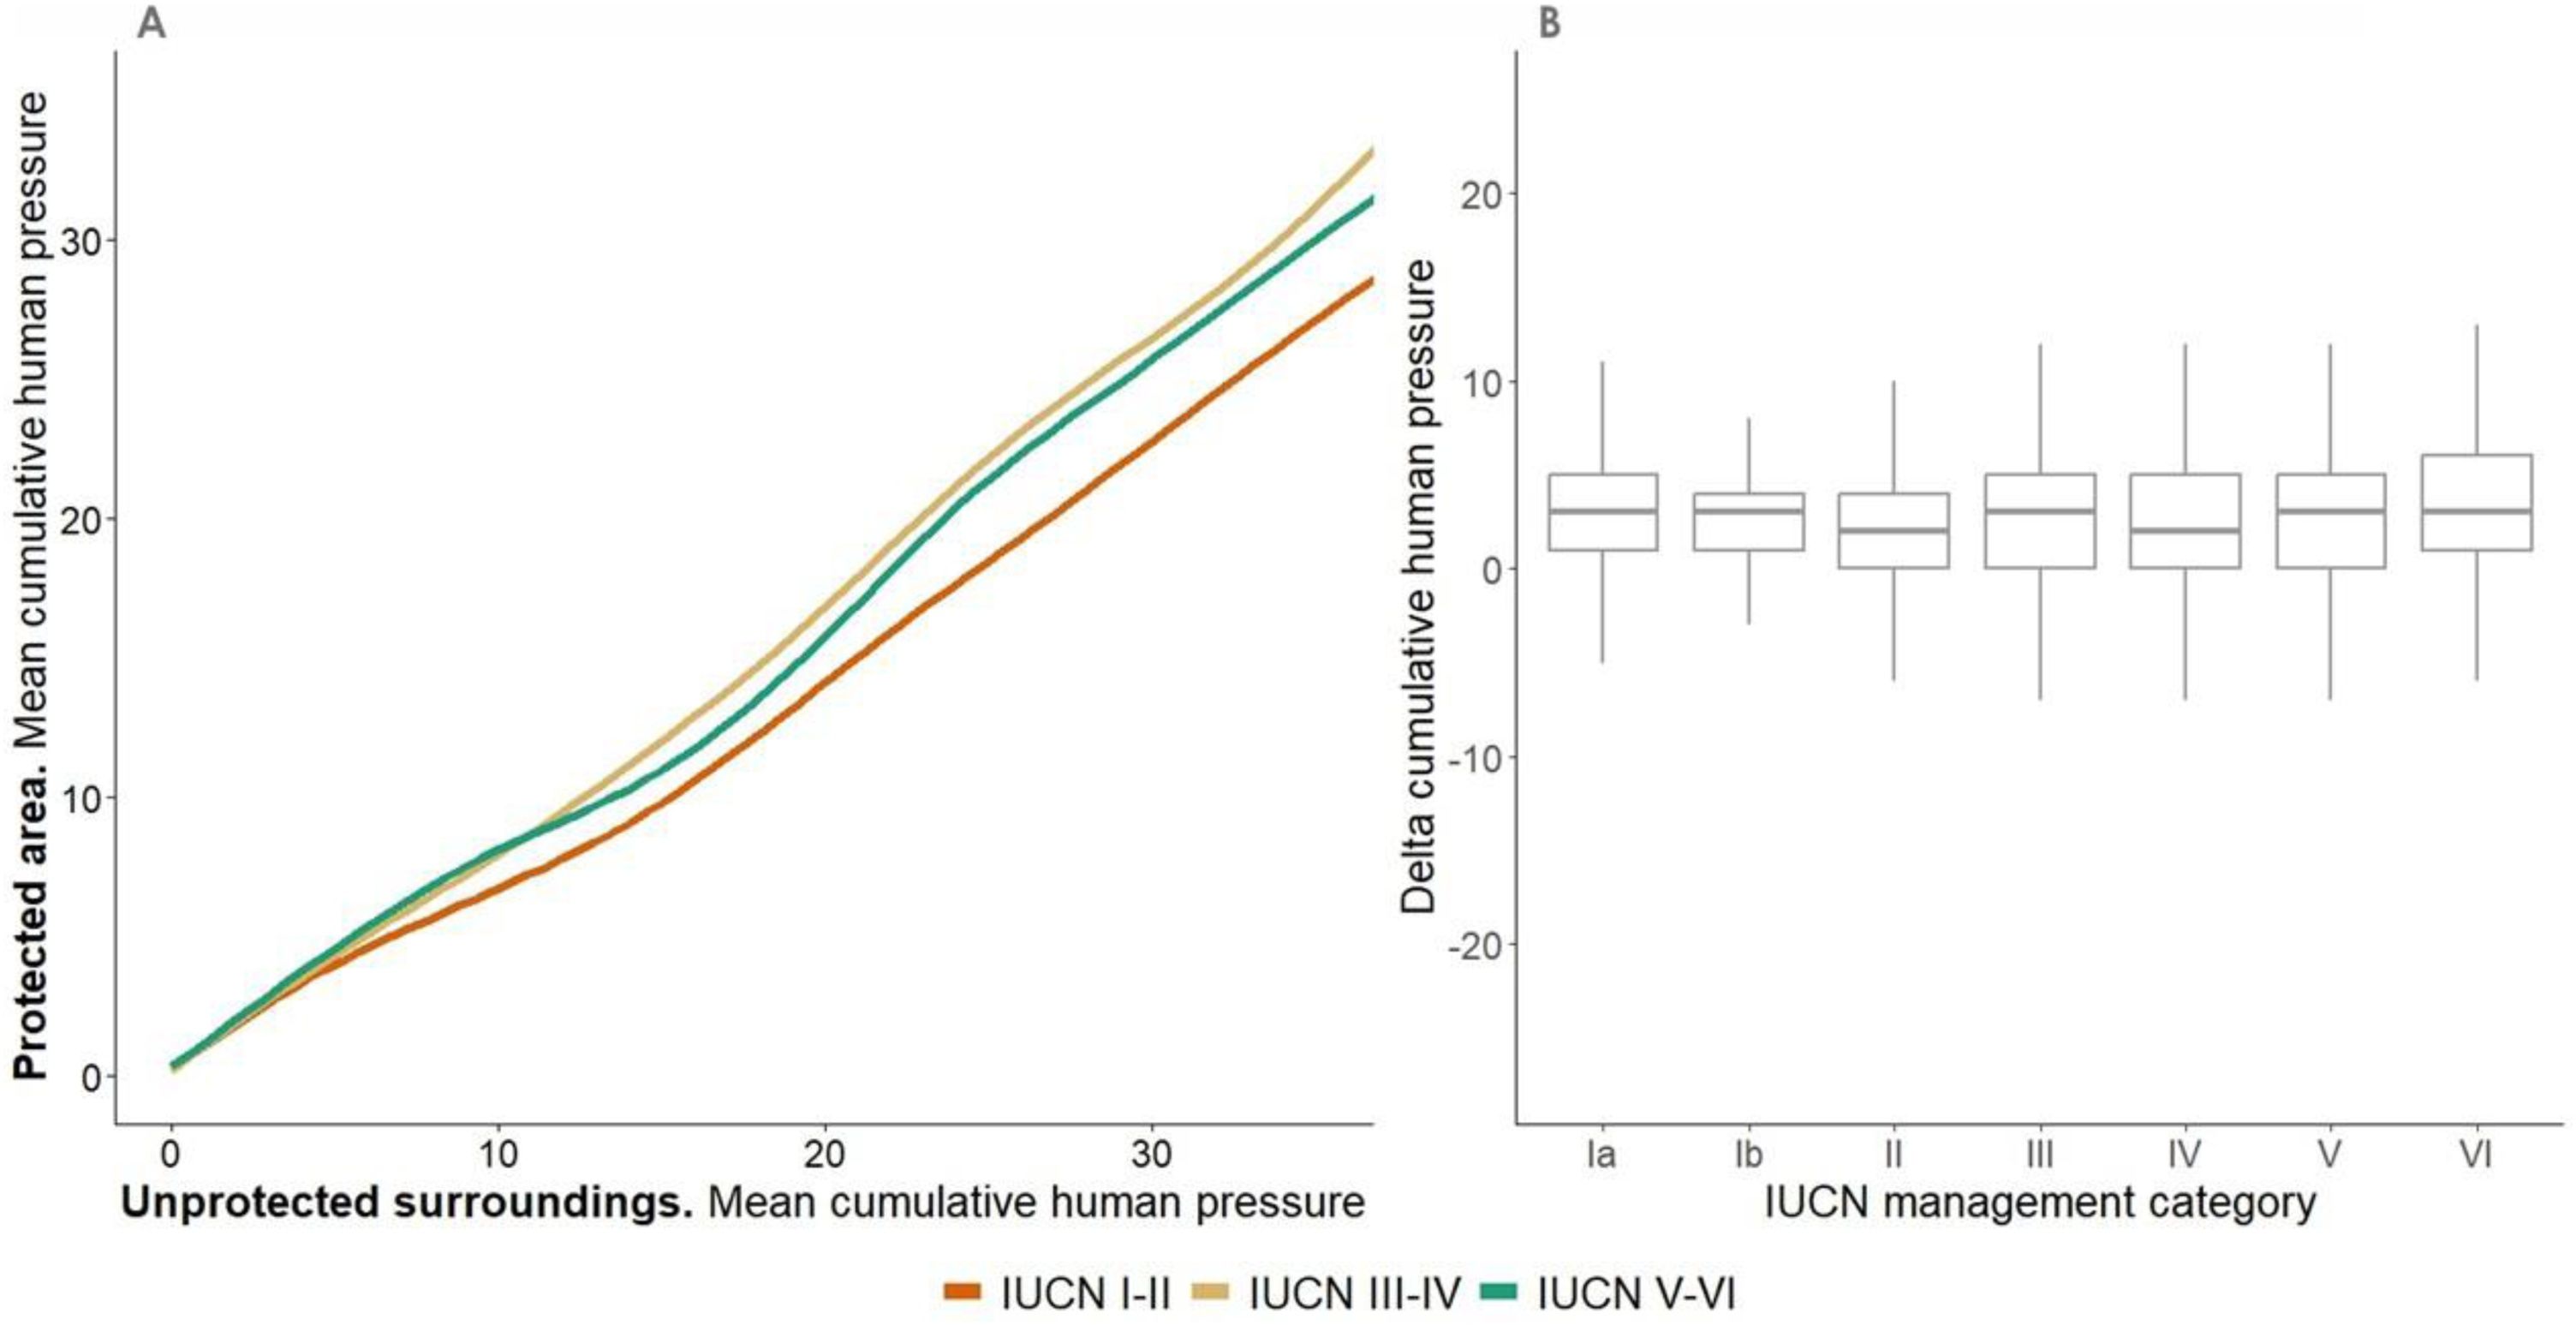
Internal-external human pressure relationships across IUCN management category. (A) Relationship between cumulative human pressure (mean value) inside PAs and in surrounding unprotected areas (10-km buffer), stratified by IUCN management category. Three LOESS models are shown: (i) IUCN Categories I-II (orange), (ii) IUCN Categories III-IV (brown), and (iii) IUCN Categories V-VI (green), representing decreasing levels of protection strictness. (B) Distribution of human pressure differentials between PA interiors and surrounding areas across IUCN categories. A human pressure differential value close to zero indicates minimal differentiation in human pressure. Positive values indicate higher pressure in unprotected surroundings than inside PAs, while negative values indicate greater pressure within PAs than in surrounding areas.
PA size did not emerge as a major determinant of the observed internal-external human pressure relationships. Across the continuous gradient of PA sizes, the contrast between internal and surrounding human pressure remained remarkably stable (Fig. 4A), a pattern further supported by the consistent linear relationships observed across discrete size classes (Fig. 4C). Our results also reveal that the lower internal pressure observed within larger PAs largely reflects their surrounding landscape context; once we account for adjacent unprotected areas, larger units exhibit lower internal pressures primarily because they are disproportionately located within low-pressure regions (Fig. 4A). This trend holds across most regions and biomes, with larger PAs differentiating more strongly from their surroundings only under conditions of very high external pressure where the Human Footprint exceeds 10 (Supplementary Figs. S11, S12).
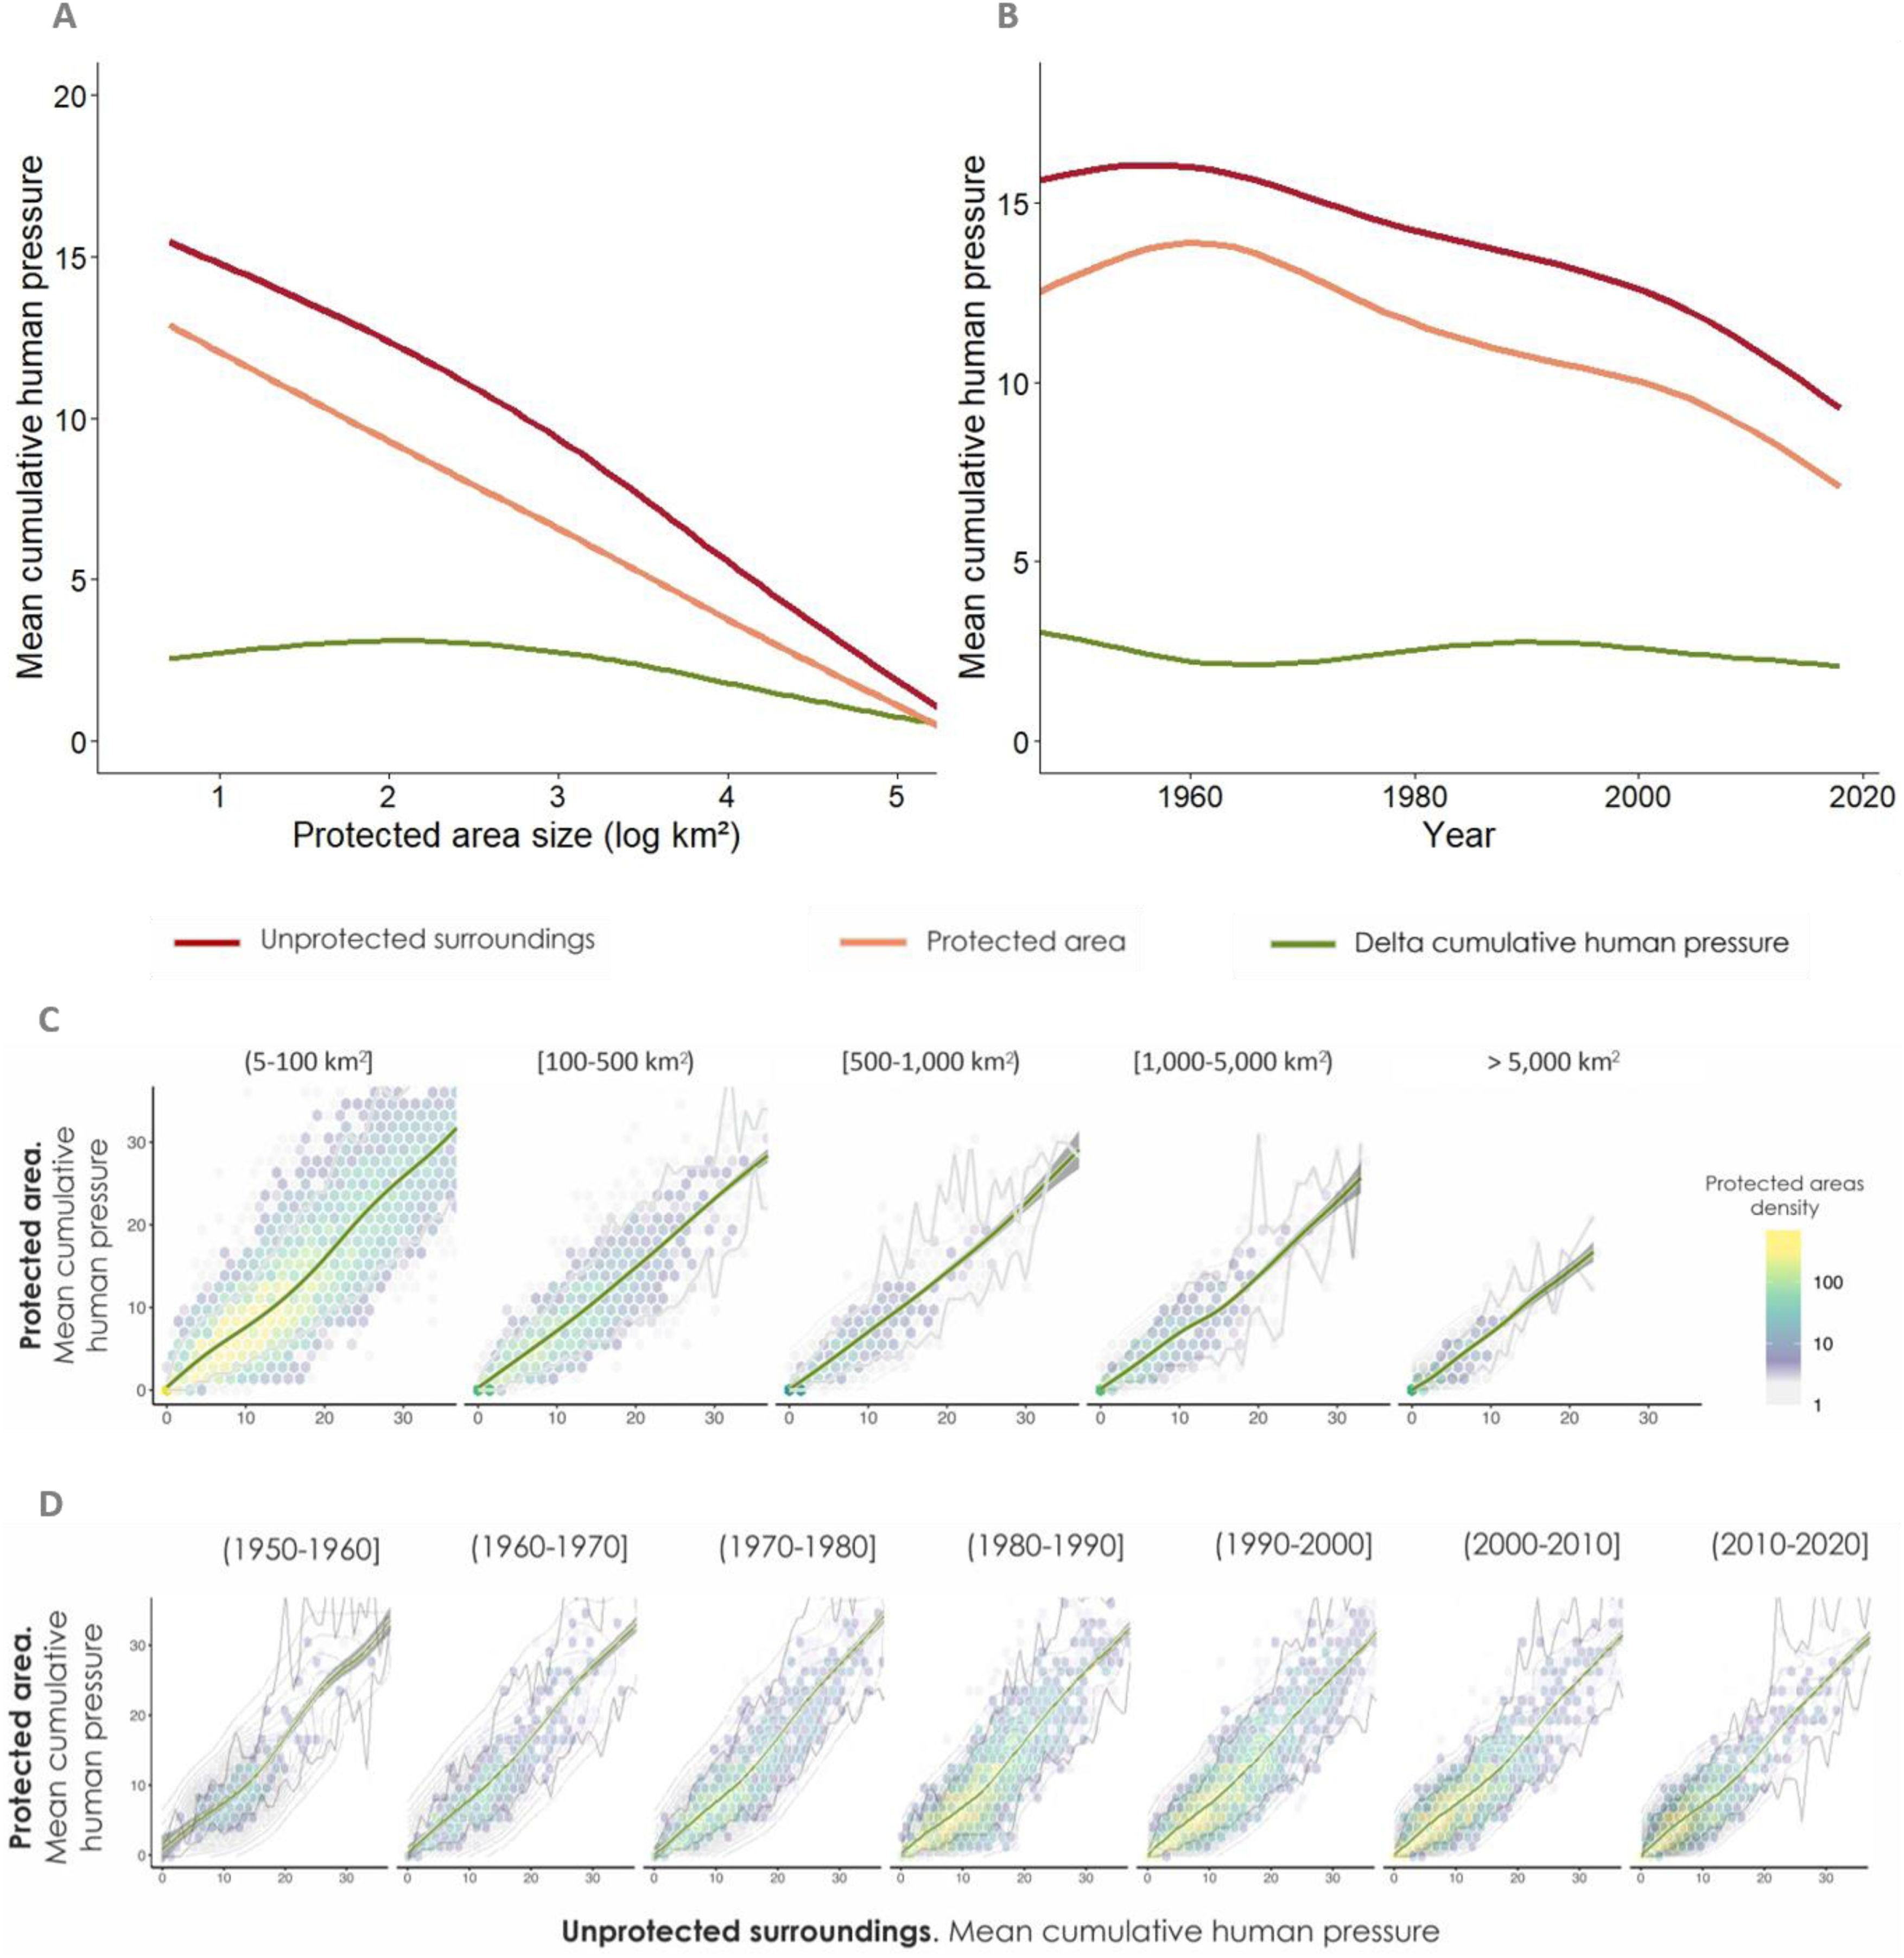
Internal-external human pressure relationships across protected area size and age. (A, B) Cumulative human pressure (mean values) along gradients of PA size (A) and age (B). Trends are modelled using LOESS smoothing for surrounding unprotected areas (10-km buffer; red), PA interiors (orange), and the difference between surrounding and internal human pressure (green). (C, D) Relationship between external (x-axis) and internal (y-axis) human pressure, partitioned by PA size categories (C) and age classes (D). Hexagonal binning illustrates PA frequency density, with brighter cells representing higher concentrations. Green lines depict the overall LOESS fit for each category. Analyses in B and D include PAs established from 1950 onwards, representing 95% of the total dataset.
Given the expectation that older protected areas might exhibit greater differentiation from their surroundings, we assessed whether PA age is associated with stronger contrasts in human pressure. Contrary to this expectation, the difference in cumulative human pressure between PAs and surrounding areas remains consistently low across the entire age spectrum, a pattern supported across both continuous and discrete PA age classes (Fig. 4B and D). These cross-sectional findings indicate that longer-established PAs do not systematically diverge from their surroundings in terms of human pressure. Interestingly, older PAs tend to exhibit slightly higher absolute internal pressures (∼4 units on the Human Footprint scale), primarily driven by long-established PAs in Western Europe, North America, and Australia/New Zealand, with additional contributions from parts of Southeast Asia and Oceania (Supplementary Fig. S13).
DiscussionAs human pressures on terrestrial ecosystems intensify, driving biodiversity loss, the degradation of ecosystem functions, and broader threats to global stability, PAs are widely regarded as the cornerstone for the long-term conservation of nature. The primary advance of our global analysis is, thus, to raise a critical question regarding the overarching architecture of global conservation: after more than 150 years of establishing protected areas, why does this global network display such a weak contrast with the human-dominated world it is meant to protect nature from? While Human Footprint levels tend to be slightly lower within PAs compared to their surroundings, the overall structural pattern is pervasive, with profound implications for key conservation objectives, including habitat retention, pollution control, invasive species mitigation, and ecological connectivity (Buxton et al., 2017; Laurance et al., 2012; Veldhuis et al., 2019; Wittemyer et al., 2008). This pattern is widespread across regions, biomes, and countries. It is most pronounced in PAs located within transformed landscapes, and less so where surrounding matrices remain largely intact. Remarkably, this spatial continuity persists irrespective of IUCN category and size, suggesting that attributes traditionally assumed to enhance PA performance (i.e., strict management and larger extent) do not consistently relate to a substantial internal-external contrast. Despite a moderately higher differentiation, even the strictest PAs mirror the continuum of pressures that define surrounding landscapes. This vulnerability is underscored by the extreme scarcity of PAs that maintain low internal pressure amidst highly pressured landscapes, highlighting the difficulty of securing ecological integrity where protection is most needed and demonstrating that the global protected area network rarely functions as a system of insulated "islands of nature", but rather as diffuse interfaces with their surrounding landscapes. Finally, we find no evidence that older PAs exhibit greater inside-outside contrast, indicating that, at a global level, longer time since designation is not consistently associated with increased differentiation from surrounding human pressures.
Two non-mutually exclusive mechanisms likely underlie this pattern. First, legacy effects: PAs in low-pressure regions were often established in areas of marginal productivity, avoiding land-use conflict, whereas many PAs in high-pressure regions encompass previously transformed landscapes that have not recovered. Second, post-designation pressures: inadequate enforcement, infrastructure expansion, and land-use incursions gradually erode internal conditions, aligning them with external pressures. While the relative contributions of these mechanisms remain unresolved, the global pattern is clear: PAs rarely stand apart from their surroundings. Importantly, our results do not imply that PAs are universally ineffective in reducing increases in specific human pressures relative to counterfactual areas, and should not be interpreted as direct measures of management effectiveness. Although many PAs have failed to stem cumulative human pressures at a global level (Geldmann et al., 2019), studies using remotely sensed forest data have shown that, while forest loss occurs within PAs, it is on average lower inside than outside PAs (Eklund et al., 2016; Nolte et al., 2013; Pfaff et al., 2015; Schleicher et al., 2017). However, such counterfactual assessments, typically restricted to subsets of PAs, specific biomes, and relatively recent human pressures, address a different dimension of PA performance than the one addressed here (Chen et al., 2023). Our analysis, encompassing more than 149,000 PAs across all biomes and regions and spanning the full history of PA establishment, complements these approaches by showing that, whether shaped by legacy effects or post-designation pressures, the global PA system rarely provides the spatial segregation from human pressures that is often assumed, with important implications for conservation planning and the strategic placement of new PAs.
Methodological considerationsThis study provides the first global structural assessment of cumulative human pressure inside and outside PA boundaries, a framework validated through rigorous sensitivity analyses of boundary effects, buffer widths, and alternative datasets. By integrating multiple stressors, such as infrastructure, agricultural land, population density, and artificial light, into a standardized index, our analysis captures broader spatial structures rather than isolated temporal changes. While regional variations in dominant pressures (e.g., intensive agriculture in Western Europe versus expanding grazing lands in sub-Saharan Africa) underscore the need for tailored local strategies (Supplementary Fig. S14), the underlying spatial continuity remains a pervasive global phenomenon.
It is important to note that our study was designed as a global/regional system-level assessment. Its objective is to evaluate the global protected area network as a whole, rather than the individual management performance or site-specific conditions of particular reserves. Evaluating individual protected areas using a 1-km² spatial resolution global dataset (Human Footprint) carries significant methodological risks, such as boundary-pixel spatial mismatch or regional data calibration limits. Local-scale data and ground-truthing remain strictly necessary for site-specific management decisions, which transcend the scope and technical resolution of this global assessment. Nevertheless, even at the macro scale, certain inherent limitations of global databases used in this study (i.e., Human Footprint and the WDPA) warrant consideration. In the Human Footprint, the static weighting of stressors may influence absolute pressure estimates, and values for roads and navigable waterways incorporate distance-based decay functions, meaning that pressures from external features decline rapidly with distance into PAs. Sensitivity analyses excluding the first 2 km of grid cells along PA boundaries, and considering the full gradient of PA sizes, showed that differences between internal and surrounding human pressures remain consistent, confirming that decay effects have minimal influence on overall internal pressure estimates. Additionally, the ∼1 km² resolution may also obscure fine-scale pressures within PAs and global datasets omit some regionally important threats, such as hunting, invasive species, or pollution.
Furthermore, IUCN category assignments in the WDPA are based on official governmental reporting and may not always reflect day-to-day operational realities or zonal definitions on the ground, potentially leading to local misclassifications where unmanaged buffer zones or human infrastructure are included within strict protection boundaries. Additionally, our IUCN category and historical age sub-analyses strictly evaluated single-category units, excluding multi-category complexes. However, structural representativeness analyses confirmed that retained subsets preserve proportional governance representation and the core size distribution of the global baseline (Supplementary Table S1). While median sizes in categories II and VI are smaller in the analytical subset due to the exclusion of very large contiguous complexes, the overall size spectrum across management categories remains broadly representative. Moreover, because our category sub-analyses did not formally cross-tabulate size with IUCN categories, observed pressure differences across categories may be modulated not only by management mandate but also by the intrinsic spatial geometry of their units, as smaller designations (such as categories III and IV) inherently exhibit higher edge-to-area ratios and larger relative buffer proportions that may amplify exposure to surrounding human activities.
Our findings also contribute to debates on what it means for land to be “protected”. Many PAs include heavily modified landscapes, such as agricultural or urban areas, meeting legal definitions but not maintaining ecological functionality. These inclusions may inflate apparent progress toward global conservation targets. Strengthening both credibility and effectiveness will require moving beyond area-based metrics to incorporate indicators of ecological integrity. Future work should integrate higher-resolution data, ground-validated management attributes, and additional threat dimensions to refine structural assessments, while advancing research to better understand the geography, biophysical conditions, and management attributes of the high-contrast cases that successfully maintain low internal pressure within transformed landscapes.
Remnant nature in a changing worldBuilding on these insights, multiple strategies could enhance ecological outcomes in PAs: strengthening protection within boundaries, improving governance, and coordinating land-use planning in surrounding matrices (Pringle, 2017). Yet achieving these goals globally is challenging. The conservation network is deeply fragmented, often composed of small, irregular, and isolated units within transformed landscapes (Schauman et al., 2024), compounded by underfunding, limited institutional capacity, and political instability.
Although PAs embedded in relatively intact regions currently sustain lower pressures, mounting evidence indicates that threats are likely to intensify in coming decades (IPBES, 2019; Meijer et al., 2018; Wittemyer et al., 2008). In ecologically critical regions such as the Amazon Basin, the Congo Basin and Borneo, expanding infrastructure, mining, hydropower, forestry, and agriculture pose escalating risks (Yang et al., 2021). These pressures arise from intertwined demographic, political, and economic trends, including population growth, political instability, global commodity demand, and climate-driven extremes. Safeguarding these vulnerable regions before degradation becomes irreversible will depend on integrating landscape structure and contemporary socio-economic dynamics into a unified framework that protects nature not only within PA boundaries, but across the landscapes that sustain them.
As the global community strives to implement Target 3 of the Kunming-Montreal Global Biodiversity Framework, which commits to effectively conserving at least 30% of terrestrial and inland water areas by 2030, our findings highlight a fundamental structural constraint. Evaluating global conservation progress through an over-reliance on passive, percentage-of-area targets risks creating an illusion of progress if protected area networks globally and systematically fail to generate spatial contrast against human pressure gradients. It is important to note that site-level park managers generally lack the jurisdictional mandate, regulatory tools, or operational capacity to design the expansion of PA networks, control regional land-use dynamics, or regulate macro-level drivers of human pressure. Therefore, the strategic shift highlighted by our findings applies primarily to higher-level decision-makers, such as national policy-makers, regional land-use planners, international conventions, and funding agencies, who hold the governance levers required to integrate protected area design with matrix management across broader landscape scales.
Author contributionsAll authors contributed substantially to the conception or design of the study. S.A.S., E.G.J., and G.B. designed the study with contributions from J.P., A.V., and A.D. S.A.S. collected the data and performed the analyses. All authors discussed the results, provided critical input on drafts, and approved the final manuscript for publication.
Data and materials availabilityAll databases and datasets used in this study derive from published sources cited in the methods section. The cumulative human pressure data were obtained from the Human Footprint dataset developed by Mu et al. (2022). Biome limits were obtained from Ecoregions2017 (available for download from https://ecoregions.appspot.com/). Terrestrial PAs of the world were obtained from the March 2023 version of the UNEP WCMC World Database on Protected Areas (available for download from https://www.protectedplanet.net/en). Shorelines were obtained from the World Vector Shoreline (WVS; available for download from https://shoreline.noaa.gov). Country boundaries were obtained from the high-spatial resolution GADM 3.6 database (available for download from https://gadm.org/).
The authors declare no competing interests.
We thank A. Persia for her contribution in graphic design. A.V. and S.A.S. were supported by the Spanish Ministry of Science, Innovation and Universities grant PROFECIA (PID2023-152114OB-I00).
The following is Supplementary data to this article: