
Forest corridor has been considered the main strategy for maintaining gene flow between isolated populations, yet their effectivity is poorly tested. Assessing signatures of genetic variation loss, gene flow reduction and inbreeding may be helpful for conservation of the biodiversity that needs large continuous areas. Here we evaluated the genetic structure and diversity of the largest neotropical mammal, the lowland tapir (Tapirus terrestris), living in the largest Atlantic forest corridor in Brazil. We used fecal-derived DNA, genotyped nine polymorphic microsatellite loci of 75 tapirs, and quantified genetic differentiation, genetic diversity, and landscape resistance to gene flow. We found genetic differentiation between the inland and coastal populations, which may be explained by elevation. Expected heterozygosity ranged between 0.64 (inland population) and 0.78 (coastal population), and a small Ne was observed in both populations. We demonstrated that even large continuous rainforests are not totally permeable to the gene flow of large organisms. Our study also changes our perception about the pristine of continuous corridors and their role for long-term survival of large mammals, suggesting that tapir conservation efforts should be taken even for populations in the large protected areas.

Habitat loss and fragmentation are the most important signatures of the human devastating actions on the ecosystems (Haddad et al., 2015), resulting in global trends of species loss and population decline (Dirzo et al., 2014). Populations restricted to small and isolated remnants are more susceptible to the negative genetic consequences, because isolation reduces gene flow and enhance genetic drift effects, resulting in loss of genetic diversity, inbreeding depression, and increases the risk of species extinction (Frankham et al., 2014; Hoffmann et al., 2017).
Since large mammals require large areas to survive (Crooks et al., 2017), they are the most threatened vertebrates affected by habitat loss and fragmentation (Lino et al., 2019). Several studies have detected a low genetic diversity (Haag et al., 2010; Lino et al., 2019) and population structuring in fragmented populations in large mammals (Haag et al., 2010; Dutta et al., 2013; Wultsch et al., 2016; Saranholi et al., 2017; Kozakiewicz et al., 2019; Lino et al., 2019). Therefore, protecting large continuous forests and the maintenance of ecological corridors have been considered the main conservation initiatives for sustaining the populations of large mammals (Mech and Hallett, 2001; Roever et al., 2013; Mateo-Sánchez et al., 2015). However, there is a lack of studies about the effectiveness of protected large remnants and ecological corridors in maintaining genetic diversity and gene flow (Resasco, 2019).
The Atlantic forest is one of the most threatened Neotropical biomes and is considered an important conservation hotspot due to its high endemism of plants and animals (Myers et al., 2000). Currently, Atlantic forest covers only about 12% of its original area and is mostly distributed in small fragments (∼79% of fragments is <50 ha) with few continuous remnants (Ribeiro et al., 2009). Although being protected, most of the Brazilian continuous remnants of Atlantic forest (located mainly in the coastal region) suffers from illegal palm harvesting, hunting, and human encroachment that affect animal movement and mortality (Galetti and Fernandez, 1998; Galetti et al., 2009, 2017), resulting in areas with high levels of defaunation, mainly for medium- and large-bodied mammals (Galetti et al., 2017; Bogoni et al., 2018).
The Serra do Mar Biodiversity Corridor (SMBC) in the Atlantic forest is the largest continuous forest patches and it is the stronghold of several large mammals, including jaguars (Paviolo et al., 2016), woolly spider monkeys (Talebi et al., 2019), white-lipped peccaries (Galetti et al., 2009) and lowland tapirs (Varela et al., 2019). A strong decline in density and biomass of large mammals due to illegal hunting and human infrastructure had already been documented in this corridor (Galetti et al., 2017). However, no studies have accessed contemporary genetic diversity and gene flow of large mammals in this region.
The lowland tapir (Tapirus terrestris), who historically were distributed throughout the entire Atlantic forest, is now rare in many regions, due to hunting, habitat loss, degradation, and fragmentation (Chiarello, 2000; Cullen et al., 2000; Sanches et al., 2011; Varela et al., 2019; Flesher and Medici, 2022). The species suffers from a gap of population genetic estimates in wildlife populations, with only one study conducted in Amazonia (Pinho et al., 2014). It is estimated that about 40% of the extant populations of lowland tapirs in the Atlantic forest inhabit the Serra do Mar mountain range in São Paulo and Paraná states, Brazil (Medici et al., 2012). Yet, we lack information if this large ecological corridor is effective in maintaining genetic diversity and connectivity for tapir populations. The answer for this absence of a report on the genetic population structure of lowland tapir is denoted by the National Plan of Ungulates Conservation (Instituto Chico Mendes de Conservação da Biodiversidade, 2019) as an important task to support lowland tapir conservation strategies and maintain its population viability.
Here we evaluated the genetic variation and gene flow among lowland tapirs inhabiting the Serra do Mar Biodiversity Corridor, a large corridor encompassing coastal and inland regions of the Brazilian Atlantic forest. Tapirs are a solitary ungulate known to make long-distance movements (Fragoso et al., 2003; O’Farrill et al., 2013) and, considering the forest continuity of this area, our hypothesis is that SMBC represents an efficient corridor allowing gene flow among the lowland tapir populations, favoring the long-term persistence of this animal in this biome. We expect to find a single large population within this largest Atlantic forest corridor. Alternatively, a pattern of isolation by distance (IBD) with genetic distance associated with geographical distance is also expected, due to the large SMBC extension. To test our hypothesis, we used a spatial genetic structure model to evaluate how genetic variability is distributed across the forest corridor and evaluate whether individuals show isolation by distance patterns. Spatial genetic structure models (i.e., sPCA and Geneland) explicitly account for spatial autocorrelation when assigning individuals to genetic clusters, and thus, are more realistic in describing genetic structure across the space. We also evaluated genetic diversity parameters of each genetic cluster to identify the genetic conservation status of tapir populations along the SMBC. In addition, we used landscape genetic approaches to identify the landscape features that facilitate or hide the gene flow of tapirs and evaluate whether the SMBC has been effective to maintain genetic connectivity and genetic diversity of tapirs.
Material and methodsStudy area and samplingWe sampled five sites along the Serra do Mar Biodiversity Corridor (SMBC) (Fig. 1), a protected area where hunting is prohibited, and human disturbance is low. This corridor comprises two major forested blocks, the Paranapiacaba (inland region) and Serra do Mar (coastal region) mountain ranges (Fig. 1), ranging from 0 to 1200 m above sea level (Table S1). We used non-invasive sampling (fecal samples) associated with molecular tools largely employed in mammal genetic studies (Beja-Pereira et al., 2009; Rodgers and Janečka, 2013; Saranholi et al., 2017) to obtain genetic data. A total of 125 fecal samples were collected (Table S2) by actively searching for lowland tapir latrines on pre-existing trails during 2007–2011. The distance between the sampling sites ranged from 45.0 km to 353.6 km, with a mean distance equal to 213.7 km ± 101.6 SD. Within each sampling site, the distance between the fecal samples ranged from 0.1 to 11.87 km, with a mean distance equal to 2.18 km ± 2.76 km SD. All collected samples were stored in polypropylene tubes containing 95% ethanol and kept in −20 °C freezer until DNA extraction.
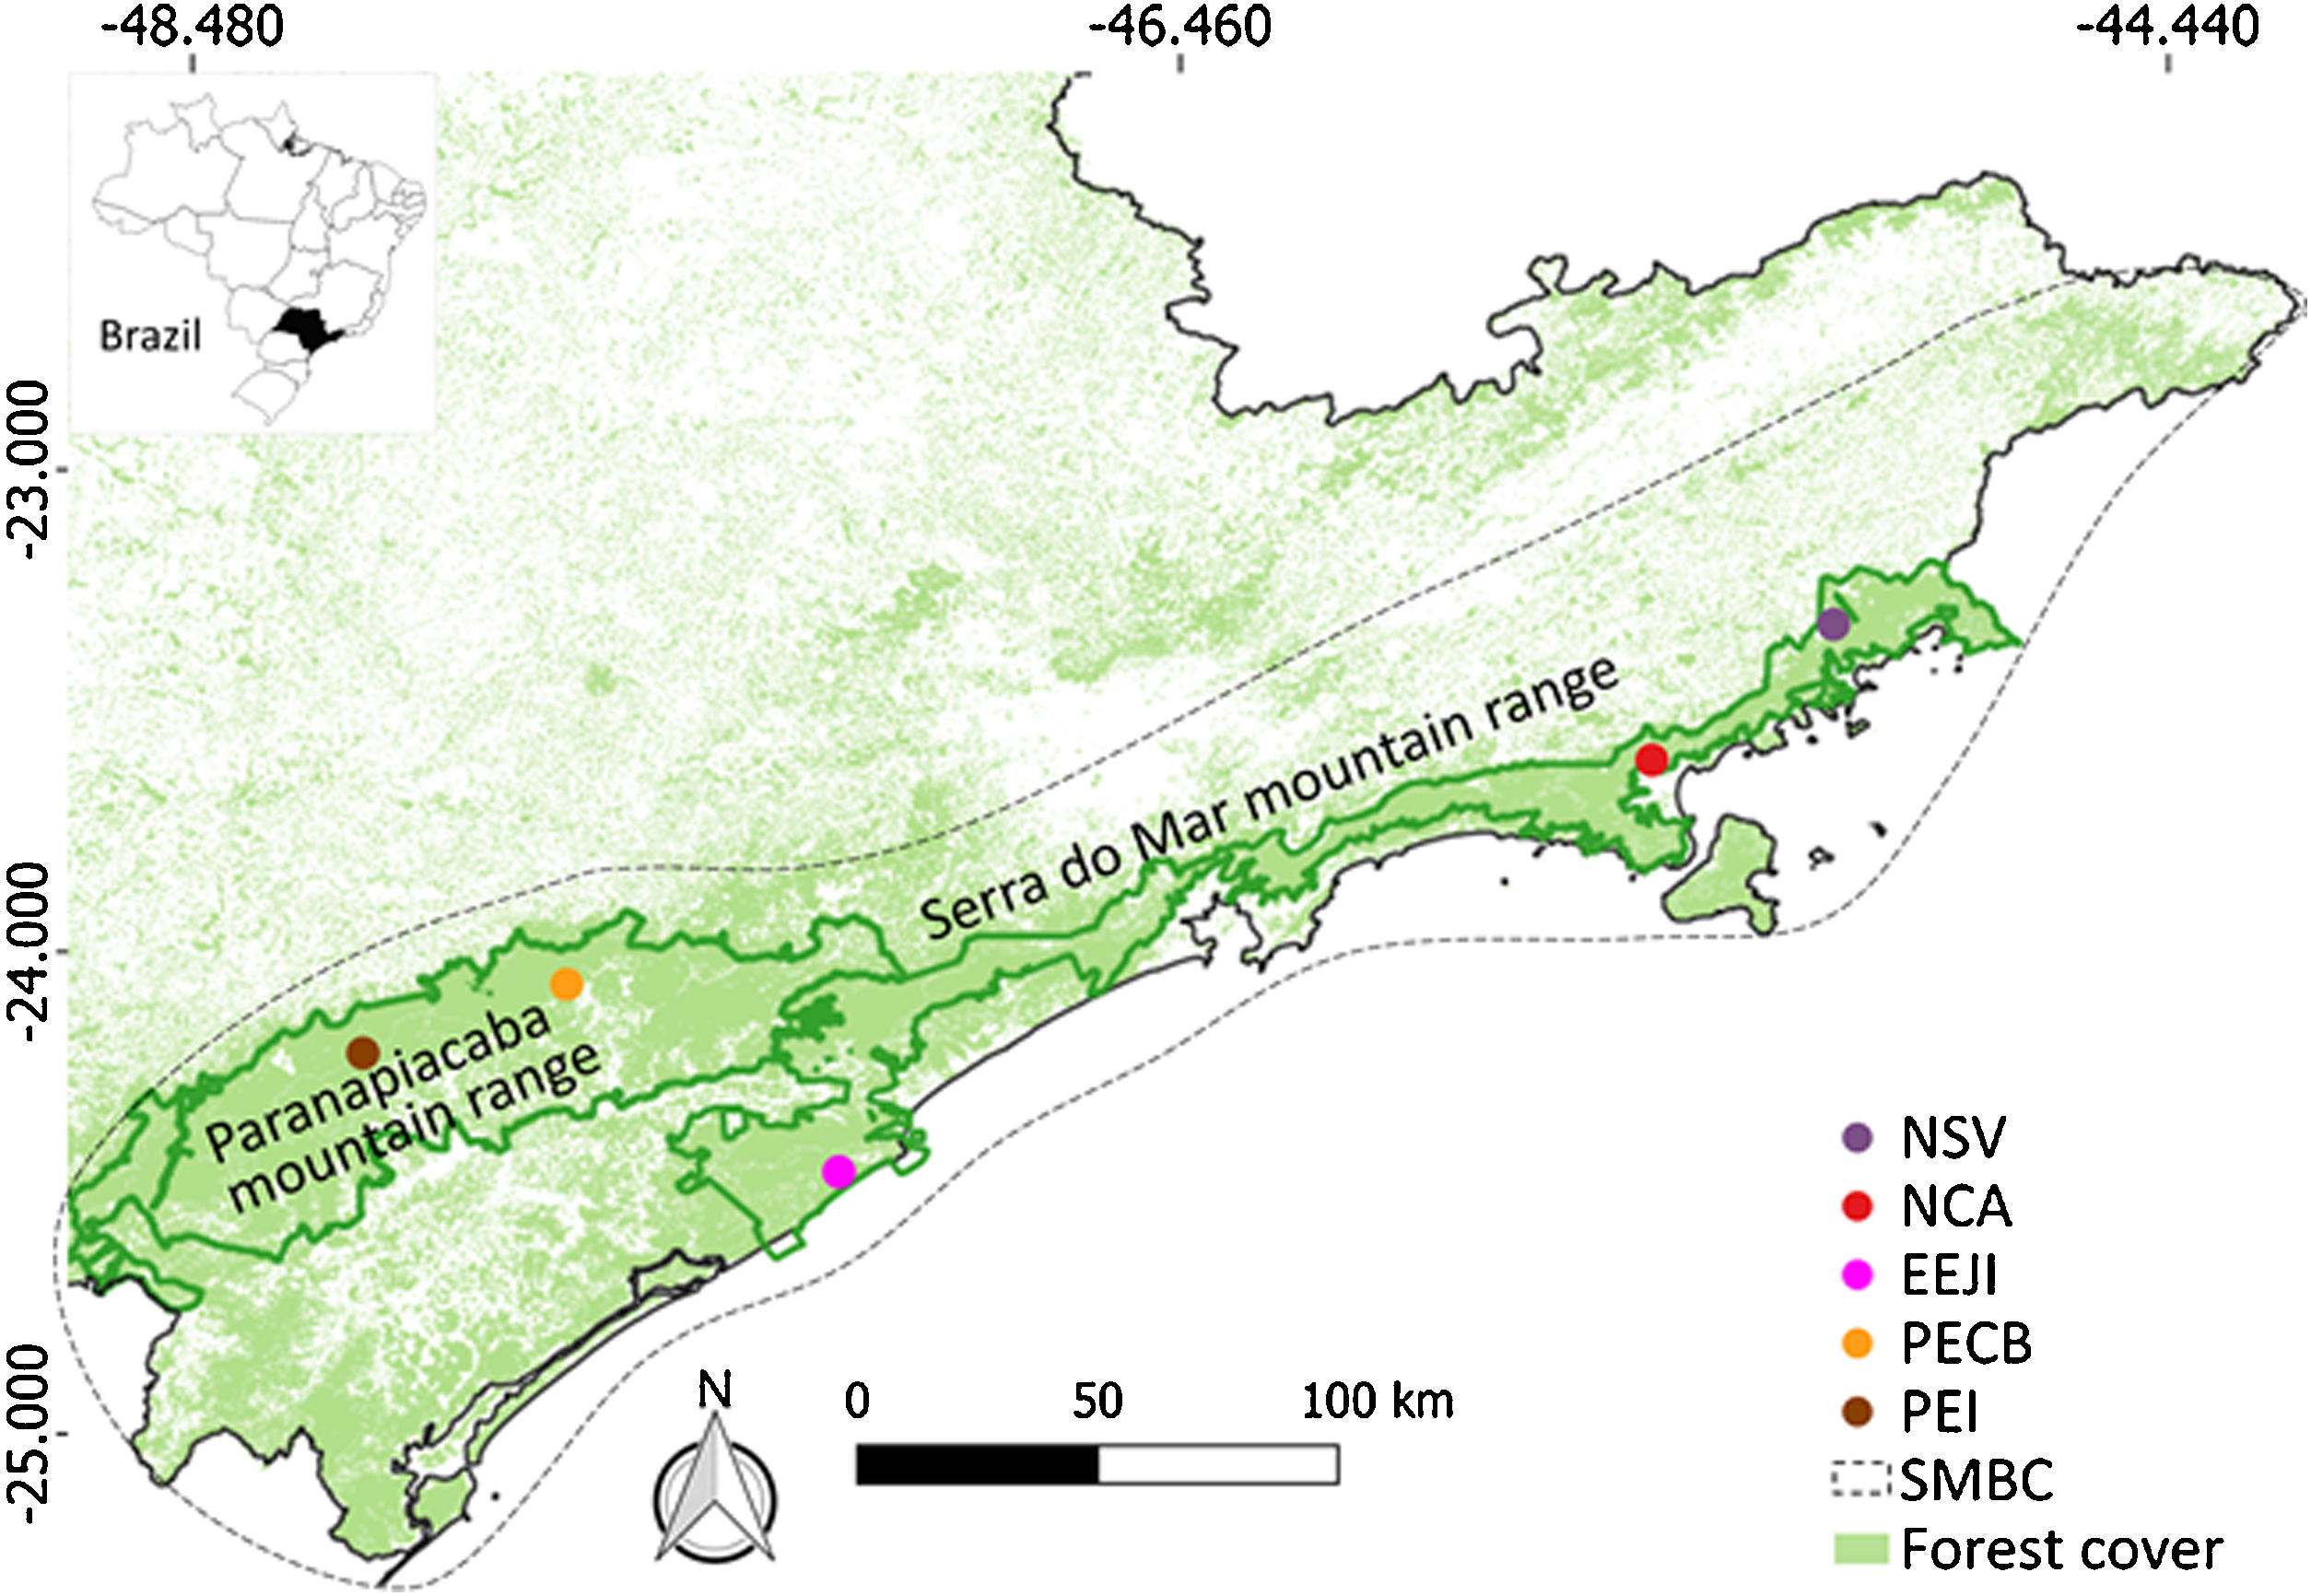
 in Atlantic forest, Brazil. NSV: Santa Virginia Nucleus (Serra do Mar State Park - PESM), NCA: Caraguatatuba Nucleus (Serra do Mar State Park - PESM), EEJI: Juréia-Itatins Ecological Station, PECB: Carlos Botelho State Park, PEI: Intervales State Park. PESM: Serra do Mar State Park. SMBC: Serra do Mar Biodiversity Corridor (Adapted from: “Conservation Internacional Brasil” and “Instituto Chico Mendes de Conservação da Biodiversidade”, 2018). PECB and PEI are located in the Paranapiacaba mountain range and NSV, NCA and EEJI in the Serra do Mar mountain range.")
Sampling sites of lowland tapirs (Tapirus terrestris) in Atlantic forest, Brazil. NSV: Santa Virginia Nucleus (Serra do Mar State Park - PESM), NCA: Caraguatatuba Nucleus (Serra do Mar State Park - PESM), EEJI: Juréia-Itatins Ecological Station, PECB: Carlos Botelho State Park, PEI: Intervales State Park. PESM: Serra do Mar State Park. SMBC: Serra do Mar Biodiversity Corridor (Adapted from: “Conservation Internacional Brasil” and “Instituto Chico Mendes de Conservação da Biodiversidade”, 2018). PECB and PEI are located in the Paranapiacaba mountain range and NSV, NCA and EEJI in the Serra do Mar mountain range.
DNA extraction from fecal samples was performed using the PSP® Spin Stool DNA Kit (Invitek), following the protocol proposed by the manufacturer. Nine microsatellite loci - Tter3, Tter4, Tter5, Tter9, Tter11, Tter13, Tter14, Tter18 (Sanches et al., 2009) and Tter10 obtained from the dataset of Sanches et al. (2009) and described here (Table S4), were used for individual genotyping. Details of the PCR and genotyping protocols are described in Supplementary File S1.
Genetic analysesFecal sample individualizationThe fecal samples were individualized based on the microsatellite genotypes. In the GIMLET software, the “Regrouping genotypes” option, which group several genotypes that match themselves, was used with zero mismatch ratio among loci (Valière, 2002). We verified the probability of two individuals sharing the same genotype at multiple loci calculating the probability of identity for related individuals (P(ID)sibs), which consider the chance of existing related individuals in the population (Waits et al., 2001), using the GenAlex v.6.5 software (Peakall and Smouse, 2012). This analysis showed that five loci were enough for individual identification (Table S3), presenting a low probability of identity (e.g., 0.01–0.0001; Waits et al., 2001), allowing that samples with up to four missing data were retained for the genetic analyses.
Population genetic structureGenetic population structure was investigated using combined methods, including approaches with spatial component, which are recommended to improve the estimates of population structure and are less affected by IBD (François and Durand, 2010; Perez et al., 2018). We used two spatial genetic structure approaches to evaluate the distribution of genetic variability across the space, Geneland (Guilot et al., 2005) and Spatial PCA – sPCA (Jombart, 2008). Both approaches are similar for including individual georeferenced multilocus genotypes to estimate the number of genetic clusters and genetic discontinuity. Geneland is a software that uses Bayesian model and Markov Chain Monte Carlo (MCMC) simulation to detect population structure, based on Hardy-Weinberg and loci linkage equilibrium (Guilot et al., 2005). The spatial model implemented in the Geneland provides more support to clustering analyses, even when crypt patterns of population structuring may occur (McManus et al., 2015), and can be especially helpful when the sampling is sparse (Ball et al., 2010). We used the Geneland R package (Guilot et al., 2005) and the admixture model method. For this analysis details, see Supplementary File S1.
On the other hand, sPCA is a multivariate approach free of the HWE assumptions, where the allele frequencies-based principal component score for each individual is multiplied by Moran’s I, a measure of spatial autocorrelation for that individual (Jombart, 2008). sPCA breaks the spatial autocorrelation into global and local structures, where neighbors are positively or negatively spatially autocorrelated, respectively. Global structure is expected in genetic cline or spatially distinct genetic groups whereas local structure happens when genetically similar individuals avoid mating with each other. Therefore, sPCA can be a sensitive approach for detecting population genetic structuring because it takes into consideration an unbiased estimate of geographical structure (Moran’s I) and it is free of the HWE assumptions. Details of the sPCA analysis are in Supplementary File S1.
We also verified the genetic structuring using the Structure 2.2 software (Pritchard et al., 2000), which does not incorporate spatial models. The analysis was done assuming the admixture and correlated allelic frequencies models without a priori information on the origin of the individuals. Detailed parameters of the Structure analysis are in Supplementary File S1.
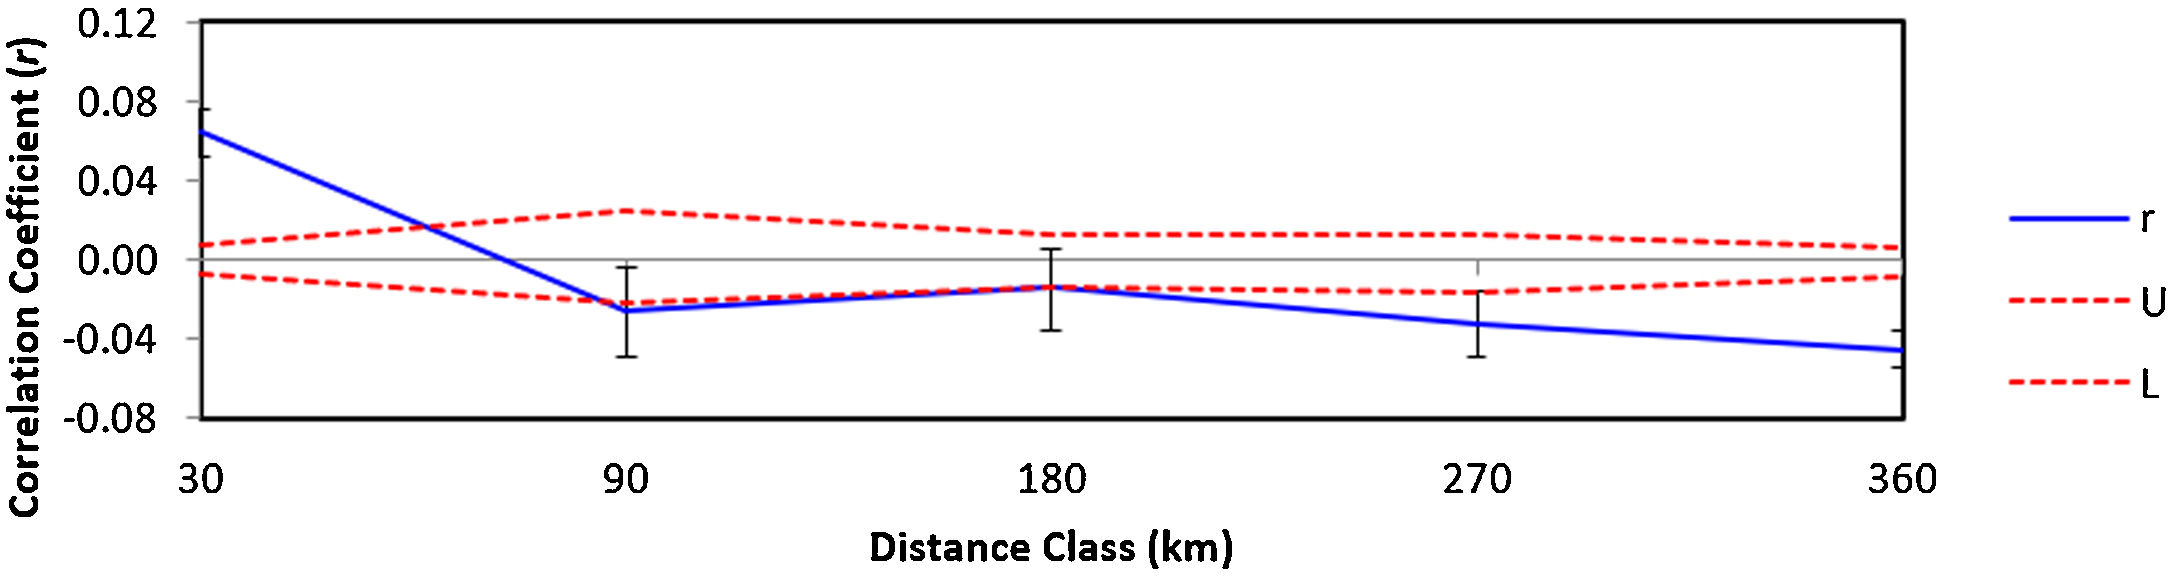
Additionally, the Wright fixation index (FST) (Wright, 1949), obtained in the GenAlEx 6.5 software (Peakall and Smouse, 2012), and Dest (Jost, 2008), obtained using the DEMEtics R package (Jueterbock et al., 2012), were evaluated between populations. Finally, we conducted an isolation by distance analysis. We opted to use a spatial autocorrelation analysis (SAA). SAA test whether the genotype of an individual is dependent on the genotype of an individual at a neighboring locality (Manel et al., 2003). This method is more adequate than methods based on individual distances (e.g., Mantel test) to our dataset. The isolation by distance-based Mantel test is prone to error type I (Guillot and Rousset, 2013; Meirmans, 2015) and commonly used when sampling sites are continuously distributed (Rousset, 2000). We used the SAA to verify the spatial extent of genetic structure by examining genetic similarity between pairs of individuals in several spatial distance classes, testing distance classes within (30 km) and among sample sites (90, 180, 270, and 360 km). The spatial autocorrelation coefficient (r) was evaluated at each distance class against the null hypothesis of no genetic structure (r = 0) via permutation (999 simulations) and bootstrapping (1000) using GenAlex v.6.5 (Peakall and Smouse, 2012).
Genetic diversityPolymorphic information content (PIC, Botstein et al., 1980) of each microsatellite locus was calculated using CERVUS (Kalinowski et al., 2007). The INEST v.2 software (Chybicki and Burczyk, 2009) was used to verify the presence of null alleles and estimate a corrected inbreeding coefficient FIS accounting for potential impacts of null alleles, using 1,000,000 MCMC interactions. We calculated the expected (He) and observed (Ho) heterozygosity, number of alleles (A), and the effective number of alleles (Ae) using GenAlEx v.6.5 (Peakall and Smouse, 2012). We also calculated allelic richness (Ar), which is the number of alleles corrected by sample size through rarefaction (Kalinowski, 2005), using the FSTAT v.2.9.3.2 software (Goudet, 1995). We performed a t-test to evaluate if there were significant genetic diversity differences between the two observed populations. Hardy – Weinberg equilibrium (HWE) was verified using Genepop v.4.0.10 (Rousset, 2008) and the p-values were corrected using Bonferroni correction (Rice, 1989). Additionally, we estimated the effective population size (Ne) for each population in the NeEstimator v2 software (Do et al., 2014) using the linkage disequilibrium (LD) model and the “Exclude singleton allele” option to avoid a bias of single-copy alleles presence in the Ne estimates.
Landscape geneticsWe used a landscape genetics approach to evaluate the landscape features that may explain the pattern of gene flow among the individuals of lowland tapir. We used the individual-based landscape genetic approach (Landguth et al., 2010; Balkenhol et al., 2015) to predict landscape resistance to gene flow, which is based on associating the genetic distance between individuals (see details in Supplementary File S1) with the cost-distance hypotheses, allowing to infer the different ways in which the landscape can modulate the gene flow (Cushman et al., 2006). The individual-based landscape genetic approach is when an individual-level genetic distance metric is used instead of population-level genetic distance metrics (Balkenhol et al., 2015) and has proved to be more powerful to detect early influence of current landscape features on gene flow compared to population-based approach (Landguth et al., 2010)”. For these analyses, we chose a map of land cover and elevation because they are considered the most important landscape features that affect mammal distribution (Norris et al., 2011; Cordeiro et al., 2016; Monteiro et al., 2019), and also because habitat suitability models show that these two variables are important to explain the variation in the probability of occurrence of tapirs (Jorge et al., 2013; Cordeiro et al., 2016). We used the ResistanceGA R package (Peterman, 2018) to optimize the land cover resistance surface, that is, the attributed resistance values for each land cover class (see details in Supplementary File S1). For the elevation resistance surface, we used the raw values of elevation, assuming a linear relationship among elevation and resistance values. We used the Circuitscape software (McRae et al., 2013) to estimate the resistance distance among tapir individuals for each one of the resistance surfaces. Finally, to model the genetic distance among individuals in relation to resistance distance for land cover, elevation, and geographic distance, we fitted univariate mixed-effects regression models using penalized least squares and a correlation structure designed to account for the non-independence of pairwise distances (maximum-likelihood population effects—MLPE: https://github.com/nspope/corMLPE; Clarke et al., 2002). Then we used model selection with Akaike Criteria approach to find which landscape features are most likely to explain the genetic distance in tapirs, using function model.sel of the MuMIn R package. Models with deltaAICc < 2 were considered equally plausible to explain variation in the genetic distance among individuals. That means that those models are the best ones to explain the observed pattern.
ResultsFecal sample genotyping and individualizationFrom the total fecal samples collected (125), 75 were retained for the analyses with at least five microsatellites successfully amplified. From these 75 samples analyzed, our genotyping analyses showed that each fecal sample belongs to a distinct individual (P(ID)sibs = 2.3−4), and no individuals were resampled twice (Table S2). Therefore, a total of 75 individuals was identified in the studied area (NSV — 24, NCA — 3, EEJI — 7, PECB — 39, PEI — 2).
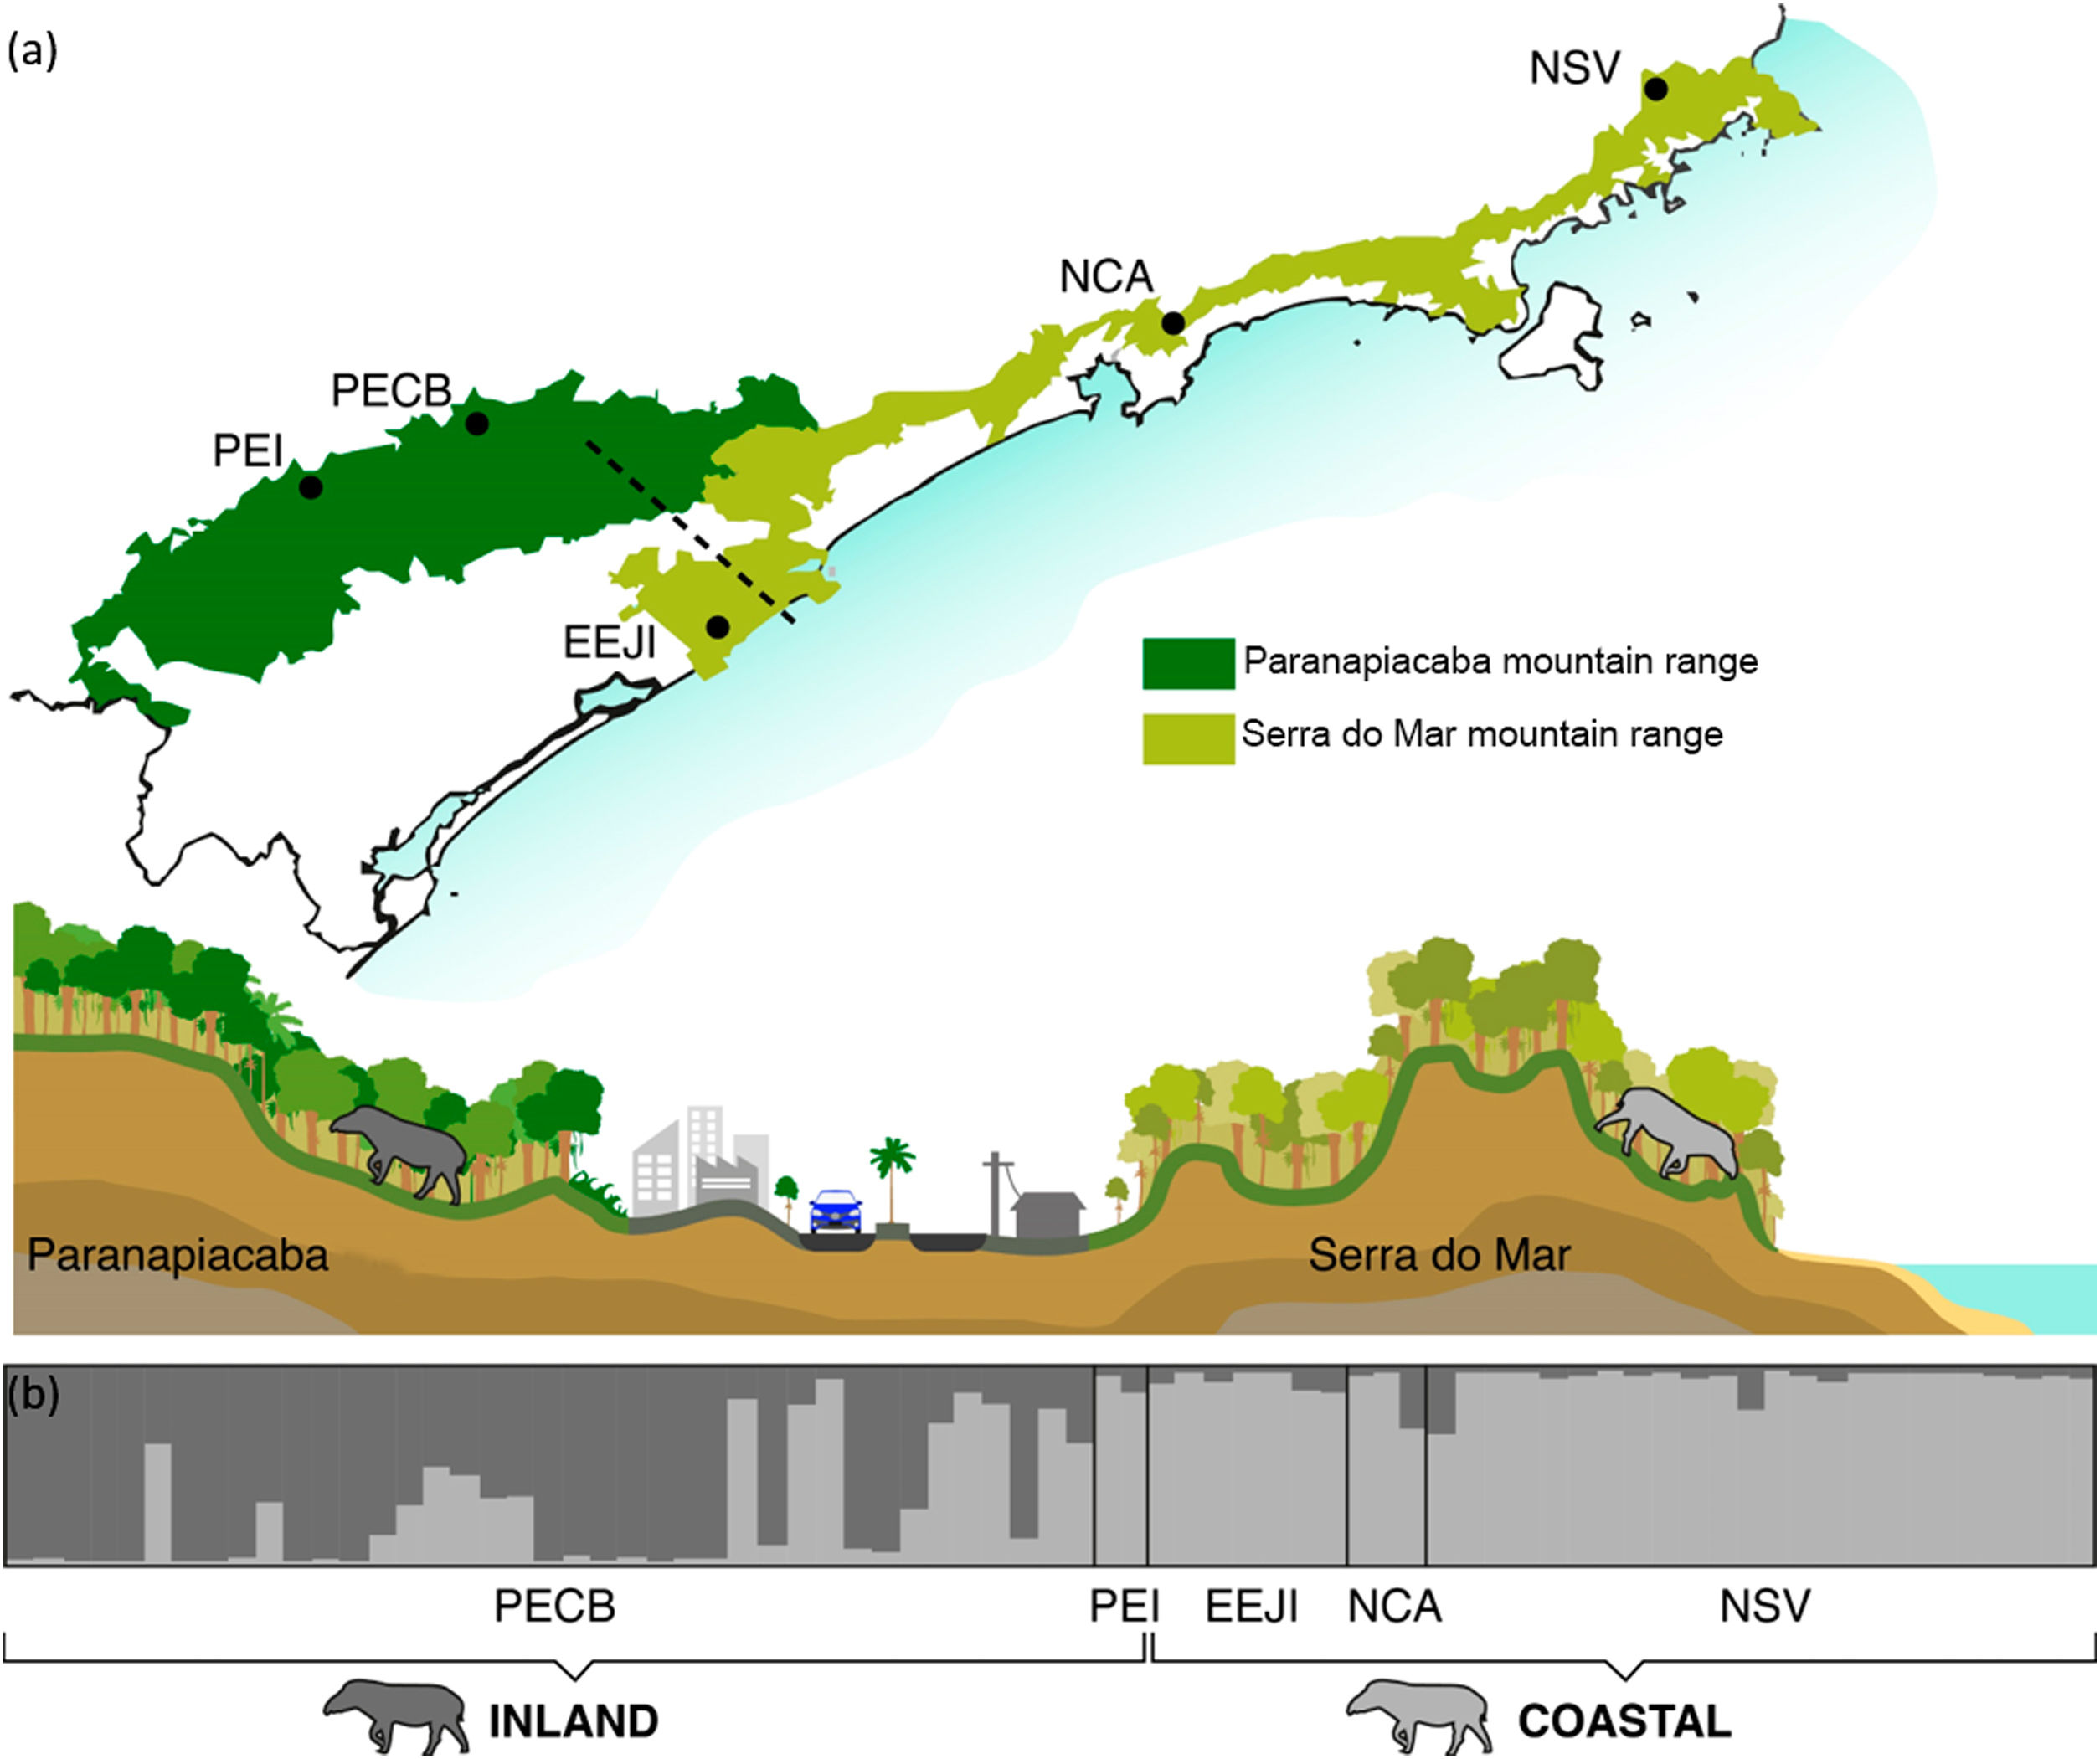
Population genetic structureAll genetic structure analyses (sPCA, Geneland, and Structure) indicate the existence of two main genetic clusters (populations) and reflect the two major forested blocks - the Paranapiacaba and Serra do Mar mountain range. One population was represented by individuals from the Serra do Mar mountain range (NSV + NCA + EEJI), while the second population includes individuals from the inland areas, Paranapiacaba mountain range (PECB + PEI) (Fig. 2, 3, S1). This genetic differentiation between these two populations was also confirmed by the FST (0.067; p = 0.001) and Dest (0.381; p = 0.001), reinforcing the spatial genetic structuring within tapirs in the AF corridor. The first sPCA axis separates Serra do Mar (NSV + NCA) from Paranapiacaba (PECB + PEI) individuals, and it is evidenced by different colors assigned by each group (Fig. S1). On the other hand, EEJI presented an intermediate color (Fig. S1), indicating that some individuals of this area showed similar probability to belong to both groups. Noteworthily, similar results were observed in Geneland (Fig. 3) and sPCA (Fig. S1) spatial analyses.
 in Atlantic forest, Brazil. (a) Map of the two major forest blocks (Paranapiacaba and Serra do Mar mountain ranges) and a drawing representing the altitudinal gradient from the region of dashed line; (b) Membership coefficient (Q) of each individual in the genetic clusters determined by Structure with K = 2. Santa Virginia Nucleus (NSV), Caraguatatuba Nucleus (NCA), Juréia-Itatins Ecological Station (EEJI), Carlos Botelho State Park (PECB), Intervales State Park (PEI).")
Bayesian genetic clustering analysis indicating the two genetic clusters found for lowland tapirs (Tapirus terrestris) in Atlantic forest, Brazil. (a) Map of the two major forest blocks (Paranapiacaba and Serra do Mar mountain ranges) and a drawing representing the altitudinal gradient from the region of dashed line; (b) Membership coefficient (Q) of each individual in the genetic clusters determined by Structure with K = 2. Santa Virginia Nucleus (NSV), Caraguatatuba Nucleus (NCA), Juréia-Itatins Ecological Station (EEJI), Carlos Botelho State Park (PECB), Intervales State Park (PEI).
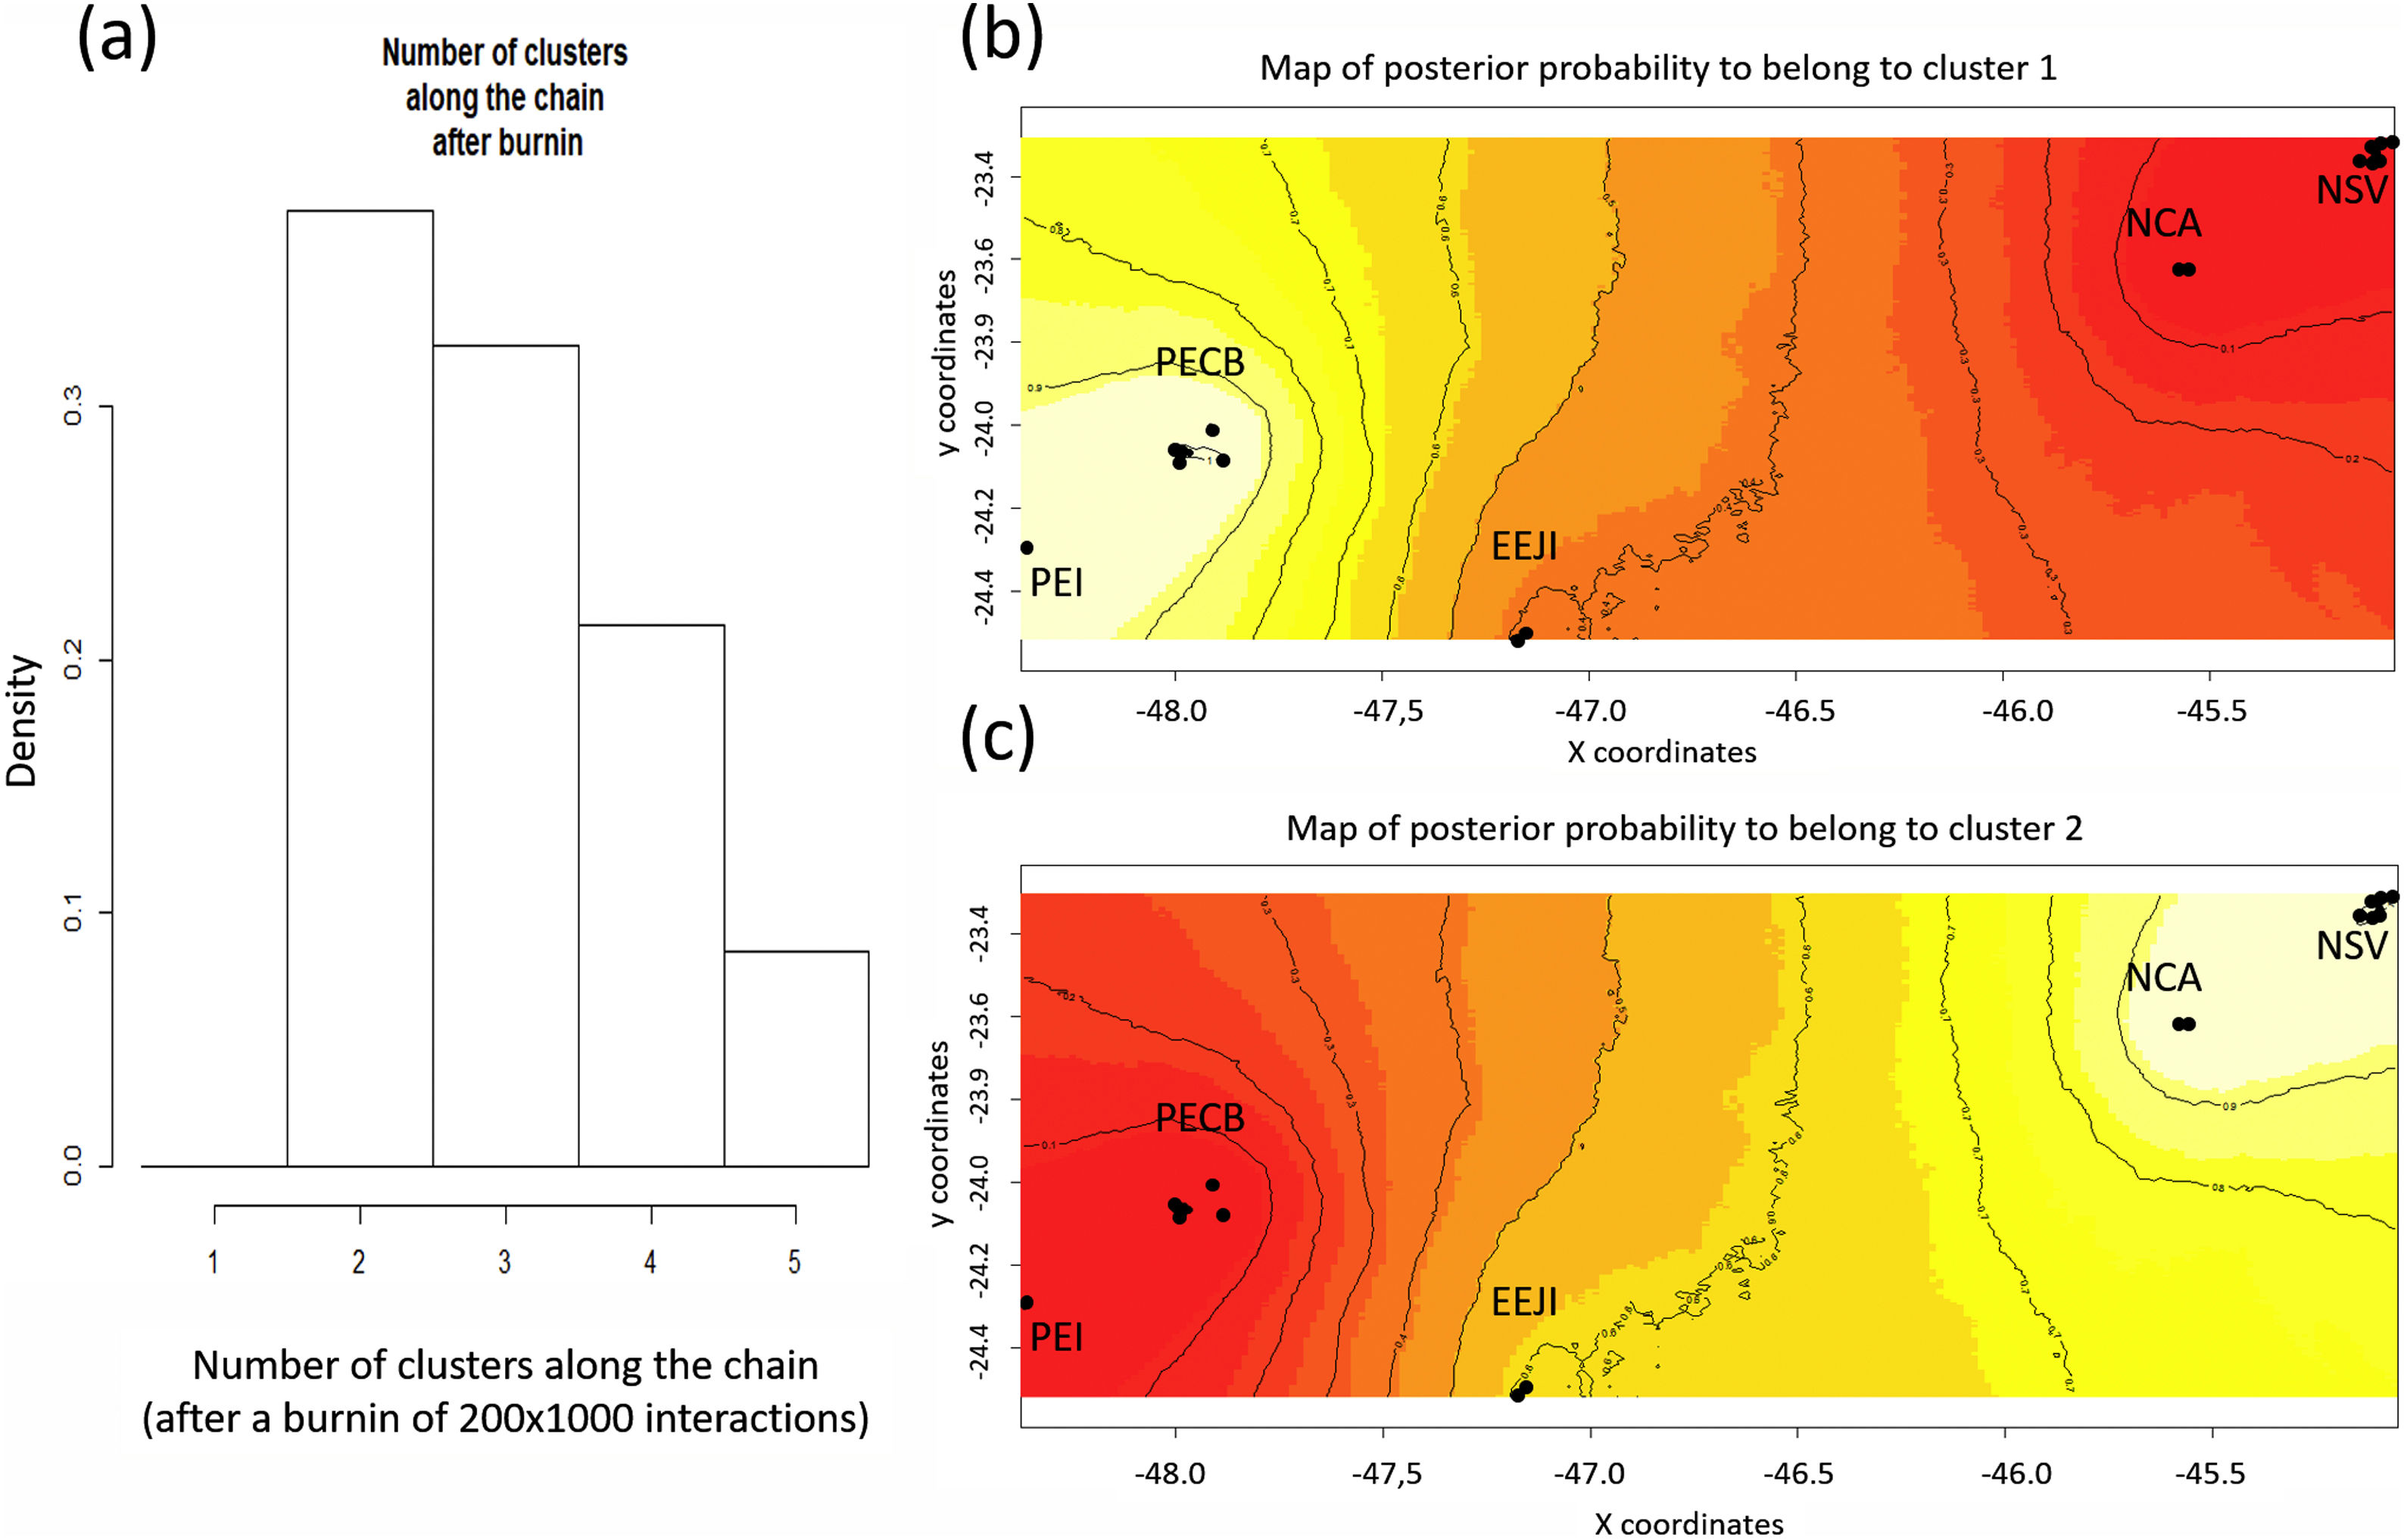
 in Atlantic forest, Brazil. (a) Number of clusters estimated in GENELAND, K = 2 presents the highest density. (b) and (c) Maps of the membership posterior probability to the two genetic clusters based on the Geneland analyses. Black dots represent individual samples. Contour lines indicate the spatial change in the assignment probability. Lighter colors indicate high probabilities of membership to a cluster, while yellow to red colors indicate low probabilities of membership to a cluster. NSV: Santa Virginia Nucleus, NCA: Caraguatatuba Nucleus, EEJI: Juréia-Itatins Ecological Station, PECB: Carlos Botelho State Park, PEI: Intervales State Park, PESM: Serra do Mar State Park.")
Spatial Bayesian genetic clustering analyses conducted in GENELAND for lowland tapirs (Tapirus terrestris) in Atlantic forest, Brazil. (a) Number of clusters estimated in GENELAND, K = 2 presents the highest density. (b) and (c) Maps of the membership posterior probability to the two genetic clusters based on the Geneland analyses. Black dots represent individual samples. Contour lines indicate the spatial change in the assignment probability. Lighter colors indicate high probabilities of membership to a cluster, while yellow to red colors indicate low probabilities of membership to a cluster. NSV: Santa Virginia Nucleus, NCA: Caraguatatuba Nucleus, EEJI: Juréia-Itatins Ecological Station, PECB: Carlos Botelho State Park, PEI: Intervales State Park, PESM: Serra do Mar State Park.
The autocorrelation spatial analysis indicates that the individuals within the first distance class (30 km; r = 0.064 and p = 0.001) are genetically more similar than individuals geographically more distant (Fig. 4).
 for lowland tapirs (Tapirus terrestris) in Atlantic forest, Brazil. Dashed lines represent upper (U) and lower (L) 95% confidence intervals (1000 bootstraps) for the null hypotheses of no genetic structure.")
Correlogram visualizing the autocorrelation coefficient r at different distance classes (km) for lowland tapirs (Tapirus terrestris) in Atlantic forest, Brazil. Dashed lines represent upper (U) and lower (L) 95% confidence intervals (1000 bootstraps) for the null hypotheses of no genetic structure.
The mean PIC value (PIC = 0.745) obtained, revealed that the microsatellites panel was highly informative for the genetic diversity analyses. The null allele frequency ranged from 0.09 to 0.33 (Table S5). All genetic diversity parameters differed between the Serra do Mar and Paranapiacaba populations (Table 1). We detected moderate genetic diversity (Na, Ar, Ae and He) in both populations, while the coastal (Serra do Mar) showed, in general, higher genetic diversity than the inland (Paranapiacaba) population (Ar: t = 2.14, p = 0.05; Ae: t = 2.32, p = 0.03; Ho: t = 0.71, p = 0.48; He: t = 2.76, p = 0.01) (Table 1). In addition, the coastal population presented a larger effective population size (Ne = 24.8, CI = 15.7–46.8) compared to the inland population (Ne = 7.6, CI = 4.9–11.1) (for more details of Ne results, see Table S6). A deficit of heterozygotes was detected in both populations (Coastal: FST = 0.091, p < 0.05; Inland: FST = 0.094, p < 0.05).
Genetic variability at nine microsatellite loci for lowland tapirs (Tapirus terrestris) for both genetic populations in the Serra do Mar Biodiversity Corridor, Atlantic forest, Brazil.
| Population | Locus | N | Na | Ar | Ae | Ho | He |
|---|---|---|---|---|---|---|---|
| Coastal | Tter3 | 26 | 6 | 5.27 | 3.05 | 0.62 | 0.67 |
| Tter 4 | 29 | 9 | 8.64 | 5.29 | 0.28 | 0.81 | |
| Tter 5 | 32 | 8 | 6.44 | 2.77 | 0.47 | 0.64 | |
| Tter 9 | 27 | 9 | 8.71 | 7.22 | 0.56 | 0.86 | |
| Tter 10 | 29 | 10 | 8.50 | 5.48 | 0.59 | 0.82 | |
| Tter 11 | 17 | 8 | 8.00 | 5.56 | 0.41 | 0.82 | |
| Tter13 | 24 | 9 | 8.31 | 5.43 | 0.50 | 0.82 | |
| Tter 14 | 18 | 8 | 8.00 | 6.23 | 0.28 | 0.84 | |
| Tter 18 | 27 | 8 | 7.11 | 4.38 | 0.37 | 0.77 | |
| Mean | 25.44 | 8.33 (±1.11) | 7.66 (±1.17) | 5.04 (±1.43) | 0.45 (±0.12) | 0.78 (±0.07) | |
| Inland | Tter3 | 33 | 4 | 3.54 | 2.08 | 0.49 | 0.52 |
| Tter 4 | 31 | 8 | 6.69 | 3.89 | 0.42 | 0.74 | |
| Tter 5 | 36 | 3 | 2.73 | 2.05 | 0.75 | 0.51 | |
| Tter 9 | 35 | 7 | 6.13 | 2.34 | 0.43 | 0.57 | |
| Tter 10 | 37 | 6 | 4.61 | 2.20 | 0.43 | 0.55 | |
| Tter 11 | 19 | 7 | 6.68 | 4.15 | 0.79 | 0.76 | |
| Tter13 | 34 | 7 | 6.26 | 3.85 | 0.32 | 0.74 | |
| Tter 14 | 21 | 11 | 10.67 | 7.23 | 0.62 | 0.86 | |
| Tter 18 | 35 | 6 | 5.13 | 2.00 | 0.29 | 0.50 | |
| Mean | 31.22 | 6.56 (±2.29) | 5.83 (±2.29) | 3.31 (±1.72) | 0.50 (±0.17) | 0.64 (±0.13) | |
N: individuals successfully genotyped in each locus; Ar: allelic richness; Na: number of alleles; Ae: effective alleles; Ho: observed heterozygosity; He: expected heterozygosity. The values in parentheses represent the standard deviation of each genetic diversity parameter.
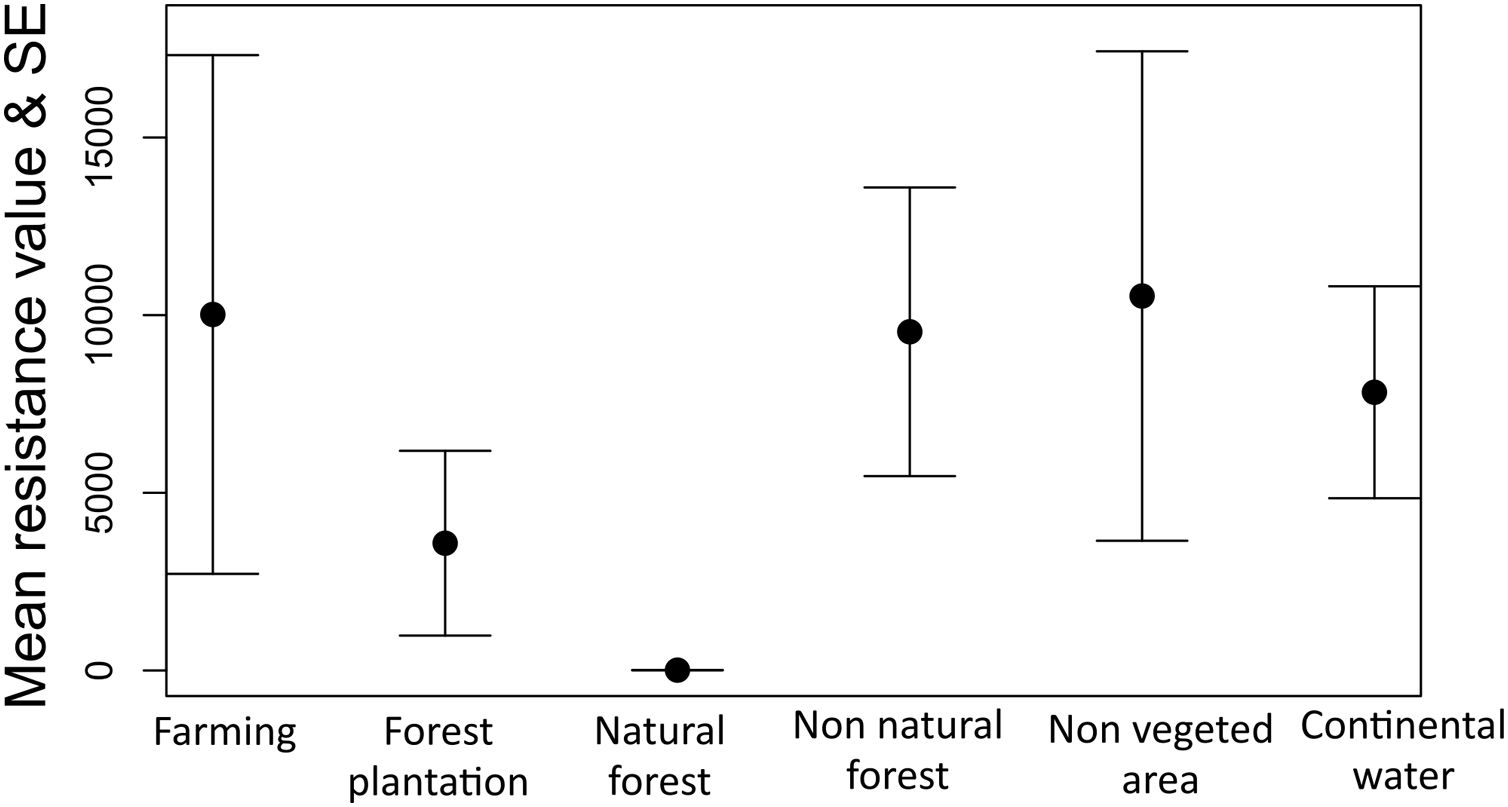
The optimization process showed that natural forest (forest and savanna formation) was the land cover feature that most facilitates gene flow among individuals of tapirs followed by forest plantation and farming (Fig. 5). Farming in our case includes pasture and annual, perennial, and semi-perennial crops. The most resistant land cover features were non-vegetated areas (urban infrastructure, mining, among others), farming, non-natural forest, and continental water.
 in Atlantic forest, Brazil, obtained using Resistance GA.")
Model selection approach showed elevation as the landscape features that most explain gene flow among individuals in tapirs, in which higher elevation limits gene flow. Geographic distance and land cover models showed delta AICc higher than two but were much better in explaining gene flow than a null model (model with absence of predictors) (Table 2).
Summary of the landscape genetic univariate models for lowland tapirs (Tapirus terrestris) in the Serra do Mar Biodiversity Corridor, Atlantic forest, Brazil. Response variable in all models is the genetic distance among individuals and the predictors are elevation, geographic distance, and land use resistance distance. The null model represents the absence of an effect; K, the number of estimated parameters; AICc, Akaike corrected for small samples and wAICc, Akaike’s weight of evidence. Parameter coefficient estimates for each predictor variable are shown followed by standard errors (SE), t-values and p-values.
| Model | K | AICc | ΔAICc | wAICc | Coefficient (SE) | t-value | p-value | Nagelkerke pseudo R² |
|---|---|---|---|---|---|---|---|---|
| Elevation | 4 | 8831.0 | 0.00 | 1 | 0.43 (0.02) | 17.53 | <0.001 | 0.103 |
| Geographic distance | 4 | 8857.2 | 26.22 | 0 | 0.38 (0.02) | 16.68 | <0.001 | 0.094 |
| Land use | 4 | 8907.0 | 75.97 | 0 | 0.64 (0.04) | 14.97 | <0.001 | 0.077 |
| Null model | 3 | 9120.6 | 289.59 | 0 | – | – | – | – |
Our study shows that large continuous corridor, such as the Serra do Mar Biodiversity Corridor, is not totally permeable for gene flow of a large vagrant mammal. Although lowland tapirs are capable to travel long distances and cross roads, open areas, and agricultural fields (Fragoso et al., 2003; O’Farrill et al., 2013), our analyses indicate a clear genetic population structuring in tapirs along this corridor. Specifically, we found two genetic populations (inland and coastal), reflecting the two major forested blocks - the Paranapiacaba and Serra do Mar mountain ranges, that were corroborated by different genetic structure analyses and reinforced by FST and Dest. However, a significant spatial autocorrelation at the first distance class (30 Km), suggests that tapir individuals reproduce more among neighbors, as expected in an IBD pattern of genetic diversity distribution. It is suggested that gene flow in tapir is mostly IBD-regulated along the AF corridor. The structured (inland and coastal) populations detected here might be a new scenario, and might represent a break in the IBD typical clinal allele frequency pattern (Ruiz-Gonzalez et al., 2015), likely induced by gene flow barriers promoted by human-induced landscape modifications. A similar sharp break in an ancient clinal allele frequency distribution resulting in structured populations was already reported in African leopards (McManus et al., 2015) and desert bighorn sheeps (Epps et al., 2007). In both cases, this new pattern was related to human-induced landscape modifications, as it appears to occur in tapirs. Our results indicate that, although Serra do Mar Biodiversity Corridor should promote gene flow at some scales (e.g., within 30 Km), this corridor may not be fully effective over its entire extension. Genetic studies to verify the effectiveness of forest corridors in facilitating gene flow between populations are still rare (Resasco, 2019). While some studies have shown that corridors can facilitate gene flow between large mammal populations (Epps et al., 2007; Mateo-Sánchez et al., 2015; Marrotte et al., 2017), others have shown that landscape features (e.g., elevation), the species behavior (specialist or generalists) and the presence of anthropogenic barriers can influence the corridor effectiveness (Mech and Hallett, 2001; Epps et al., 2007; Dutta et al., 2013; Monteiro et al., 2019).
Here, we found that land cover was not included in the best model to explain gene flow, probably because much of the Serra do Mar Biodiversity Corridor is still composed of forested areas. This resulted in a high correlation between land cover resistance and geographic distance, although the optimization process has shown that natural forest seems to facilitate, whereas anthropogenic areas restrict the gene flow among tapir individuals. Moreover, this result can be a consequence of time-lags between the onset of disturbances and genetic responses that may mask the effects of recent landscape modification on gene flow (Anderson et al., 2010; Balkenhol et al., 2015). On the other hand, elevation is the most important landscape feature that influences the genetic distance among tapir individuals and, consequently, the effectiveness of the corridor in promoting gene flow. In fact, elevation appears to be an important mediator of functional connectivity in tropical landscapes, and responsible for the most significant effects on the gene flow among populations (Monteiro et al., 2019). This result also corroborates the findings that show higher tapir density at lower altitudes, flat terrain, areas with dense forests and far from human settlements (Brooks et al., 1997; Tobler, 2008; Tapia et al., 2011; Naranjo, 2018) and others that suggest that tapirs avoid high altitude areas (Cordeiro et al., 2016). Therefore, it seems that elevation is actually the main driver shaping the genetic population structure of lowland tapir in Serra do Mar Biodiversity Corridor, restricting gene flow between the inland and coastal areas (Fig. 2). However, the Serra do Mar Biodiversity Corridor is sliced by several major roads, and pipelines, and is continually suffers from urban encroachment (Fig. 2), illegal palm harvesting, and hunting (Galetti et al., 2017). These human-promoted landscape modifications can lead to long-term reduction of gene flow among lowland tapirs, with consequences on the amount of genetic diversity and effective population size.
Moderate genetic diversity was observed in both populations and the gene flow reduction observed between the coastal and inland populations can likely explain this result. The small Ne found in both populations could also be contributing to a moderate genetic diversity. It is important to notice that any potential effect of departures from HWE seems not to affect the Ne results since it is not a concern on Ne estimates using LD method (Waples and Do, 2008; Do et al., 2014). Higher genetic diversity was observed in lowland tapir living in the Amazon forest (Pinho et al., 2014), suggesting a slight genetic variation reduction in the lowland tapir populations inhabiting Serra do Mar Biodiversity Corridor. Although this corridor comprises many protected areas, hunting and roads are widespread in this area, causing large mammal density reduction (Benítez-López et al., 2010; Galetti et al., 2017). The genetic diversity and the effective population size were higher in the coastal than in the inland population, indicating that the coastal population has more individuals genetically contributing for the Ne, probably because Serra do Mar (coastal region) harbors the largest tapir population in the Atlantic forest biome (Medici et al., 2012). These results suggest that the coastal population can be considered a gene pool source and may be important for the long-term resilience of tapirs, since this population can be less negatively affected by genetic drift and inbreeding (Wang et al., 2016). Although a putative inbreeding may explain the deficit of heterozygotes detected in both populations, technical artifacts, such as allelic dropout, may also occur. Noteworthy, this is the first estimate of any genetic parameter for tapirs in Serra do Mar Biodiversity Corridor. In addition, this is the first study that makes an estimate of the minimum number of individuals (n = 75) that inhabiting in this corridor. However, these results must be carefully evaluated since a small number of samples were analyzed and no resampling was observed, indicating that more individuals are probably living in this region. Therefore, we recommend that further studies be carried out to increase the number of individuals sampled to obtain a reliable estimate of tapir population density.
In conclusion, our study adds an important information that changes our perception about the pristine of continuous corridors and their role in the long-term survival of large mammals. This is the first study that assessed the genetic diversity distribution of a large mammal in the Largest Atlantic Forest remain, although it is necessary to recognize some limitations due to the sampling effort. However, since having a sampling for the whole largest Atlantic forest corridor is not an easy task, our results are useful and suggest that the largest Atlantic forest corridor, which is considered the stronghold of several large-bodied mammal species, such as muriquis (Brachyteles arachnoides), jaguars (Panthera onca), white-lipped peccaries (Tayassu peccary), has “invisible” barriers that reduce gene flow along this corridor for large-bodied mammals. We also show that the elevation is the most important factor driving the reduction of gene flow among lowland tapir individuals. Thus, based on our results, we suggest that more efforts are necessary for lowland tapir conservation, including studies with larger sampling for fine-scale analyses to detect gene flow barriers, even for populations in large protected areas to ensure their long-term persistence. Similar considerations must be made for tapir populations inhabiting fragmented areas, where gene flow will be certainly more harmed. It has already been demonstrated that including genetics to make conservation decisions on endangered species is highly recommended (Garner et al., 2020). We suggest that our results should be considered in the National Plan of Ungulates Conservation (Instituto Chico Mendes de Conservação da Biodiversidade, 2019) and other strategic planners engaged for conservation of lowland tapir and large mammals. These actions will be in line with a recent claim to conserve genetic diversity within all species as a global goal for the post-2020 framework for biodiversity conservation under the Convention on Biological Diversity, CDB (Hoban et al., 2020). It is also suggested that in the SMBC specifically, the largest extant Atlantic forest corridor, policies for the conservation of the emblematic lowland tapir should include reinforcement (or perhaps restoration) of population connectivity, and reduction of illegal hunting pressure.
Author contributionsB.H.S., A.S., J.F.M.R., C.S.C., M.G. and P.M.G.Jr. conceived the research ideas; B.H.S., A.S., M.G., P.M.G.Jr. designed the study; B.H.S. and A.S. collected and analyzed the data and J.F.M.R and C.S.C., M.G. and P.M.G.Jr. assisted with data analysis and interpretation; and B.H.S., A.S., and P.M.G.Jr. led the writing with assistance from J.F.M.R., C.S.C., M.G.
Data accessibilityAdditional information is available in the electronic supplementary material. The microsatellite genotype file can be accessed in the Figshare digital repository at: https://doi.org/10.6084/m9.figshare.19292408.v1
Conflict of interestThe authors declare that the research was conducted in the absence of any conflict of interest.
This work was supported by Fundação de Amparo à Pesquisa do Estado de São Paulo (FAPESP, 2007/03392-6, 2013/19377-7). A.S. thanks M.G. lab’s students for the assistance in field collections. B.H.S. received scholarships FAPESP (2013/24453-4) and Natural Environment Research Council (NERC, NE/S011811/1). C.S.C. received scholarship FAPESP (2019/26436-6). A.S. had fellowship from FAPESP (2007/04073-1) and Conselho Nacional de Desenvolvimento Científico e Tecnológico (CNPq, 500565/2013-9). A.S thanks Idea Wild (SANCBRAZ0308) for research equipment donation. J.F.M.R. received fellowship from Ford Foundation IFP (2011-2013/15104940). P.M.G.Jr. and M.G. thank CNPq (303524/2019-7; 300970/2015-3, respectively). The authors thank the editor and anonymous reviewers for constructive contributions that improved the manuscript.
The following are Supplementary data to this article:

