
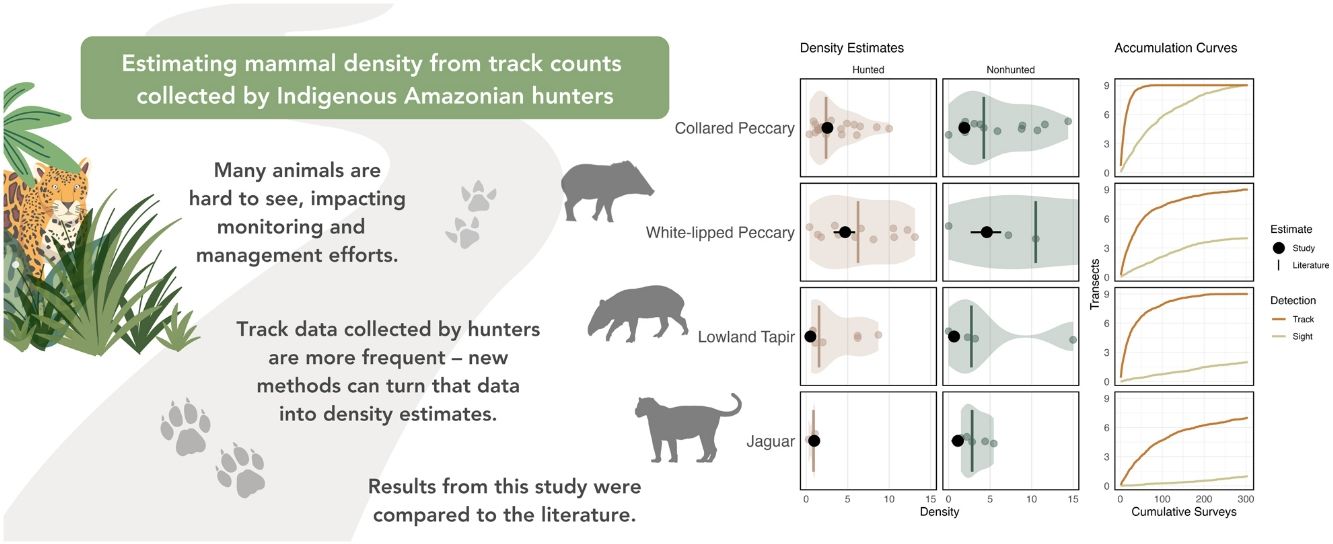
Monitoring programs must produce reliable estimates of animal population density to effectively guide management decisions and conservation action. Popular methods used to estimate density rely on visual encounters which are difficult to obtain for many large-bodied mammals in tropical forests. This study uses the Formozov-Malyshev-Pereleshin (FMP) method to produce density estimates for four terrestrial mammals based on track counts collected by Indigenous hunters in the Amazon. The focal species include collared peccary (Peccari tajacu), white-lipped peccary (Tayassu pecari), lowland tapir (Tapirus terrestris), and jaguar (Panthera onca). For each species, track detections were greater than visual detections and were found on more transects with a fewer number of surveys. Density estimates were produced for each focal species in hunted and nonhunted sites. These results were compared against the median of 84 density estimates located in the literature that differentiated between hunted and nonhunted sites in the Amazon. Results demonstrate that the FMP method is a reasonable and cost-efficient method. This method can directly engage Indigenous and other local peoples in research, as opposed to replacing their skills with technologies or professional biologists. Overall, this method complements traditional transect surveys and can improve our understanding and management of wildlife across the tropics.

Terrestrial mammals are the focus of many biodiversity monitoring programs in the Amazon (e.g., Blake et al., 2017). Large-bodied mammals are of particular interest due to their charismatic nature, role in forest dynamics, or as a source of food for local peoples (Wright et al., 1994; Parry et al., 2009). Monitoring programs are also important because many mammals are vulnerable to threats such as habitat fragmentation and overhunting (Espinosa and Salvador, 2017; Pardini et al., 2018). To address these threats, monitoring programs must produce reliable estimates of abundance that can be used to guide management decisions (e.g., sustainable consumption) and conservation action (Katzner et al., 2011).
Line transects and camera traps are among the most common monitoring approaches to study terrestrial mammals (e.g., Silvius et al., 2004; Espartosa et al., 2011). Distance sampling on line transects typically relies on visual encounters to model the probability of detecting an animal and produce estimates of density (Buckland et al., 2001). Limited visibility in dense tropical forests coupled with low densities and nocturnal or shy behavior of many species may result in low encounter rates and poor estimates of density (Espartosa et al., 2011; Munari et al., 2011). For example, Parry et al. (2009) found that the abundance of lowland tapirs (Tapirus terrestris) could not be accurately estimated without extensive replication efforts due to low rates of visual encounters. Fragoso et al. (2016) confirmed this challenge and noted that visual encounters were low even after considerable effort.
Camera traps are an alternative method that can increase visual encounters. However, estimating abundance from these data is difficult and methods are still being refined and developed (e.g., Palencia et al., 2021). As a result, camera traps are often used to estimate the probability of occurrence (i.e., occupancy). Although occupancy models provide data on the distribution of species, they fail to provide information necessary for some management activities (e.g., harvest rates, which rely on abundance) (Fragoso et al., 2016). Given these limitations, as well as the expense of camera traps (e.g., Lyra-Jorge et al., 2008), there is a need for an efficient, reliable, and cost-effective method for monitoring large-bodied mammal populations in the Amazon (see also Munari et al., 2011).
One promising method focuses on counting signs, particularly tracks. The Formozov-Malyshev-Pereleshin (FMP) formula estimates density based on track counts on line transects (Stephens et al., 2006). These surveys are not dependent on seeing live animals and are increasingly used to assess terrestrial mammal populations (Keeping, 2014). While identifying tracks is a longstanding method (e.g., Bider, 1968), it has typically been used to calculate encounter rates (e.g., Reyna-Hurtado and Tanner, 2007). The FMP method estimates density based on track counts and an animal’s daily movement distance (Keeping, 2014). Utilizing the FMP method with line transects data is appealing because of its low cost and equipment requirements and the ability to estimate density. This method also represents an opportunity to engage local people and utilize their detailed knowledge of animal populations (Keeping et al., 2018).
I use data collected by Indigenous hunters in the Ecuadorian Amazon to estimate density using the FMP method. I focus on four large-bodied mammals: collared peccary (Peccari tajacu), white-lipped peccary (Tayassu pecari), lowland tapir (Tapirus terrestris), and jaguar (Panthera onca). The goals of the study are to (1) determine which method (i.e., tracks or visual encounters) best detects these species’ presence in the study area with the least amount of effort, (2) apply the FMP method to estimate the density of the focal species within both hunted and nonhunted areas, and (3) compare these results to density estimates from across the Amazon.
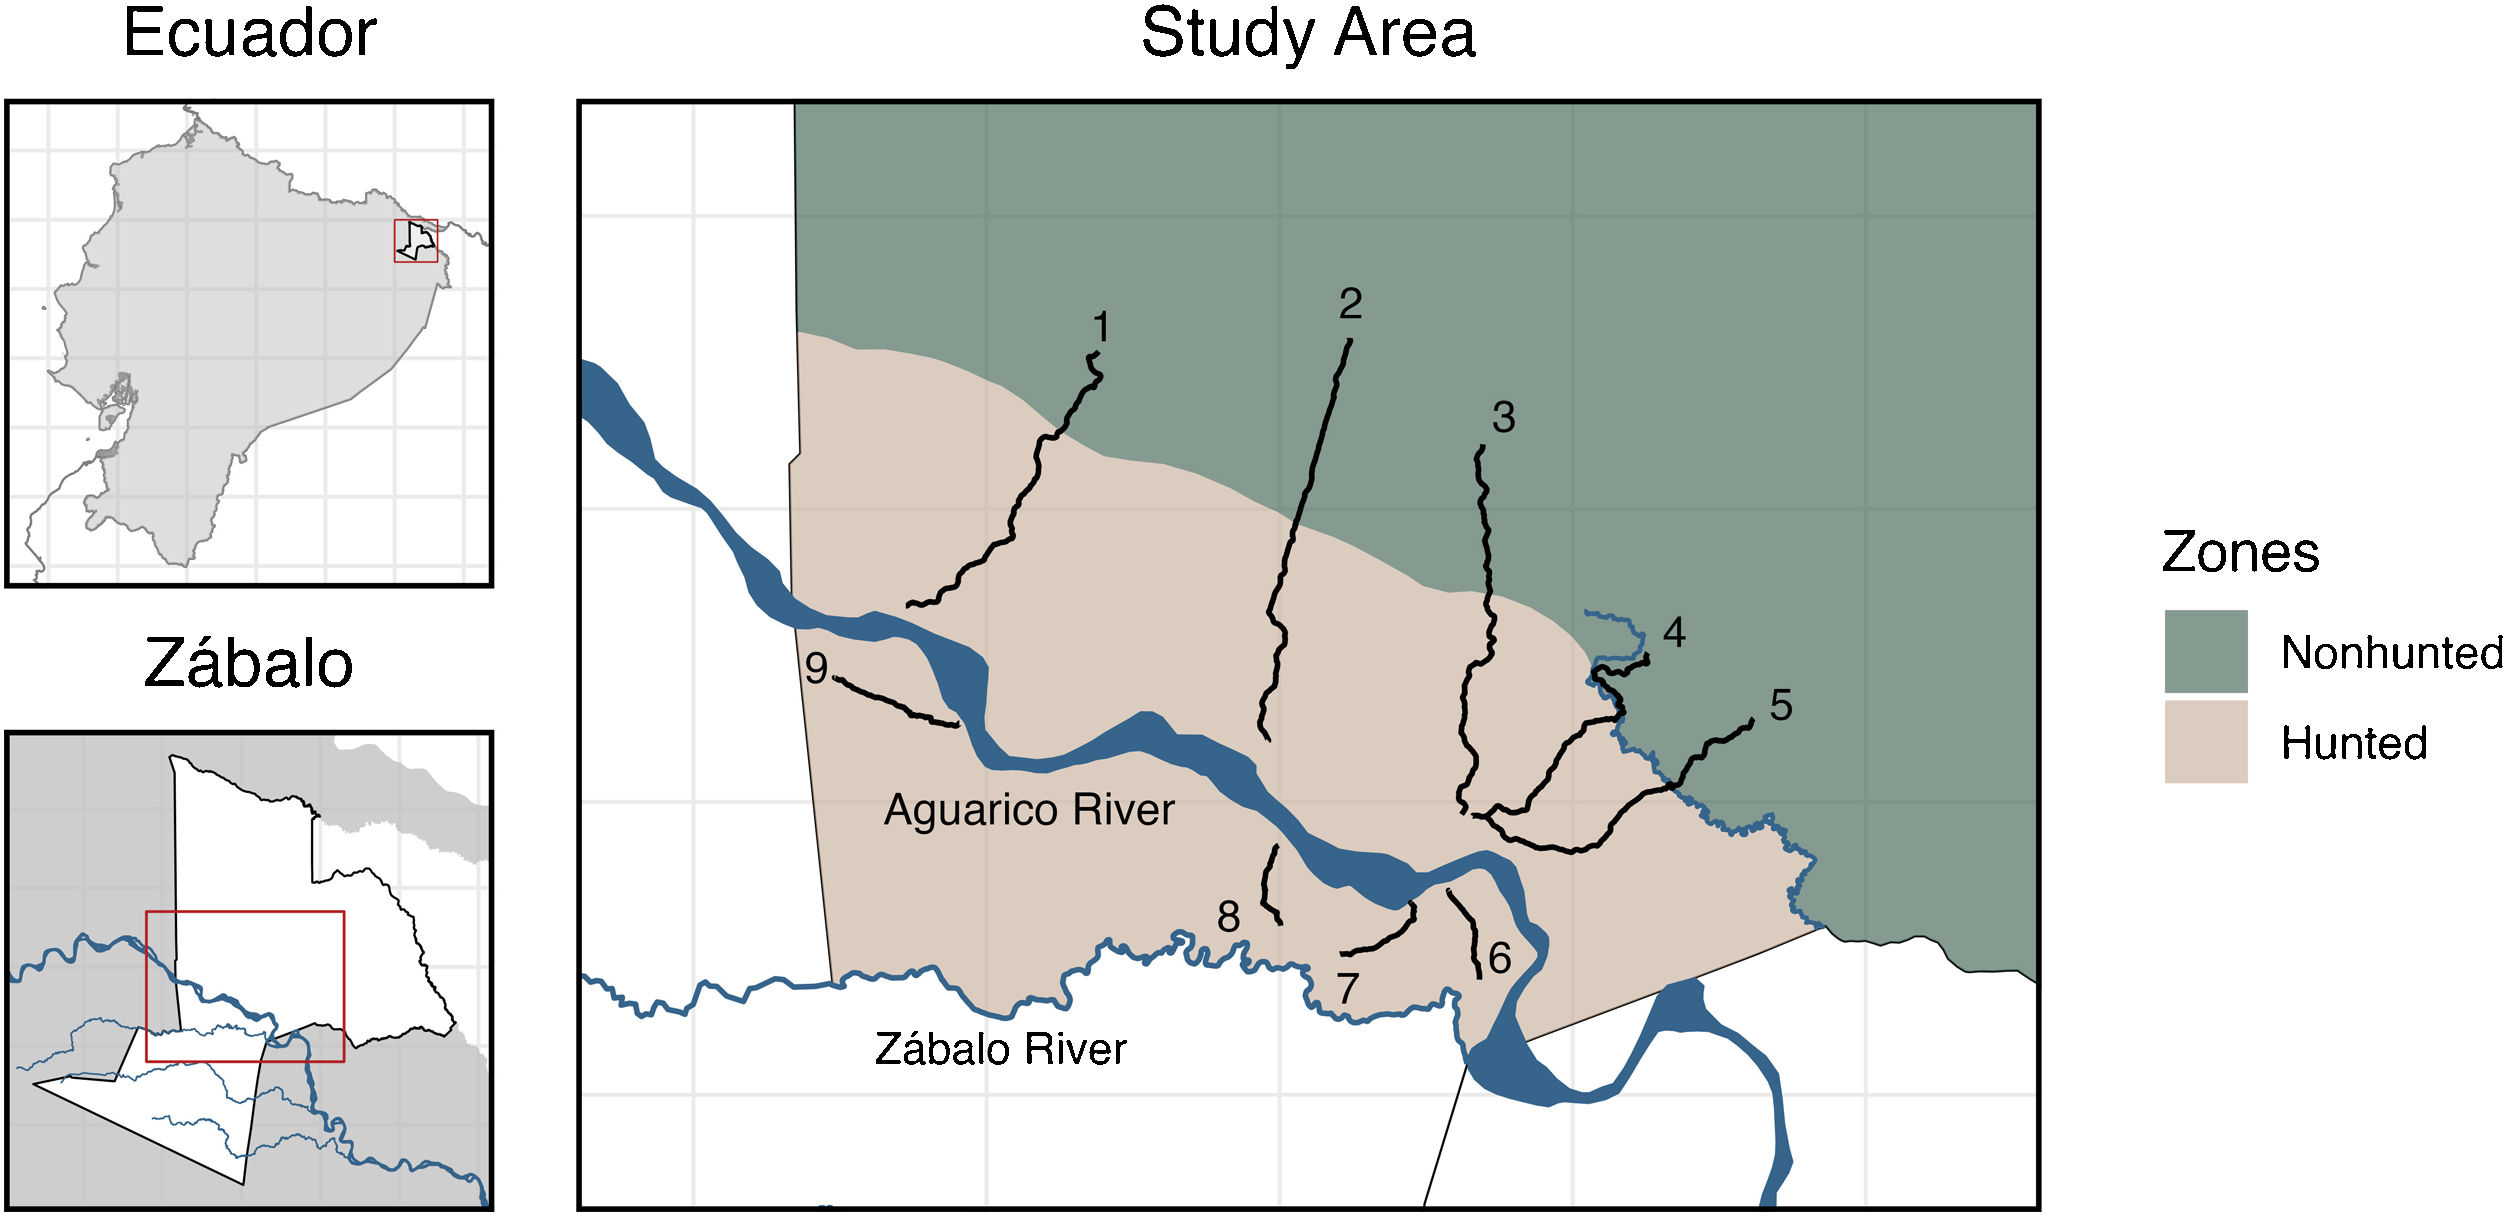
MethodsStudy AreaResearch activities were conducted in the Indigenous Cofán territory of Zábalo in the northern Ecuadorian Amazon (Fig. 1). Zábalo comprises approximately 145,000 hectares of diverse forest and wetland ecosystems, including blackwater rivers, swamps, and intact forests (Alverson et al., 2008). Species richness of several biological groups in this region are among the world’s highest (Bass et al., 2010). Zábalo residents have developed collective rules to steward their resources, including boundaries that distinguish between hunting areas and reserve areas where game populations can reproduce (Centro Cofán Zábalo (CCZ), 2008; Fig. 1).
Transect surveys
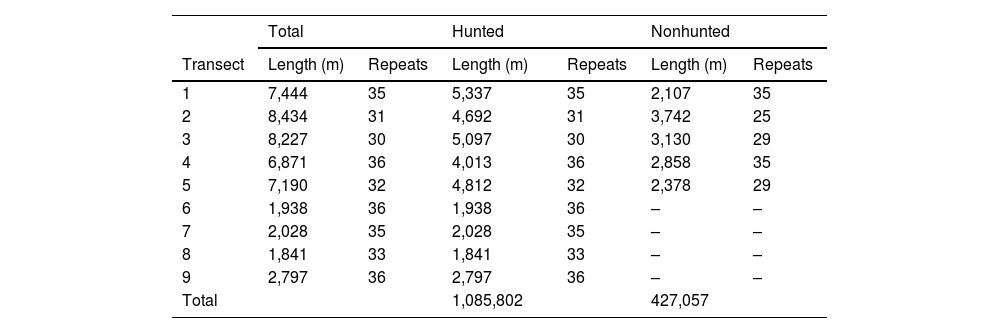
From January to December 2018, five expert Cofán hunters (hereafter ‘monitors’) conducted regular surveys in Zábalo along 9 transects varying in length from 2 to 9 km (see Table 1). These transects were established to sample diverse habitats in hunted and nonhunted areas. Surveys were initiated approximately 2 weeks after the transects were opened. Transects were less than 1 m wide and were separated by at least 2 km to maximize independence of animals detected. North of the Aguarico River, transect length and direction was selected to sample both hunted and nonhunted areas (Fig. 1). Transects south of the Aguarico River extended until they reached an area regularly flooded by the Zábalo River or the territory boundary. These transects are not perfectly straight; they curve to avoid (or more directly traverse) challenging landscape features such as flooded forests, large swamps, dense vegetation, and rivers. Such transects maintain a random element of survey design, while also improving survey conditions (e.g., safety, motivation) and conserving project costs (see Esbach and Patra, 2022 and Discussion).
Transect distances and number of times each was surveyed.
| Total | Hunted | Nonhunted | ||||
|---|---|---|---|---|---|---|
| Transect | Length (m) | Repeats | Length (m) | Repeats | Length (m) | Repeats |
| 1 | 7,444 | 35 | 5,337 | 35 | 2,107 | 35 |
| 2 | 8,434 | 31 | 4,692 | 31 | 3,742 | 25 |
| 3 | 8,227 | 30 | 5,097 | 30 | 3,130 | 29 |
| 4 | 6,871 | 36 | 4,013 | 36 | 2,858 | 35 |
| 5 | 7,190 | 32 | 4,812 | 32 | 2,378 | 29 |
| 6 | 1,938 | 36 | 1,938 | 36 | – | – |
| 7 | 2,028 | 35 | 2,028 | 35 | – | – |
| 8 | 1,841 | 33 | 1,841 | 33 | – | – |
| 9 | 2,797 | 36 | 2,797 | 36 | – | – |
| Total | 1,085,802 | 427,057 | ||||
Monitors walked each transect approximately three times per month with a minimum of five days between a survey on the same transect (Table 1). Surveys began at approximately 0700 and were conducted at a pace of 1−2 km per hour. The longest transects were completed by about 1100. Monitors collected multiple data types at the same time (e.g., track counts, visual encounters). For each observation, they recorded the time, location on the transect, animal name, distance to the animal and angle (following Buckland et al., 2001), number of animals in the group, observation type (e.g., sight, sound, track), weather, and other information. Only tracks found within one meter of the transect (i.e., a two-meter-wide band) and no older than 24 h were recorded. Prior to initiating this work, I trained each monitor to collect data and assessed their ability to distinguish between different animal tracks. I also regularly accompanied the monitors on their surveys.
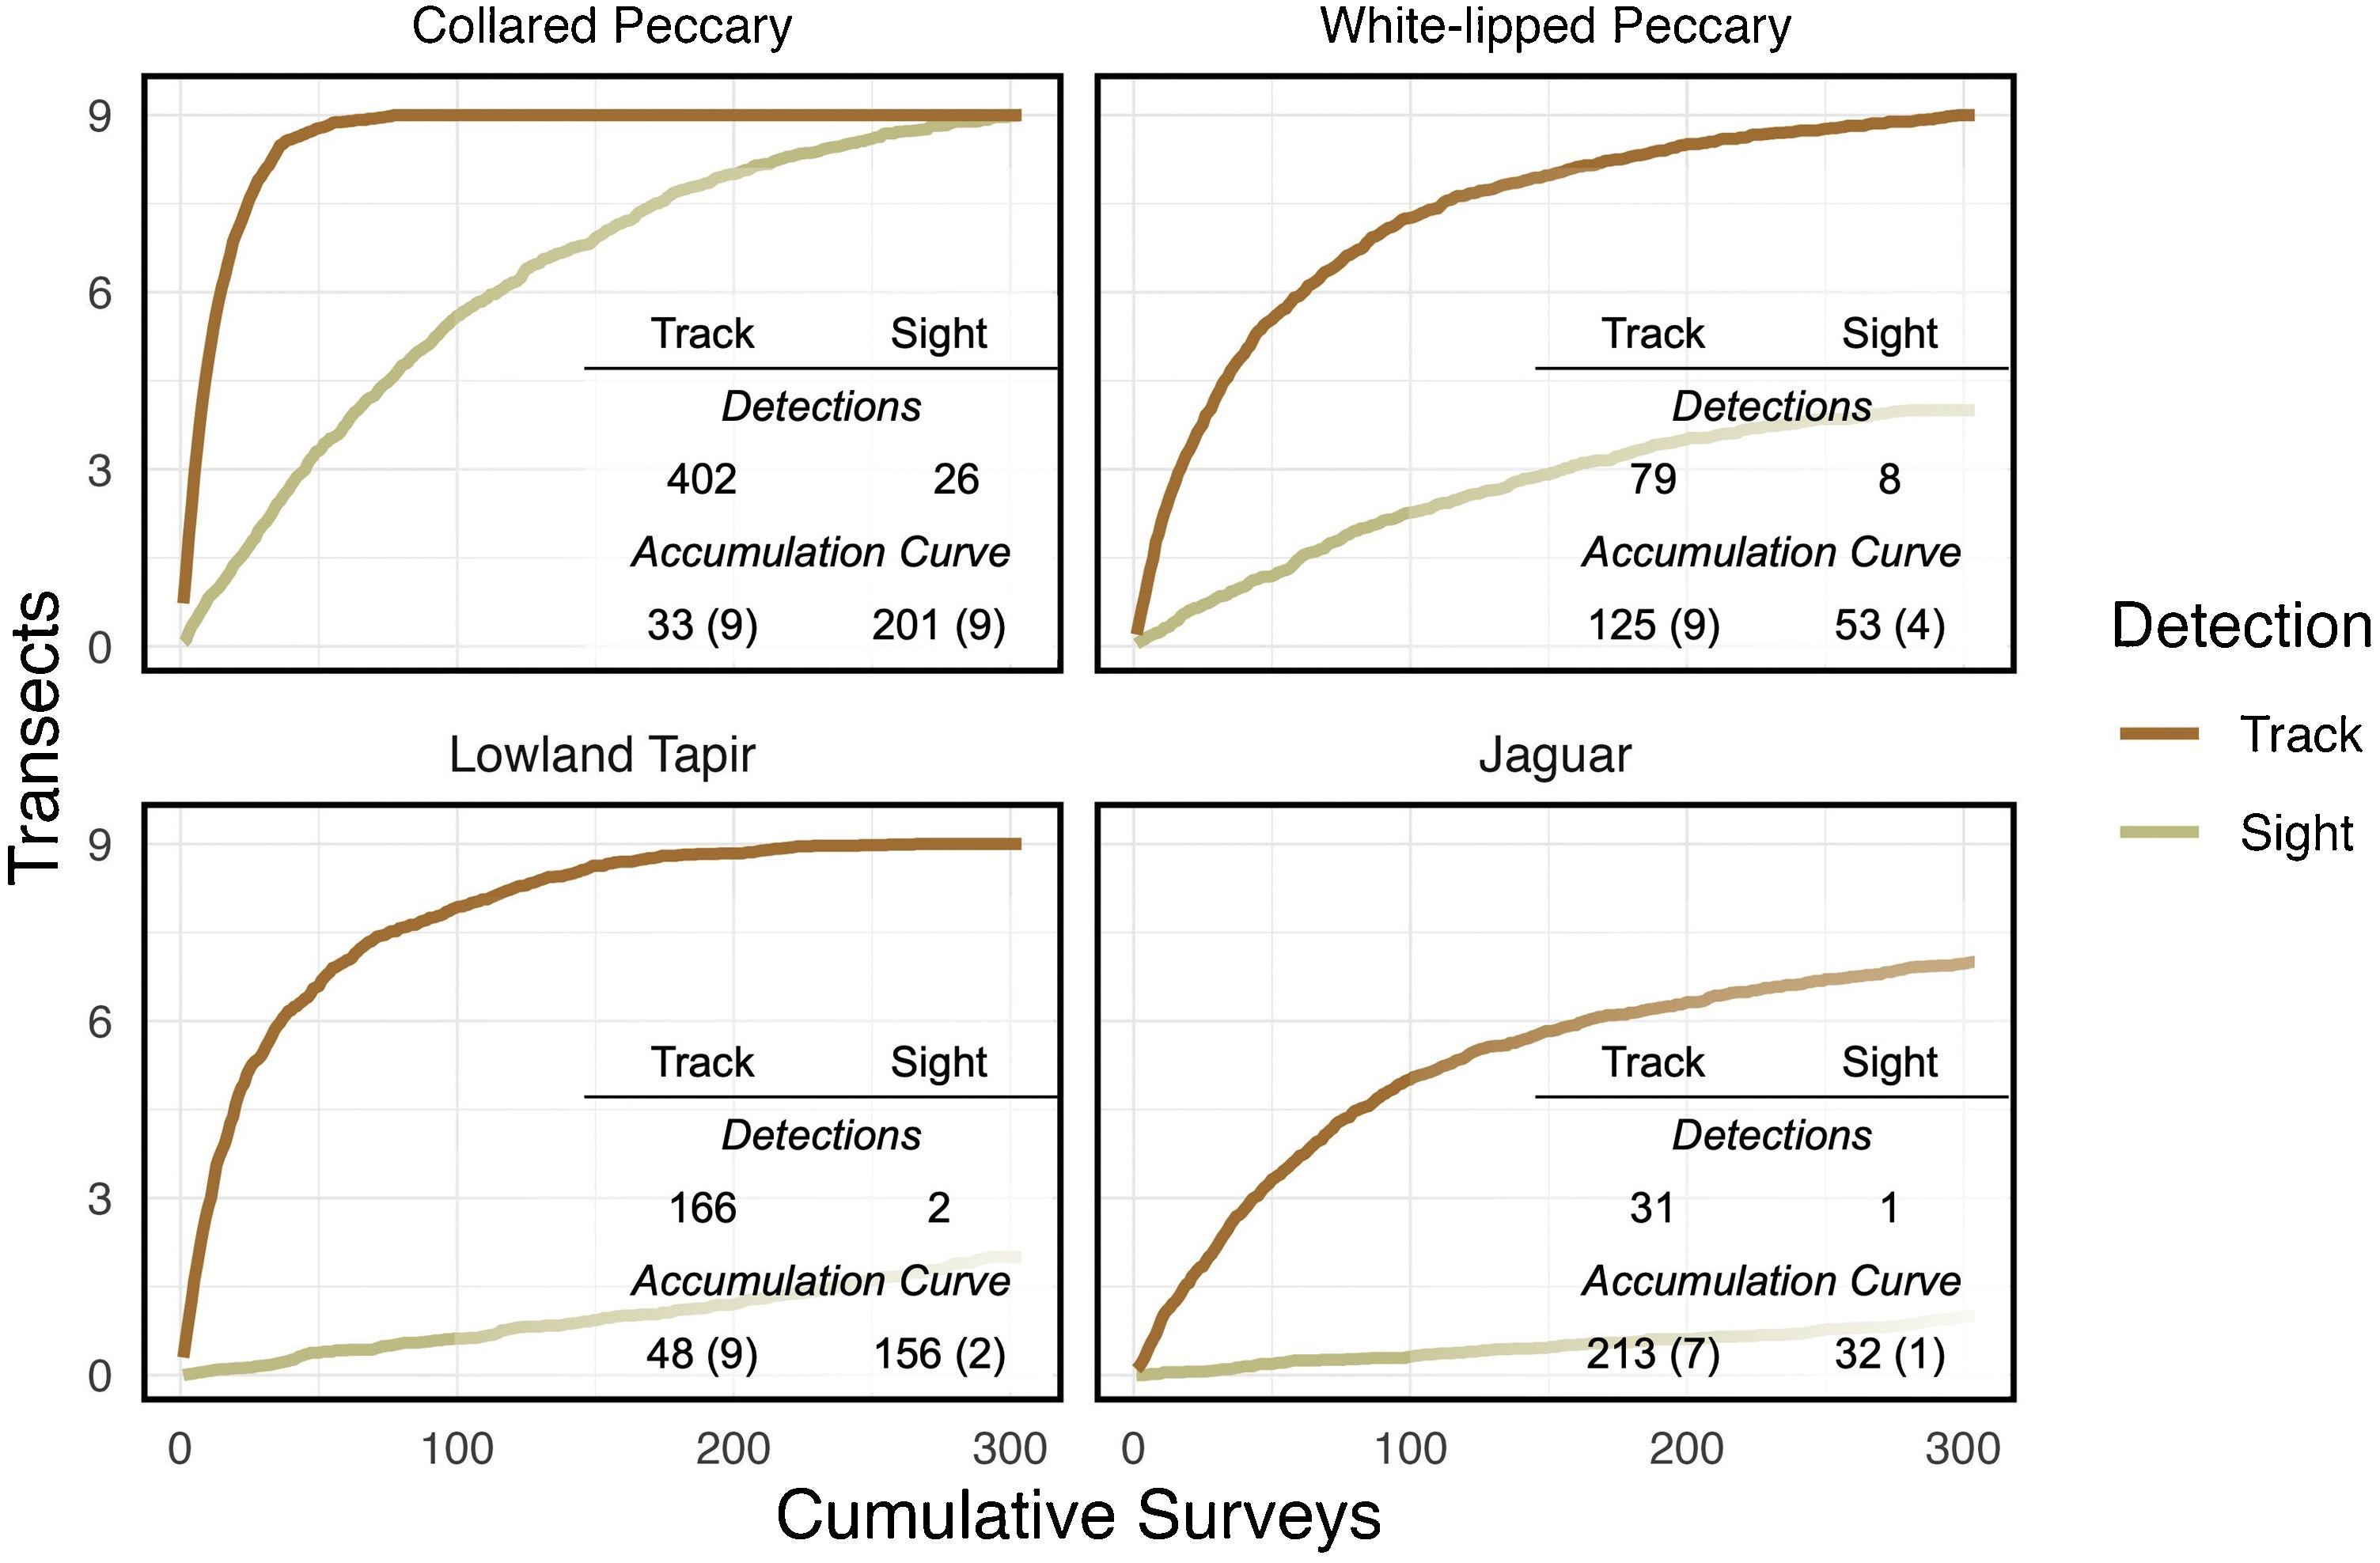
Accumulation curvesFollowing Fragoso et al. (2016), occurrence and efficiency were used to determine which method of detection (i.e., visual encounter or track) was most reliable for each species. Occurrence is expressed as the total number of transects where a species was detected. Efficiency is expressed as the total number of surveys (i.e., repeated transect walks) conducted to find the species on each transect where it occurred. Accumulation curves were developed for each method and species to assess the number of transects on which a species occurred relative to the number of times the transects were surveyed (Fragoso et al., 2016). The number of surveys needed to reach an asymptote indicates the amount of effort required to maximize detections in the study area during the study period.
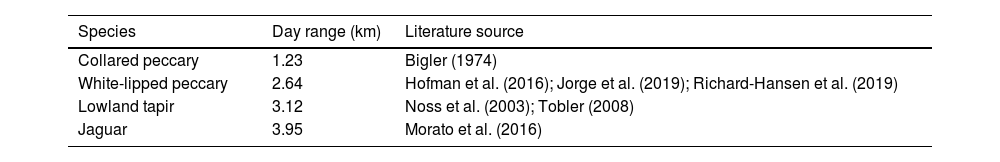
Density estimationThe FMP method was used to estimate density. Per Stephens et al. (2006), this method relies on the formula, D=π2xSM^, where x is the number of animal tracks located on transects in each area (i.e., hunted and nonhunted), M^ is the average daily distance that each animal travels, and S is the total transect length in each area (i.e., the transect length multiplied by the number of replicates; Table 1). Day-range estimates come from published data for each focal species; the mean was used when multiple estimates were located (Table 2). No substantial differences between the day ranges of different sexes and age groups are assumed (Keeping, 2014). Day-ranges are rarely reported in the literature (see Discussion). In the case of collared peccary, I used data from a study outside of the Amazon due to the lack of published estimates. Tracks were recorded for groups of peccaries and individuals for tapir and jaguar. Group density was multiplied by the average group size to estimate individual density.
Day range estimates for focal species.
| Species | Day range (km) | Literature source |
|---|---|---|
| Collared peccary | 1.23 | Bigler (1974) |
| White-lipped peccary | 2.64 | Hofman et al. (2016); Jorge et al. (2019); Richard-Hansen et al. (2019) |
| Lowland tapir | 3.12 | Noss et al. (2003); Tobler (2008) |
| Jaguar | 3.95 | Morato et al. (2016) |
The FMP method’s primary source of uncertainty is the variance in the number of detections across transects (Keeping, 2014). Nonparametric bootstrapping (Efron and Tibshirani, 1993) was used to resample track counts across all transects with replacement. This step was repeated 5000 times to calculate 95% confidence intervals (CI) using R software (R Core Team, 2022).
Comparing estimatesResults from the FMP method were compared to published density estimates from across South America, with a focus on studies in the Amazon that include hunted and nonhunted locations. Published density estimates include those derived from multiple methods (e.g., transects, camera traps).
ResultsTransect surveysNine transects were surveyed a combined 304 times, totaling over 1500 km walked. Fifty-six species were registered, 13 of which included track data.
Accumulation curvesDeveloping accumulation curves can quickly help to determine the best method of analysis. Track detections were greater than visual detections and occurred on more transects for each focal species (Fig. 2). White-lipped peccary, lowland tapir, and jaguar were not seen on several transects even after 304 cumulative surveys.
, followed by effectiveness in parentheses (the total number of transects where the animal was detected;9 total).")
Detections and asymptote data for focal species. Accumulation curve data presented as occurrence (the number of surveys required to capture a species on every transect where it is detected;304 total), followed by effectiveness in parentheses (the total number of transects where the animal was detected;9 total).
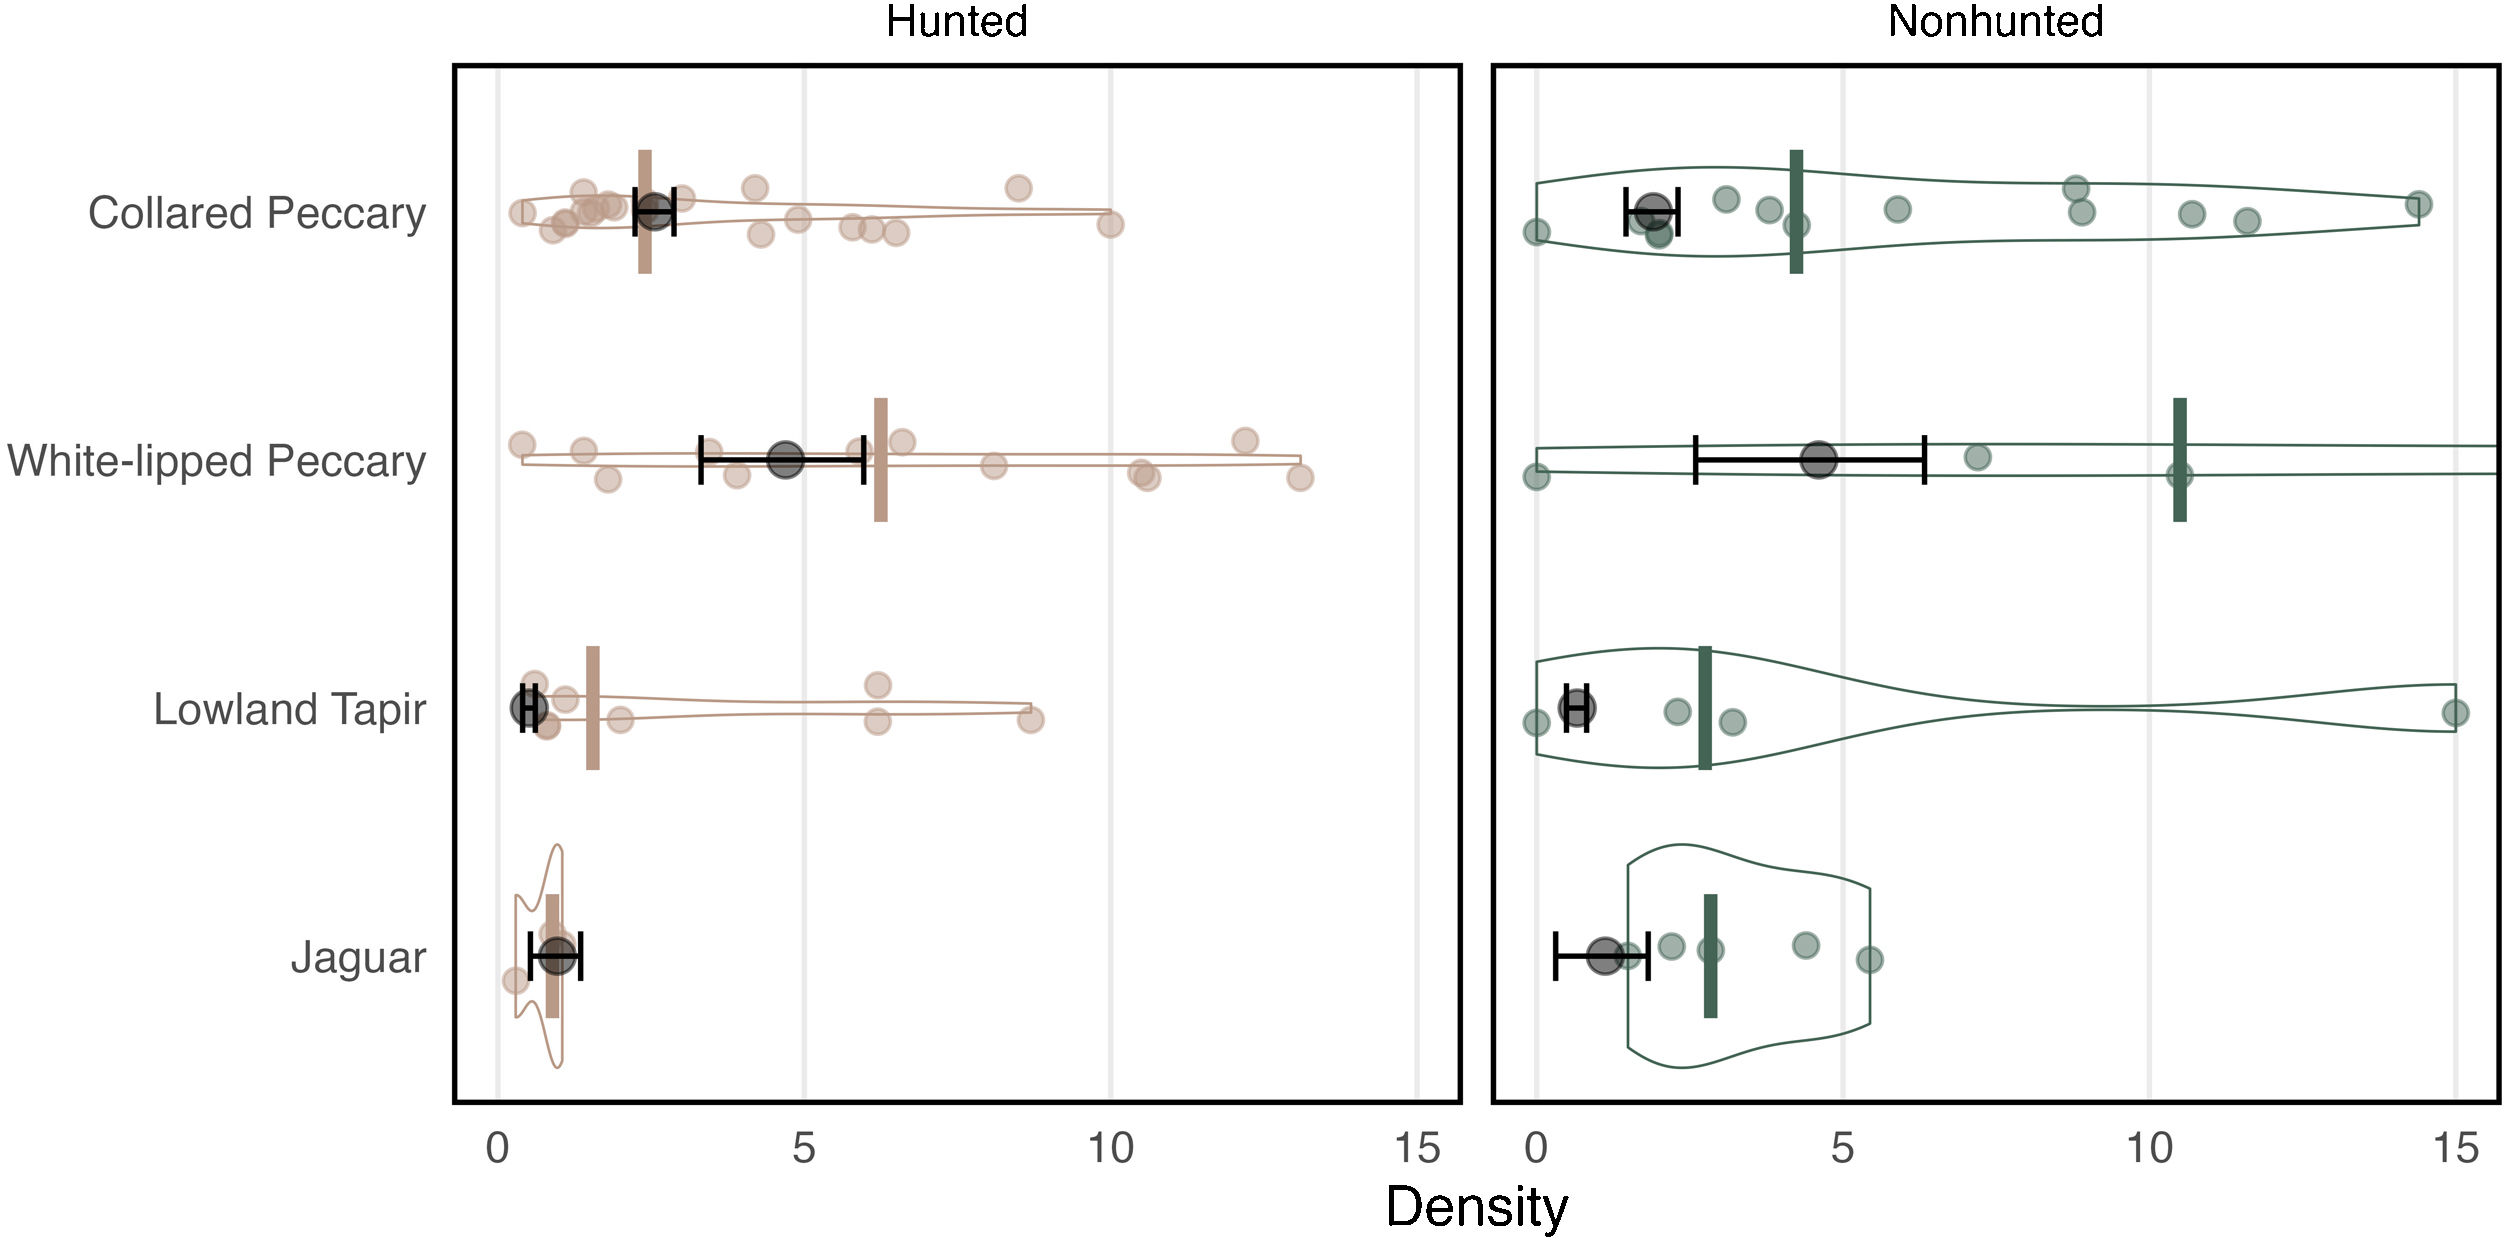
Density and 95% CI were estimated for each focal species (Fig. 3, Supplementary Table 1). Collared peccary density was higher in the hunted area than the nonhunted area. White-lipped peccary and lowland tapir were just as abundant in the hunted sites as the nonhunted sites. Jaguar density was slightly higher in the nonhunted area. To estimate individual density for peccary species, I utilize an average group size of 7 for collared peccary and 150 for white-lipped peccary based on data collected from visual encounters and discussions with monitors and hunters.

Density estimates using the FMP method and from the literature review. Estimates from this study are shown in in black with 95% CI. The median density from the literature is shown as a colored bar with violin plots and points representing each individual estimate from the literature. Collared peccary and white-lipped peccary individual density is presented here with average group size equal to 7 and 150 individuals respectively. Lowland tapir and jaguar density estimates are represented as individuals/10 km2 and individuals/100 km2 respectively.
A total of 84 density estimates from 21 articles that differentiated between hunted and nonhunted sites across the Amazon were identified. The methods utilized to estimate density primarily included transect surveys (based on visual encounters) and camera-trap surveys. Density estimates derived using the FMP method were compared to the median density estimate from the literature (Fig. 3, Supplementary Table 1). In the case of one study (Endo et al., 2010), where density estimates were provided for each transect in the study area, I averaged these estimates in each area to avoid bias. I examine each species in turn below.
Collared peccaryCollared peccary densities vary widely as they utilize diverse habitats (Desbiez et al., 2010). Along with white-lipped peccaries, they are also considered prize game species and are regularly hunted (e.g., Bodmer et al., 1997). As a result, densities are often impacted by hunting pressure (e.g., Peres, 1996, see Supplementary Table 2). In the literature review, the median density estimate was 2.4 in hunted areas and 4.24 in nonhunted areas. Unlike much of the literature, the density of collared peccaries in the nonhunted area of this study was lower than in the hunted area. The density estimate of 2.56 in the hunted area was close to the literature median, while the estimate of 1.91 in the hunted area was below the literature median (Fig. 3, Supplementary Table 1).
White-lipped peccaryWhite-lipped peccary density is impacted by different habitats, landscape fragmentation, and hunting pressure. According to (Fragoso et al., 2022), white-lipped peccary density in the Amazon can be classified as at low at approximately 5, average at about 10, high at about 15, and superabundant at 20–100 or more. In the literature review, the median density estimate was 6.25 in hunted areas and 10.50 in nonhunted areas. The density estimate of 4.70 in the hunted area was below the literature median, and the estimate of 4.61 in the nonhunted area was well below the literature median (Fig. 3).
Lowland tapirPrevious research suggests that lowland tapir can adapt to different habitats but frequently select habitat based on water and resource availability (Medici, 2010). Studies have also shown that tapir density is negatively affected by habitat fragmentation and hunting (Peres, 2000). Estimating tapir density is, however, difficult because they are predominately nocturnal and rarely seen (Tobler et al., 2013a). Visual encounters are even low on nocturnal transects (Medici, 2010). Thus, it is possible that many reported estimates from camera trapping or line transects with few detections incorrectly estimate density (see Fragoso et al., 2016). In the literature review, the median density estimate of tapir was 0.15 in hunted areas and 0.27 in nonhunted areas (Fig. 3). The density estimate of 0.05 in the hunted area was therefore below the literature median, and the estimate of 0.07 in the nonhunted area was also well below the literature median estimate.
JaguarAlthough jaguars have been studied for decades, they are challenging to monitor because their population densities are often low and their home range sizes are large (Silver et al., 2004). These challenges make robust density estimates difficult to obtain, often qualified by small sample sizes and assumptions related to occurrence and home range size (Tobler et al., 2013b). In the literature review, the median density estimate was 0.89 in hunted areas and 2.84 in nonhunted areas (Fig. 3). The density estimate of 0.97 in the hunted area was therefore above the literature median, while the estimate of 1.12 in the nonhunted area was below the literature median.
DiscussionThe primary goal of many monitoring programs is to estimate the abundance and/or density of wildlife populations and examine changes over time (Munari et al., 2011). Estimating the population size of many large mammals, however, is challenging because methods rely on visual encounters and large numbers of surveys are needed to encounter many species at frequencies that enable accurate estimates (Fragoso et al., 2016). For example, Buckland et al. (2001) suggest a minimum of 40 visual encounters to reliably estimate density using distance sampling methods on line transects. Given these challenges, a combination of different survey methods and analyses are needed to support effective monitoring programs in the Amazon (Munari et al., 2011). The FMP method presented here represents another tool that can be used to monitor populations of large mammals that are often difficult to see in tropical forests.
Track counts collected by expert Indigenous hunters along line transects is an effective method of monitoring large-bodied terrestrial mammals in the Amazon. In terms of detection, tracks of the focal species were found on more transects across the study area with less effort than it took to visually encounter each animal. Even with this study’s large sampling effort, I did not obtain sufficient visual encounters for the target species to estimate density (see also Fragoso et al., 2016). The density results from the FMP method also appear to be reasonable given comparative estimates from across the Amazon. Incorporating more density estimates in the review and estimating density in the same study area using other methods (e.g., camera traps, distance sampling) will provide an important source of comparison if those data can be captured.
Survey design is also an important aspect of monitoring programs. In this study, track counts were variable across the nine transects for each species (Supplementary Fig. 1). Additional surveys may have increased visual and track detections but this effort and cost would need to be considered. Transect placement is also an important element of survey design. Using existing features can bias estimates as they might correlate with animal density (Marques et al., 2013). This survey utilized a random design but transects curved to ensure safety as monitors crossed challenging features (see Esbach and Patra, 2022). Transect length was selected to sample both hunted and nonhunted areas in a cost-efficient manner. This posed a challenge given the interaction between hunted and nonhunted areas (i.e., sink and source), which might explain the similar estimates of density. More generally, transects may attract certain species, particularly jaguars, so care should be taken to ensure that transects are only lightly cleared. Hunters also used some of these transects occasionally, but I believe straight line transects would have also been used advantageously. As a source of comparison, Fragoso et al. (2016) utilized 216 straight line transects within hunted and nonhunted areas, each 4 km long and separated by at least 3 km. Despite more effort (i.e., over 40,000 km walked by Fragoso et al., 2016), each study points to the importance and efficiency of sign data. In the future, it will be interesting to estimate density using the FMP method for such sites to further test its utility. Moreover, both studies point to the importance of expert hunters and additional training to ensure accurate data collection (see Luzar et al., 2011).
When considering any field method, it is important to be aware of its efficiency, limitations, and challenges. Limitations are variable, but may include the region’s accessibility, project timeline, and budget (Lyra-Jorge et al., 2008). For the FMP method, challenges include missing tracks, incorrectly identifying tracks, the presence of appropriate soils for footprint impression, and difficulty in accurately estimating the day range for species of interest (Keeping, 2014). In terms of footprint impression, dry conditions can make tracks harder to see and age. In response, I examined track counts during the wet and dry season but did not find any significant trends (Supplementary Fig. 2).
Perhaps the most important opportunity for using the FMP method is its reliance on Indigenous knowledge. For Indigenous monitors, transect-based methods are relatively intuitive and directly utilize place-based knowledge and skills (see also Keeping, 2014). Indigenous decision makers can use the method to strengthen community participation and produce information important for management. The method also offers an opportunity for external researchers to improve collaborations with local peoples by engaging them in data collection and other activities. Ultimately, research within Indigenous territories should choose methods that utilize local knowledge and skills, as opposed to replacing those skills with technologies (e.g., camera traps) or external, professional biologists (see Danielsen et al., 2009; Luzar et al., 2011). Collecting track data can support this process in a reliable and cost-efficient way, and it can support Indigenous peoples to maintain knowledge and practice specific skills. Overall, the FMP method is a tool that can easily complement transect surveys and improve our understanding and management of wildlife across Amazonia and the tropics more broadly.
FundingThis research did not receive any specific grant from funding agencies in the public, commercial, or not-for-profit sectors.
Conflict of interestThe author declares that he has no known competing financial interests or personal relationships that could have appeared to influence the work reported in this paper.
I am very grateful to the people of Zábalo and the monitors that collected data utilized in this study. This includes Alfonso Yiyoguaje, Oswaldo Criollo, Leonardo Criollo, Rainel Criollo, Andres Mendua, Stalin Narvaez, Hiter Yiyoguaje, and Romel Yiyoguaje. I also thank Bette Loiselle and John Blake for their helpful comments and suggestions, as well as two anonymous reviewers for their suggestions that greatly improved this manuscript.
The following is Supplementary data to this article:

