


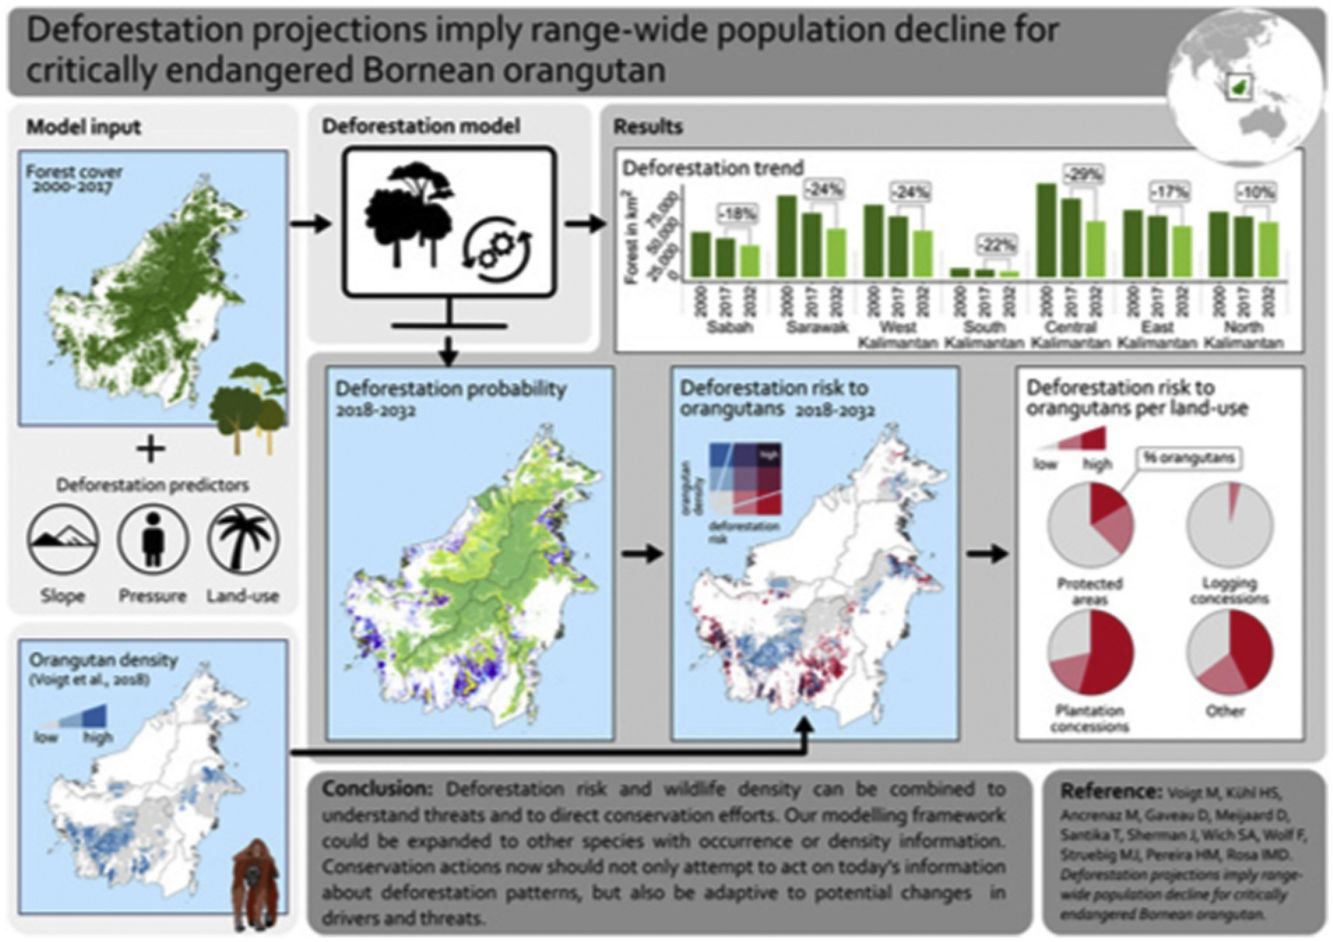
Assessing where wildlife populations are at risk from future habitat loss is particularly important for land-use planning and avoiding biodiversity declines. Combining projections of future deforestation with species density information provides an improved way to anticipate such declines. Using the critically endangered Bornean orangutan (Pongo pygmaeus) as a case study we applied a spatio-temporally explicit deforestation model to forest loss data from 2001 to 2017 and projected future impacts on orangutans to the 2030s. Our projections point to continued deforestation across the island, amounting to a potential loss of forest habitat for 26,200 orangutans. Populations currently persisting in forests gazetted for industrial timber and oil palm concessions, or unprotected forests outside of concessions, were projected to experience the worst losses within the next 15 years, amounting to 15,400 individuals. Our analysis indicates the importance of protecting orangutan habitat in plantation landscapes, maintaining protected areas and efforts to prevent the conversion of logged forests for the survival of highly vulnerable wildlife. The modeling framework could be expanded to other species with available density or occurrence data. Our findings highlight that species conservation should not only act on the current information, but also anticipate future changes to be effective.
Borneo is globally important for biodiversity but experiences some of the highest deforestation rates in the world. Since 1973, the island lost >30% of its original old-growth forest cover to agriculture, plantations, mining, infrastructural development, and forest fires. To reduce these deforestation pressures on the natural environment, land-use planning and conservation should incorporate insights from past patterns and drivers of land-use change and consider potential future deforestation trajectories.
Advances in spatially-explicit and dynamic deforestation modeling offer new ways to study current and expected future forest loss in the tropics (Rosa et al., 2013). In comparison to previous approaches (Lapola et al., 2011; Soares-Filho et al., 2006), these models dynamically project deforestation as a sum of local events, influenced by past patterns of various drivers, rather than imposing a fixed deforestation rate based on historical trends. While deforestation projections have been more commonly applied in South America (Rosa et al., 2013; Silva et al., 2020), there are far fewer assessments available for Southeast Asia despite this being a region of high forest loss (Voigt et al., 2021).
Recent increases in the availability of species observation data, as well as advances in computational power and statistical methods, provide improved estimates of range-wide species density distributions (e.g., Strindberg et al., 2018; Wich et al., 2016). A density distribution model for the Bornean orangutan (Pongo pygmaeus), for example, indicated that the population declined by 30% (>100,000 individuals) between 1999 and 2015 (Voigt et al., 2018). Large-scale deforestation, together with killing in conflict or for food, severely threatens the long-term population viability of this species and stable orangutan populations only persist in landscapes with sufficient forest cover (Ancrenaz et al., 2016).
Here we use the Bornean orangutan as a case-study to demonstrate how coupling of deforestation projections with density distribution models can help estimate future population impacts of land-cover change on a forest dependent species that has been classified as ‘Critically Endangered’ by the IUCN (Ancrenaz et al., 2016). We tailored a deforestation model to each Bornean administration within the orangutan range (five Indonesian provinces; two Malaysian states—hereafter all referred to as provinces), identified drivers and patterns of land-cover change in the past (2000–2017), and projected them into the future (2018–2032) under a business-as-usual scenario. By identifying the orangutan population units most vulnerable to potential future deforestation, our approach can be used to guide pre-emptive conservation efforts and serve as baseline against which certain policy interventions can be tested. The approach could be equally as valid for other species and regions where wildlife information and deforestation trends are well documented.
MethodsForest maps and deforestation driversWe utilized a previously published dataset specific to Borneo, quantifying natural forest loss between 2001 and 2017 at a resolution of 30 m (Gaveau et al., 2019, Table S1). Forest loss or deforestation is defined as the permanent annual removal of intact or logged old-growth forest that is closed-canopy (>80% cover), and includes high-carbon evergreen dipterocarps on mineral or peat soils, low-biomass pole forests on peat domes, heath forest, and mangroves (Gaveau et al., 2019). Intact and selectively logged forests are similar to “primary” and “secondary” forests on the Indonesian Ministry of Forestry and Environment’s forest maps (MoEF, 2018).
Patterns of tropical deforestation are shaped by physical and accessibility characteristics, anthropogenic pressures, and land-use (Austin et al., 2019; Curtis et al., 2018). We compiled spatial data on elevation, and distance to roads and rivers, indicating ease of access to the forest; human population density and fire occurrence to represent human pressure; and official land-use designation (Table S1, Supporting Information S1). Land-use was categorized as protected areas (IUCN and UNEP-WCMC, 2017), industrial plantation and logging concessions, as well as unprotected areas outside of concessions (Santika et al., 2015). The selection was based on literature describing important drivers of deforestation in the tropics and for Borneo specifically (Austin et al., 2019; Rosa et al., 2013; Struebig et al., 2015).
All layers were converted to the Asia South Albers Equal Area Conic projection and resampled to the same extent and origin at 1 km2 pixel size, the highest resolution common to all layers, using bilinear interpolation for continuous predictors and nearest-neighbor interpolation for categorical predictors. Spatial manipulations and analyses were undertaken in Python (Python Software Foundation, 2019), R (R Core Team, 2020) and ArcGIS (Esri Inc., 2014).
Deforestation model frameworkWe used the modeling approach developed by Rosa et al. (2013) to project the probability of future deforestation for each Bornean province. The model accounts for stochasticity of deforestation, and province-wide forest loss rates emerge as the sum of local deforestation events, resulting from the influence of drivers operating in each particular province. Using a forward-stepwise model selection, all non-correlated predictors (Pearson’s correlation coefficient <0.7) were successively added to a model, which was fitted to five years of forest loss data from 2013 to 2017 (calibration period). We selected this calibration interval length by considering the trade-off between short intervals, potentially reflecting exceptional years, or long intervals, potentially including outdated trends (Rosa et al., 2015).
For each province a cross-validation technique was used to assess the predictive power gained by iteratively adding predictors to the model. Half of the data were used to train the model each time and projections were compared to the remaining 50%. After successively adding variables in the order in which they contributed to the highest likelihood, the overall best model was selected for each province (Supporting Information S2, Table S2).
SimulationsThe highest performing model for each province was used to project the probability of deforestation for each pixel in the five-year calibration period (2013–2017) and the following three five-year periods (2018–2022, 2023–2027, 2028–2032) (Supporting Information S2). We restricted the overall period to 15 years since model-based projections become increasingly uncertain in the future due to uncertainty in socio-ecological and political processes (Schindler and Hilborn, 2015). This period also matches the time-frame in which orangutan data were collected for the abundance model (1999–2015), and deforestation records for training the model were generated (2000–2017).
The simulation was based on updating the model and past deforestation for each iteration and time step. Predictor uncertainty was incorporated by drawing the values for the simulations from a Gaussian distribution, using the estimated mean and standard deviation. We subsequently evaluated whether a pixel in a certain period and iteration was lost, by comparing its probability of deforestation with a randomly drawn number from a uniform distribution between 0 and 1. We then classified the pixel as deforested if the number was less than the deforestation probability, a procedure which converts probability into binary information with that probability. This also introduces stochasticity, which is a key characteristic of observed deforestation patterns (Rosa et al., 2013). This was repeated for all time steps and run 100 times to gauge uncertainty in predictions. The resulting binary forest maps were used to calculate projected deforestation and impact on orangutan populations. To characterise the deforestation risk across provinces and land-use classes, the binary maps were aggregated into a summed probability of deforestation.
Validation and analysisWe validated the projected forest loss maps for each province against observed losses for the calibration time-period (2013–2017), by calculating the perfect match, commission and omission errors. We also calculated the proportion of match between observed and projected forest loss (n = 100) within 1, 5 and 10 km neighborhood of a pixel following Rosa et al. (2013, 2014).
Impacts of projected deforestation on orangutan abundanceWe calculated the projected future impact of deforestation on orangutans by overlaying the projected forest loss with current orangutan density distribution maps. Orangutan density distribution was based on orangutan nest surveys implemented between 1999 and 2015 (4316 km survey effort, median 86 transects per year) and a predictive density distribution model. The model considered survey year, climate, habitat cover and human threat predictors to estimate range-wide patterns of orangutan abundance (Voigt et al., 2018). We generated a baseline orangutan distribution for 2018 by excluding pixels deforested until 2017 (sensu Gaveau et al., 2019) from the density distribution layer of 2015.
To estimate the total projected loss of orangutans we excluded all pixels with projected forest loss from the orangutan abundance map, and summed the number of affected orangutans. Vulnerability of orangutan populations was assessed by calculating the proportion of orangutans within pixels with either low (0–33%), medium (≥33–67%) or high (≥67–100%) summed forest loss probability. Local orangutan abundance was also classified into low (0.01–0.5 in.ividuals/km2), medium (>0.5–2 in.ividuals/km2) or high (>2 in.ividuals/km2). Abundance thresholds were based on the spread of local densities and expert assessment of what constitutes low, medium or high orangutan density throughout Borneo (Utami-Atmoko et al., 2019). Last, we calculated the loss of forest and vulnerability and loss of orangutans within provinces and land-use categories. Presenting results in this way places a focus on overall orangutan numbers affected by deforestation. However, similarly we could also assess risk to specific populations following other criteria, such as genetic distinctness or within certain administrative boundaries. Confidence intervals of the number of orangutans affected were generated by randomly pairing deforestation projections (n = 100) with bootstraps of orangutan abundance (n = 1000) (Voigt et al., 2018). All orangutan numbers were rounded to the nearest 100.
ResultsDeforestation modelIn all provinces, previous forest loss, distance to roads and land-use were included in the best model (Table S2). Distance to rivers and elevation were included for six of the seven provinces, fire incidence for five provinces, and population density for three provinces. Probability of deforestation was highest near areas of past forest loss (Figs. 1 and 2e).
 and Indonesian (IDN) provinces on Borneo. Model coefficient values across provinces are summarized in a boxplot (median and 25th and 75th quartiles as hinges). Predictors with a coefficient smaller than zero (dashed line) were related to lower, and predictors with a coefficient larger than zero to higher forest loss. The effect of protected areas (PA) and concessions (grey shaded background) is relative to the effect of no protection or designation as concession. Strict PAs are IUCN category 1–3, sustainable use PAs are IUCN category 3–6 or no category and all protected areas recognized in the national land-use plans but not represented in the WDPA database (2017) are included as national PAs (Supporting Information S1 and S2). The intercept and predictors for which all provincial coefficients were close to zero (mean absolute coefficient smaller than 0.05 and a spread smaller than 0.1) were excluded from the figure (elevation, distance to road and rivers, fire incidence, human population pressure). The 95% confidence intervals derived from the 100 model iterations around points are not shown, as they fall within the points.")
Influence of land-use predictors across Malaysian (MYS) and Indonesian (IDN) provinces on Borneo. Model coefficient values across provinces are summarized in a boxplot (median and 25th and 75th quartiles as hinges). Predictors with a coefficient smaller than zero (dashed line) were related to lower, and predictors with a coefficient larger than zero to higher forest loss. The effect of protected areas (PA) and concessions (grey shaded background) is relative to the effect of no protection or designation as concession. Strict PAs are IUCN category 1–3, sustainable use PAs are IUCN category 3–6 or no category and all protected areas recognized in the national land-use plans but not represented in the WDPA database (2017) are included as national PAs (Supporting Information S1 and S2). The intercept and predictors for which all provincial coefficients were close to zero (mean absolute coefficient smaller than 0.05 and a spread smaller than 0.1) were excluded from the figure (elevation, distance to road and rivers, fire incidence, human population pressure). The 95% confidence intervals derived from the 100 model iterations around points are not shown, as they fall within the points.
 Administrative boundaries of Indonesia, Malaysia and Brunei. The position of Borneo can be seen in the inlay. Brunei is excluded from maps b and e, as important predictors did not contain sufficient information for this country. b) Land-use within forested areas (PAs–Protected areas, ITP–industrial timber plantations, IOPP–Industrial oil palm plantations). c) Elevation was derived from a digital elevation model by (Jarvis et al., 2008), d) Forest types were derived from (Miettinen et al., 2016) by combining lowland, lower montane and upper montane evergreen forests to represent forests on mineral soils. e) Observed deforestation and projected summed probability of forest loss on Borneo over time (2018–2032). This value represents the fraction of simulation runs in which the forest in a pixel was lost; i.e. if a pixel was selected to be deforestation in that time period in 50 out of 100 iterations, then it has a 50% probability of deforestation. Observed deforestation and the individual projection time steps are shown in Fig. S2.")
Projected deforestation probability and contextual layers across Borneo. a) Administrative boundaries of Indonesia, Malaysia and Brunei. The position of Borneo can be seen in the inlay. Brunei is excluded from maps b and e, as important predictors did not contain sufficient information for this country. b) Land-use within forested areas (PAs–Protected areas, ITP–industrial timber plantations, IOPP–Industrial oil palm plantations). c) Elevation was derived from a digital elevation model by (Jarvis et al., 2008), d) Forest types were derived from (Miettinen et al., 2016) by combining lowland, lower montane and upper montane evergreen forests to represent forests on mineral soils. e) Observed deforestation and projected summed probability of forest loss on Borneo over time (2018–2032). This value represents the fraction of simulation runs in which the forest in a pixel was lost; i.e. if a pixel was selected to be deforestation in that time period in 50 out of 100 iterations, then it has a 50% probability of deforestation. Observed deforestation and the individual projection time steps are shown in Fig. S2.
Protected areas experienced low levels of deforestation, with the lowest levels associated with strictly protected areas (Fig. 1). Logging concessions were associated with lower probability of forest loss, with the exception of concessions in South Kalimantan. Industrial timber and oil palm plantation concessions had similar levels of deforestation compared to areas without formal management. Although included in the best models, elevation, distance to roads or rivers, fire incidence and population density were weak deforestation predictors, with model effect sizes close to zero.
Model validationComparing the projected forest across Borneo for the calibration period with the observed forest, the overall prevalence of perfect matches was 94%, false positives (commission errors) was at 5%, and the prevalence of false negatives (omission errors) at 6%. When comparing the spatial match of projected deforestation with observed deforestation a median of 56% of the pixels were in the direct neighborhood (within 1 km), 79% within 2 km, and 99% within 10 km, of a pixel with observed forest loss, indicating spatial concordance (Table S3 and Fig. S1).
Spatio-temporal deforestation and projectionsBetween 2000 and 2017 forests on Borneo decreased by 59,949 km2, and by 2032 a further 74,419 km2 (95% confidence interval (CI) 74,023–75,157 km2) was projected to be lost—a 32% decrease since 2000 (Figs. 2 and 3, Table S4 and Fig. S3). Past annual deforestation rates, measured in percent forest lost relative to forest cover in 2000, ranged between 0–3% for all provinces, with high inter-annual fluctuations (Fig. 3b). Projected median annual deforestation rates (2018–2032) ranged between 0.55 and 1.72% (Fig. 2).
 The total forest in the first and last year of the observation period (2000–2017, red axis) and the median forest in the last projected five-year period (2028–2032, blue axis) for each province. Percent future forest loss from 2018 to 2032 is given above the bars (CI in Table S5). b) Aggregated average percent forest loss before simulation (2001–2012) and in the calibration period (2013–2017) (red bars with grey filling) was used for model fitting. The annual observed forest loss (red line with black dots) shows inter-annual variability of forest loss in the provinces. Deforestation was simulated for the calibration period and three five-year periods from 2018 to 2032 (blue bars, n = 100, error bars represent CI). The calibration period from 2013-2017 can be compared to the projection of forest loss in the same time interval (difference presented in Table S5). All values in b) given in annual percent loss of forest in 2000, by aggregating over the time-period over which the bar extends and dividing by number of years in interval.")
Observed and projected forest area and loss across Borneo from 2000 to 2032 a) The total forest in the first and last year of the observation period (2000–2017, red axis) and the median forest in the last projected five-year period (2028–2032, blue axis) for each province. Percent future forest loss from 2018 to 2032 is given above the bars (CI in Table S5). b) Aggregated average percent forest loss before simulation (2001–2012) and in the calibration period (2013–2017) (red bars with grey filling) was used for model fitting. The annual observed forest loss (red line with black dots) shows inter-annual variability of forest loss in the provinces. Deforestation was simulated for the calibration period and three five-year periods from 2018 to 2032 (blue bars, n = 100, error bars represent CI). The calibration period from 2013-2017 can be compared to the projection of forest loss in the same time interval (difference presented in Table S5). All values in b) given in annual percent loss of forest in 2000, by aggregating over the time-period over which the bar extends and dividing by number of years in interval.
At the provincial level, projected loss of forest area ranged from 10% in North Kalimantan to 29% in Central Kalimantan in comparison to forest in 2017 (Figs. 3b and Table S4). Deforestation trends tended to vary among provinces because of differences in drivers and their relationship with deforestation, as well as the distribution of clusters with high deforestation probabilities (Fig. 2e and Fig. 3a). In all provinces the projected median deforestation rate was within the range of the observed annual rates, indicating a good fit of projections.
Across provinces, protected and high-elevation areas had a high probability of maintaining forest cover until 2032 (Fig. 2). Lowland forests, those within industrial timber and oil palm plantations, and forests without protection or concession status, were all associated with a low probability of maintaining forest cover and a high vulnerability to future deforestation.
Orangutan vulnerability in provincesMedium to high (>0.5 in./km2) orangutan abundances are concentrated in the protected lowlands and peatswamp forests in West, Central and East Kalimantan as well as the forests at higher elevations along the border of West and Central Kalimantan (Fig. 4). In the unprotected lowland and peatswamp forests of West, Central and East Kalimantan high local orangutan abundances (>2 in./km2) coincide with high risk of deforestation (i.e. summed probability of projected deforestation ≥ 67%). In contrast, areas with medium to high orangutan abundance in the central part of West and Central Kalimantan at higher elevations had low deforestation probability (<33%) (Fig. 4a). Although fewer orangutans occur in Sabah and Sarawak compared to other provinces, most are projected to experience low levels of forest loss (Fig. 4 and Fig. S4). In these two states only 9% (Sabah) and <1% (Sarawak) of orangutans occurred in areas with high deforestation probabilities. Conversely, in West, Central and East Kalimantan 27%, 23% and 15% of all orangutans were in areas with high deforestation probabilities (Fig. S4). Orangutans are only present in very low numbers or entirely absent from North and South Kalimantan.
. Darker colors identify higher levels of orangutan density and summed probability of projected deforestation. b) Forest of strict, sustainable use, and national protected areas were aggregated to a single category. Similarly, industrial timber and oil palm plantations concessions were combined into a single industrial plantation concession class. The proportion of orangutans in areas with low, medium or high levels of forest loss (pie charts, red shades only) and total projected loss of orangutans until 2032 (number in each panel) differed between land-use classes. Numbers shown are rounded to the nearest 100. Only pixels that were forested in 2017 and that have an estimated density of >0.001 orangutans/km2 are represented.")
Density distribution of orangutans and summed probability of projected deforestation in land-use areas until 2032. Orangutan density is indicated by blue shades and the probability of deforestation by red shades (individual maps in Fig. S3). Darker colors identify higher levels of orangutan density and summed probability of projected deforestation. b) Forest of strict, sustainable use, and national protected areas were aggregated to a single category. Similarly, industrial timber and oil palm plantations concessions were combined into a single industrial plantation concession class. The proportion of orangutans in areas with low, medium or high levels of forest loss (pie charts, red shades only) and total projected loss of orangutans until 2032 (number in each panel) differed between land-use classes. Numbers shown are rounded to the nearest 100. Only pixels that were forested in 2017 and that have an estimated density of >0.001 orangutans/km2 are represented.
Orangutans within protected areas and logging concessions were found to be less vulnerable to deforestation than orangutans in industrial plantations and in areas without management. Overall, forests in protected areas and logging concessions harbored 68% (CI: 65–70%) of all orangutans estimated to occur on Borneo in 2018. Most of these orangutans inhabited forests with low deforestation probabilities: 62% (CI: 52–72%) of all orangutans within protected areas and 96% (CI: 95–97%) within logging concessions (Fig. S5). Nevertheless, deforestation was projected to affect 7000 (CI: 4400–9800) orangutans in protected areas and 3700 (CI: 2600–4600) orangutans in logging concessions.
Conversely, a large percentage of the orangutans inhabiting forests allocated for industrial plantations depended on habitat that was highly susceptible to deforestation. Combined these could affect 7100 orangutans (CI: 5400–9700), representing 27% (CI: 25–31%) of the loss of orangutans on Borneo.
Areas without formal management supported 19% (CI: 18–21%) of all orangutans in Borneo, and much of these were at high risk of deforestation according to projections affecting 8300 (CI: 6200–11,100) orangutans (32% [CI: 31–32%] of all loss). Those areas with high vulnerability also harbored high orangutan densities, notably around the Sabangau peatlands in Central Kalimantan and in the Lesan-Wehea landscape in East Kalimantan (Fig. S6).
DiscussionWildlife management is informed by our knowledge about drivers of population declines and our ability to anticipate which measures could effectively curb those losses. For many tropical species, including orangutans, such declines are strongly linked with deforestation. Our modelling of deforestation trends revealed that the forests of Borneo are projected to decline by a further 19% by 2032. Annual deforestation was projected to occur at a rate of 1.54%, which is similar to that experienced in Sumatra since 2001 (Gaveau et al., 2022), but higher than that reported from central Indonesia (1.23% between 2019–2053, Voigt et al. (2021)).
Protected areas and logging concessions are associated with the lowest deforestation risk to the sizeable orangutan populations remaining in these areas, in line with previous research on Borneo (Gaveau et al., 2013; Voigt et al., 2018). Our findings reinforce the value of well-managed logging concessions for biodiversity and the need to control habitat degradation within these forests, as well as preventing conversion and avoiding their degazettement after logging stops (Burivalova et al., 2020).
Furthermore, our analysis implies that the largest immediate conservation gains can be made by effectively curbing deforestation in and around plantation landscapes and forests with no formal land-use designation. In these forests around 81% (CI: 78–85%) of orangutan inhabitants could be lost otherwise. Sustainability certification schemes, corporate zero-deforestation pledges, moratoria and ecosystem restoration concessions can slow deforestation in areas slated for conversion and are gaining traction in orangutan-range countries (Astari and Lovett, 2019; Rizal et al., 2021; Sills et al., 2014) and the oil palm sector (https://rspo.org/news-and-events/news/uniting-to-deliver-deforestationfree-sustainable-palm-oil-more-critical-than-ever). Forest patches retained in plantations can provide valuable habitat for wildlife, including orangutans (Deere et al., 2020), although the greatest gains will come from companies not clearing any new forest areas in the first place. The implementation of such tools are thus useful to avoid loss of valuable orangutan habitat and maintain connectivity of forest areas within plantations, mitigating the projected impacts on orangutans in the future (Meijaard et al., 2017).
Modelling uncertainties, caveats and future developmentWith the presented deforestation projections, we created a business-as-usual baseline against which future developments in the Bornean orangutan range can be compared. Although it is likely that the deforestation in coming years is shaped by similar large- and regional-scale drivers than the deforestation in the recent past, it cannot be assumed that future dynamics will perfectly mirror the past, especially when extending beyond the period of 15 years for which we have projected deforestation here.
To manage for this uncertainty, a range of scenarios could explore potential future global-scale changes in resource demand and developments, such as investment in infrastructure projects, further agricultural expansion and the implementation and effectiveness of deforestation mitigation measures. The regional-scale deforestation model could be combined with national or global scale econometric models (Busch and Ferretti-Gallon, 2017) that could incorporate drivers such as resource demand. However, as of yet the mechanisms of how these drivers influence deforestation patterns are not yet well established and the data to parameterize such models or scenarios at the scale of Borneo are not freely available. Additionally, changes in political agendas and development priorities (e.g., Ferrante and Fearnside, 2019), fluctuation of commodity prices for important agricultural products (Gaveau et al., 2019), global climate or spurious occurrences such as extreme weather events, political unrest or the socio-economic effects of the global COVID-19 pandemic and resulting impacts on forests (Brancalion et al., 2020) are difficult to anticipate and thus directly include in any model. Different scenarios could be more easily compiled at the local scale, where relevant stakeholders could co-develop potential pathways for their landscapes, and explore expected outcomes. In this study we could show that drivers and patterns of deforestation vary for the different provinces, thus highlighting the potential for models that are tailored to the local context to project future change.
Orangutans are not only threatened by deforestation, but also suffer considerable declines through hunting, killing in conflict situations and live capture. These threats often remain hidden and are governed by complex socio-economic drivers that remain poorly understood and mapped (Meijaard et al., 2011). This makes it challenging to model the contribution of this threat to orangutan vulnerability. The projected orangutan losses thus only represent a proportion of potential future population declines and no-killing policies are an essential cornerstone of any conservation approach to succeed at stopping orangutan loss.
Implications for conservationWe showcased how information on deforestation risk and wildlife density can be combined to draw insights into conservation threats and vulnerability assessment. The information where a reduction in deforestation risk would lead to largest increases in species protection could be used to direct orangutan conservation efforts, for example by contributing to Population and Habitat Viability Assessments (Utami-Atmoko et al., 2019), national orangutan conservation action plans (Ministry of Environment and Forestry, 2019) or influencing funding across the species range. In the future, scenario analysis considering changes in resource demand, planned development efforts or conservation management, for example, could help to improve landscape-scale planning with largest benefits for orangutan conservation.
Furthermore, methods that facilitate abundance estimates over large spatial scales, such as integrated modelling that can harness a wider range of data (Bowler et al., 2019) could make abundance estimates more readily available for more elusive or less-well studied species. Valuable information can also be gleaned from inspecting deforestation risk within species ranges or in combination with occurrence probabilities (e.g., Boitani et al., 2011). This would enable the assessment of more general effects of future forest loss on tropical fauna.
Our findings demonstrate that we have a window of opportunity to curb deforestation and its impacts on biodiversity, while highlighting the consequences if we fail to do so. In the context of extensive and rapid changes of land-use, land-cover and climate in this century, increasing efforts to further such approaches and to translate them into effective conservation actions are urgently needed to halt wildlife decline in biodiversity hotspots such as Borneo. Ideally, conservation actions now should not only attempt to act on today's information about deforestation patterns, but also be adaptive to potential changes in drivers and threats.
Declaration of interestsThe authors declare no competing interests.
CRediT authorship contribution statementMaria Voigt: Conceptualization, Methodology, Software, Validation, Formal analysis, Data curation, Writing – original draft, Writing – review & editing. Hjalmar S. Kühl: Conceptualization, Writing – review & editing, Supervision. Marc Ancrenaz: Conceptualization, Writing – review & editing. David Gaveau: Resources, Writing – review & editing. Erik Meijaard: Conceptualization, Writing – review & editing. Truly Santika: Resources, Writing – review & editing. Julie Sherman: Conceptualization, Writing – review & editing. Serge A. Wich: Conceptualization, Writing – review & editing. Florian Wolf: Methodology, Software, Writing – review & editing. Matthew J. Struebig: Conceptualization, Writing – review & editing. Henrique M. Pereira: Conceptualization, Methodology, Writing – review & editing, Supervision. Isabel M.D. Rosa: Conceptualization, Methodology, Software, Validation, Writing – review & editing, Supervision.
M.V. thanks Sergio Maroccoli and Ana D. de Lima Voigt for comments on early versions of this manuscript. M.V. and H.K thank the Max Planck Society and Robert Bosch Foundation for funding and support. M.V. was also funded by the UK Leverhulme Trust via a Research Leadership Award granted to M.J.S.
The following is Supplementary data to this article:

