
Urbanization alters the landscape through the replacement of natural vegetation by impervious surfaces, probably inducing changes in interspecific bird color diversity and composition. However, the seasonal changes of bird color diversity and composition along urban-rural gradients have not been analyzed yet. The objective of this study was to analyze the seasonal variation of bird color diversity and composition of bird assemblages along urban-rural gradients of three cities in central Argentina. Bird surveys were made in urban, suburban and rural areas during the breeding and non-breeding seasons. Color description was obtained from the literature. Color diversity and the seasonal color dissimilarity were calculated using the mean pairwise distance functional index. Null models that control for species richness were used to estimate standardized effect sizes (SES). Color diversity increased during the breeding season. However, the SES of color diversity did not change between seasons. Color diversity and the SES of color diversity were higher in rural areas than in urban habitats. The color seasonal dissimilarity was the lowest in urban habitats. City size was negatively related to the color seasonal dissimilarity in urban and suburban habitats. Species with brown, black and dimorphic plumages showed seasonal changes in their abundances in rural habitats, whereas plumage colors in urban habitats remained stable between seasons. The results showed that bird color diversity increase during the breeding season, but this increase is related to the arrival of more species during the breeding season to rural areas. Urban areas showed a seasonal homogenization of bird colors.
Urbanization alters bird communities throughout several factors such as habitat loss, fragmentation, pollution, and changes in species interactions (Grimm et al., 2008; Shanahan et al., 2014). On one hand, species diversity declines in urban core areas (Manhães and Loures-Ribeiro, 2005; Clergeau et al., 2006; Ortega-Álvarez and MacGregor-Fors, 2009; Villegas and Garitano-Zavala, 2010; Faeth et al. 2011; Reis et al., 2012; Silva et al., 2015; Leveau et al., 2017a, b). On the other hand, species inhabiting urban areas are filtered assemblages from the regional species pool (Croci et al., 2008; Reis et al., 2012; Silva et al., 2016; La Sorte et al., 2018; Hensley et al., 2019; Leveau, 2021a). Species that have an omnivorous diet and foraging on the vegetation seems to be frequent in urban areas (Pena et al., 2017; La Sorte et al., 2018; Patankar et al., 2021; Leveau, 2021b).
The environmental changes caused by urbanization can also filter bird species according other traits, such as plumage color. For example, the replacement of vegetation by impervious grey surfaces may favor the occurrence of bird species with grey plumage, which can enhance their camouflage and avoid predation (Delhey, 2018; Leveau, 2019a). On the other hand, species diversity has been positively related to bird color diversity (Dalrymple et al., 2018).
Temperate areas show a marked seasonal change of resources, generally increasing food resources for birds during spring and summer (Hurlbert and Haskell 2003). The arrival of migrant species and the start of the breeding season may influence changes in the color diversity and composition of bird assemblages. Furthermore, intraspecific interactions such as courtship during the breeding season may be related to the presence of dimorphic plumage colors. However, the seasonal changes of color diversity and composition remain to be explored.
Urban areas are characterized by a seasonal buffering of environmental conditions (Shochat et al. 2006; Leveau, 2018), which in turn induces a seasonal homogenization of bird species composition (Caula et al., 2008; La Sorte et al., 2014; Leveau et al., 2015, 2021). Therefore, urban areas may stabilize the seasonal changes of bird plumage color composition, favoring the presence of grey birds along the year.
The objective of this study was to analyze the seasonal change of bird plumage color diversity and composition along three urban-rural gradients in central Argentina. Due to bird color diversity may increase between seasons because of increased bird species richness (Dalrymple et al., 2018), null models that controlled for differences in species richness were employed. An increase of bird color diversity was expected during the breeding season, and this increase is expected to be more pronounced in rural areas. Furthermore, color composition is expected to be stable between seasons in urban areas and more variable in rural areas. Finally, the effect of city population size on color diversity was analyzed (Leveau, 2019a).
MethodsStudy areaThe study was carried out in three cities of central Argentina: Mar del Plata (615 350 inhabitants, 38° 00′ S; 57° 33′ W), Balcarce (38 823 inhabitants, 37° 50′ S; 58° 15′ W) and Miramar (29,629 inhabitants, 38° 16′ S; 57° 50′ W) (2010 National census) (see Leveau, 2019b). Cities were located at a maximum distance of 59 km between them; therefore, the effects of latitude or climate were minimal. The annual mean temperature in the region is 14 °C and the mean annual rainfall is 924 mm. The mean monthly temperature is minimum during July (8.1 °C, austral winter) and maximum during January (20.3 °C, austral summer). Precipitation is minimal during June (54.9 mm) and maximum during March (107 mm) (data from the Meteorological National Service). The cities were surrounded by crop fields, pastures, and a few small fragments of native grasslands.
Bird surveysBird surveys were conducted in three habitat types: (1) urban, dominated by buildings and the main commercial and historical part of the city; (2) suburban, composed of detached houses with yards; and (3) rural, characterized by the presence of crops and pastures (see Leveau, 2019b). These three habitats were located in the three cities. In each habitat of each city, five 100 × 50-m transects were placed separated by at least 200 m from each other. Surveys were carried out during the 2011–2012 and 2012–2013 breeding seasons (austral spring-summer), and the 2011 and 2012 non-breeding seasons (austral autumn-winter). During each year, two visits were made to transects, totaling four visits during each season. Surveys were carried out in the first 4 h after dawn on days without rain or strong winds, and all birds seen or heard were counted, except those flying over the top of buildings or trees, or below that height but showing no feeding activity.
Bird colorationBird species coloration was taken from plumage description, plates and photographs from the Handbook of the Birds of the World Alive (https://www.hbw.com) and from the Aves Argentinas free mobile phone application, both consulted during January 2019 (see Leveau, 2019a). Color types were taken from 12 patches of bird body (Table S1): (1) crown, (2) head, (3) cheek, (4) mantle, (5) primaries, (6) wing coverts, (7) back, (8) rump, (9) tail, (10) belly, (11) breast, and (12) throat. When the rump color description was not available, it was replaced with photographs from Google. In the case of body patches that had two colors, a binary category was created where the first color was the dominant. For instance, due to the primaries of the European Greenfinch (Chloris chloris) were predominantly green with some yellow, they were characterized as grey_yellow. Moreover, other plumage characteristics such as sexual dimorphism, polymorphism, and the percentage of iridescent plumage were considered (see Leveau, 2019a, Table S1).
Color diversityA matrix of bird species as rows and bird plumage characteristics as columns was created. This matrix was used to calculate species dissimilarities using the Gower distance because the data traits were categorical, binary and numerical. The function gowdis of the FD package in R was used (Laliberté et al., 2014; R Core Team, 2017). The dissimilarity matrix and the matrix with species as columns and transects as rows were used to calculate the mean pairwise distance (mpd) of bird species colors in each transect. Due to this metric can be influenced by the species richness, a standardized effect size (SES mpd) for each transect was calculated using the “richness” null model with 999 randomizations. These metrics were obtained with the function ses.mpd of the picante package (Kembel et al., 2010). The mean abundance of each species during the four visits in each transect was took into account in these analyses.
The seasonal change of bird colors in each transect was calculated using comdist function of the picante package (Kembel et al., 2010).The comdist function uses the dissimilarity matrix of species colors and the bird community matrix to calculate a mean pairwise distance in breeding and non-breeding communities for each transect. Moreover, the seasonal dissimilarity in bird colors for each transect was measured taking into account differences in species richness with the scripts provided in Swenson (2014) and the functions comdist and randomizeMatrix of picante package (Kembel et al., 2010). The seasonal dissimilarity index was calculated taking into account the abundance data of species. The mean pairwise distance of communities in breeding and non-breeding seasons was compared with null values using the “richness” null model through 999 randomizations. Therefore, the standardized effect sizes of the mean pairwise dissimilarity between seasons, hereafter SES of color seasonal dissimilarity, were obtained for each transect. Values close to 0 indicate that dissimilarities are random, values <0 indicate that dissimilarities are lower than expected by chance, and values >0 indicate that dissimilarities are higher than expected by chance. Values higher than 1.96 or lower than −1.96 are considered significant deviations from the null model (P < 0.05) (Swenson, 2014).
The variation of color composition between habitats and seasons was analyzed by calculating the community-level weighted mean (CWM) of trait values. The CWM was calculated for each transect with the dbFD function of the FD package (Laliberté et al., 2014). For each species, a dominant color was calculated as the color present in most of the bird parts characterized in Table S1 (see Table S2). Only those traits that were characterized by two or more common species were analyzed. Therefore, color traits such as plumage pink_purple or polymorphic characterized by the Picazuro Pigeon (Patagioenas picazuro) and the Rock Dove (Columba livia), respectively, were not analyzed. In short, the CWM were calculated for the dominant color for each species, dimorphism and iridescent plumage (see Table S2).
Statistical analysisThe variation of bird color diversity and CWM trait values between habitats and seasons were analyzed through generalized linear mixed models (GLMMs). A Gaussian distribution of errors was used. The mpd and the SES mpd were the response variables, whereas habitats, seasons and city population size were explanatory variables. Habitats and seasons were categorical variables, whereas city population size was a continuous variable. City population size was the number of inhabitants of each city and was rescaled between 0 and 1 with the rescale function of the scales package in R (R Core Team, 2017). Models analyzed the effects of each categorical variable and the interaction of both on bird color diversity. Therefore, the interaction between habitat and season and the interaction between habitat and city population size were explored. This study had a hierarchical design in which transects were clustered within each city, implying spatial pseudoreplication. Moreover, transects were visited twice during each season, implying temporal pseudoreplication. Therefore, a random structure with transects nested within city was used to control for spatial and temporal pseudoreplication.
The relationship between the seasonal dissimilarity of bird colors, habitats and city population size was analyzed through GLMMs. A Gaussian distribution of errors was used. The seasonal color dissimilarity and the SES of color seasonal dissimilarity were response variables, whereas habitats and city population size were explanatory variables. The interaction between habitat and city population size influencing color seasonal dissimilarity was analyzed. A random structure with transects nested within city was used to control for spatial pseudoreplication.
GLMMs were performed with the function lme of the nlme package (Pinheiro et al., 2017). Models were obtained by backward elimination of non-significant variables (P > 0.05) from the full model using the anova function. Final models were compared with null models using a Likelihood Ratio test (LRT test) (P < 0.05). Differences of means between habitats were explored with Tukey tests using the function glht of the multcomp package (Hothorn et al., 2016). The homoscedasticity of residuals was explored. In the cases of heteroscedasticity, the varIdent variance structure was used to improve residuals structure.
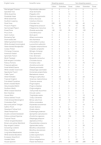
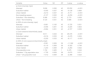
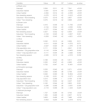
ResultsA total of 59 species and 5310 contacts were recorded. The House Sparrow (Passer domesticus), the Rock Dove (Columba livia) and the Eared Dove (Zenaida auriculata) were the most abundant species (Table 1).
Species abundances during the breeding and non-breeding seasons along the urban-rural gradients of central Argentina.
| English name | Scientific name | Breeding season | Non-breeding season | ||||
|---|---|---|---|---|---|---|---|
| Urban | Suburban | Rural | Urban | Suburban | Rural | ||
| Red-winged Tinamou | Rhynchotus rufescens | 0 | 0 | 2 | 0 | 0 | 0 |
| Speckled Teal | Anas flavirostris | 0 | 0 | 0 | 0 | 0 | 2 |
| White-faced Ibis | Plegadis chihi | 0 | 0 | 10 | 0 | 0 | 0 |
| Roadside Hawk | Rupornis magnirostris | 0 | 0 | 0 | 0 | 2 | 1 |
| White-tailed Kite | Elanus leucurus | 0 | 0 | 1 | 0 | 0 | 1 |
| Southern Lapwing | Vanellus chilensis | 0 | 2 | 12 | 0 | 0 | 7 |
| Rock Dove | Columba livia | 220 | 45 | 0 | 282 | 45 | 0 |
| Picazuro Pigeon | Patagioenas picazuro | 6 | 94 | 19 | 10 | 80 | 12 |
| Spot-winged Pigeon | Patagioenas maculosa | 15 | 15 | 5 | 27 | 39 | 8 |
| Eared Dove | Zenaida auriculata | 140 | 130 | 29 | 88 | 102 | 6 |
| Picui Dove | Columbina picui | 0 | 5 | 0 | 0 | 0 | 0 |
| Guira Cuckoo | Guira guira | 0 | 2 | 4 | 0 | 0 | 1 |
| Burrowing Owl | Athene cunicularia | 0 | 0 | 6 | 0 | 0 | 2 |
| Short-eared Owl | Asio flammeus | 0 | 0 | 3 | 0 | 0 | 2 |
| Glittering-bellied Emerald | Chlorostilbon lucidus | 4 | 9 | 2 | 0 | 0 | 0 |
| White-throated Hummingbird | Leucochloris albicollis | 0 | 8 | 0 | 0 | 6 | 0 |
| Green-barred Woodpecker | Colaptes melanochloros | 0 | 5 | 1 | 0 | 3 | 1 |
| Campo Flicker | Colaptes campestris | 0 | 0 | 4 | 0 | 2 | 3 |
| Chimango Caracara | Milvago chimango | 5 | 6 | 8 | 12 | 8 | 8 |
| American Kestrel | Falco sparverius | 0 | 0 | 7 | 0 | 0 | 2 |
| Aplomado Falcon | Falco femoralis | 0 | 0 | 0 | 0 | 0 | 1 |
| Monk Parakeet | Myiopsitta monachus | 0 | 2 | 33 | 0 | 0 | 21 |
| Buff-winged Cinclodes | Cinclodes fuscus | 0 | 0 | 0 | 0 | 0 | 1 |
| Rufous Hornero | Furnarius rufus | 3 | 80 | 14 | 7 | 75 | 12 |
| Firewood-gatherer | Anumbius annumbi | 0 | 0 | 5 | 0 | 0 | 3 |
| Small-billed Elaenia | Elaenia parvirostris | 0 | 25 | 0 | 0 | 0 | 0 |
| White-crested Tyrannulet | Serpophaga subcristata | 0 | 4 | 0 | 0 | 4 | 0 |
| Spectacled Tyrant | Hymenops perspicillatus | 0 | 0 | 1 | 0 | 0 | 0 |
| Cattle Tyrant | Machetornis rixosus | 0 | 1 | 2 | 0 | 1 | 0 |
| Great Kiskadee | Pitangus sulphuratus | 3 | 25 | 2 | 2 | 23 | 6 |
| Tropical Kingbird | Tyrannus melancholicus | 1 | 19 | 12 | 0 | 0 | 0 |
| Fork-tailed Flycatcher | Tyrannus savana | 0 | 1 | 34 | 0 | 0 | 0 |
| Brown-chested Martin | Progne tapera | 0 | 0 | 1 | 0 | 0 | 0 |
| Grey-breasted Martin | Progne chalybea | 3 | 0 | 3 | 0 | 0 | 0 |
| Southern Martin | Progne elegans | 1 | 0 | 0 | 0 | 0 | 0 |
| White-rumped Swallow | Tachycineta leucorrhoa | 0 | 7 | 0 | 0 | 0 | 5 |
| Barn Swallow | Hirundo rustica | 7 | 4 | 9 | 0 | 0 | 0 |
| House Wren | Troglodytes aedon | 3 | 21 | 11 | 1 | 19 | 14 |
| Rufous-bellied Thrush | Turdus rufiventris | 6 | 40 | 0 | 4 | 62 | 0 |
| Chalk-browed Mockingbird | Mimus saturninus | 2 | 35 | 18 | 1 | 39 | 29 |
| Correndera Pipit | Anthus correndera | 0 | 0 | 17 | 0 | 0 | 11 |
| Blue-and-yellow Tanager | Pipraeidea bonariensis | 0 | 5 | 0 | 0 | 16 | 0 |
| Saffron Finch | Sicalis flaveola | 0 | 13 | 2 | 0 | 5 | 0 |
| Grassland Yellow-finch | Sicalis luteola | 0 | 0 | 55 | 0 | 0 | 14 |
| Great Pampa-finch | Embernagra platensis | 0 | 0 | 4 | 0 | 0 | 4 |
| Double-collared Seedeater | Sporophila caerulescens | 0 | 2 | 16 | 0 | 0 | 0 |
| Rufous-collared Sparrow | Zonotrichia capensis | 5 | 29 | 100 | 1 | 55 | 86 |
| Tropical Parula | Setophaga pitiayumi | 0 | 1 | 0 | 1 | 1 | 0 |
| Yellow-winged Blackbird | Agelasticus thilius | 0 | 0 | 2 | 0 | 0 | 0 |
| Brown-and-yellow Marshbird | Pseudoleistes virescens | 0 | 0 | 1 | 0 | 0 | 0 |
| Bay-winged Cowbird | Agelaioides badius | 0 | 9 | 11 | 0 | 39 | 1 |
| Screaming Cowbird | Molothrus rufoaxillaris | 0 | 2 | 0 | 0 | 0 | 0 |
| Shiny Cowbird | Molothrus bonariensis | 2 | 29 | 16 | 0 | 11 | 0 |
| Long-tailed Meadowlark | Leistes loyca | 0 | 0 | 3 | 0 | 0 | 3 |
| White-browed Blackbird | Leistes superciliaris | 0 | 0 | 1 | 0 | 0 | 0 |
| European Greenfinch | Chloris chloris | 1 | 7 | 3 | 0 | 3 | 0 |
| Hooded Siskin | Spinus magellanicus | 1 | 10 | 3 | 10 | 10 | 0 |
| House Sparrow | Passer domesticus | 274 | 275 | 39 | 285 | 298 | 24 |
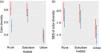
Color diversity varied between habitats and seasons (LRT = 59.93, P < 0.001; Table 2a; Fig. 1a). Color diversity was lower in urban habitats than in suburban and rural habitats (Tukey test, P < 0.05). Moreover, color diversity increased during the breeding season (Fig. 1a). The SES of color diversity did not vary between seasons but was higher in rural than in urban habitats (LRT = 6.77, P = 0.034; Tukey test, P < 0.05; Table 2b; Fig. 1b).
Final generalized linear mixed models showing the relationships between (a) color diversity, (b) SES of color diversity, (c) color seasonal dissimilarity, (d) SES of color seasonal dissimilarity and habitat types during breeding and non-breeding seasons in central Argentina. SE: standard error; DF: degrees of freedom; mpd: mean pairwise distance. * denotes an interaction between predictors.
| Variable | Value | SE | DF | t-value | p-value |
|---|---|---|---|---|---|
| a) Color diversity (mpd) | |||||
| Intercept | 0.606 | 0.026 | 42 | 23.252 | <0.001 |
| Suburban habitat | −0.005 | 0.037 | 40 | −0.128 | 0.899 |
| Urban habitat | −0.210 | 0.037 | 40 | −5.711 | <0.001 |
| Non-breeding season | −0.137 | 0.022 | 42 | −6.259 | <0.001 |
| Suburban * Non-breeding | 0.086 | 0.031 | 42 | 2.770 | 0.008 |
| Urban * Non-breeding | 0.120 | 0.031 | 42 | 3.886 | <0.001 |
| b) SES of color diversity (mpd) | |||||
| Intercept | −0.681 | 0.183 | 45 | −3.725 | 0.001 |
| Suburban habitat | −0.056 | 0.251 | 40 | −0.224 | 0.824 |
| Urban habitat | −0.684 | 0.251 | 40 | −2.727 | 0.009 |
| c) Color seasonal dissimilarity (mpd) | |||||
| Intercept | 0.611 | 0.023 | 40 | 26.476 | <0.001 |
| Suburban habitat | −0.016 | 0.033 | 40 | −0.479 | 0.634 |
| Urban habitat | −0.200 | 0.033 | 40 | −6.117 | <0.001 |
| d) SES of color seasonal dissimilarity (mpd) | |||||
| Intercept | −3.061 | 0.269 | 38 | −11.392 | <0.001 |
| Suburban habitat | −0.119 | 0.369 | 38 | −0.323 | 0.749 |
| Urban habitat | −1.203 | 0.369 | 38 | −3.263 | 0.002 |
| City population size | 1.152 | 0.465 | 1 | 2.476 | 0.244 |
| Suburban * City population size | −1.705 | 0.639 | 38 | −2.670 | 0.011 |
| Urban * City population size | −1.512 | 0.639 | 38 | −2.368 | 0.023 |
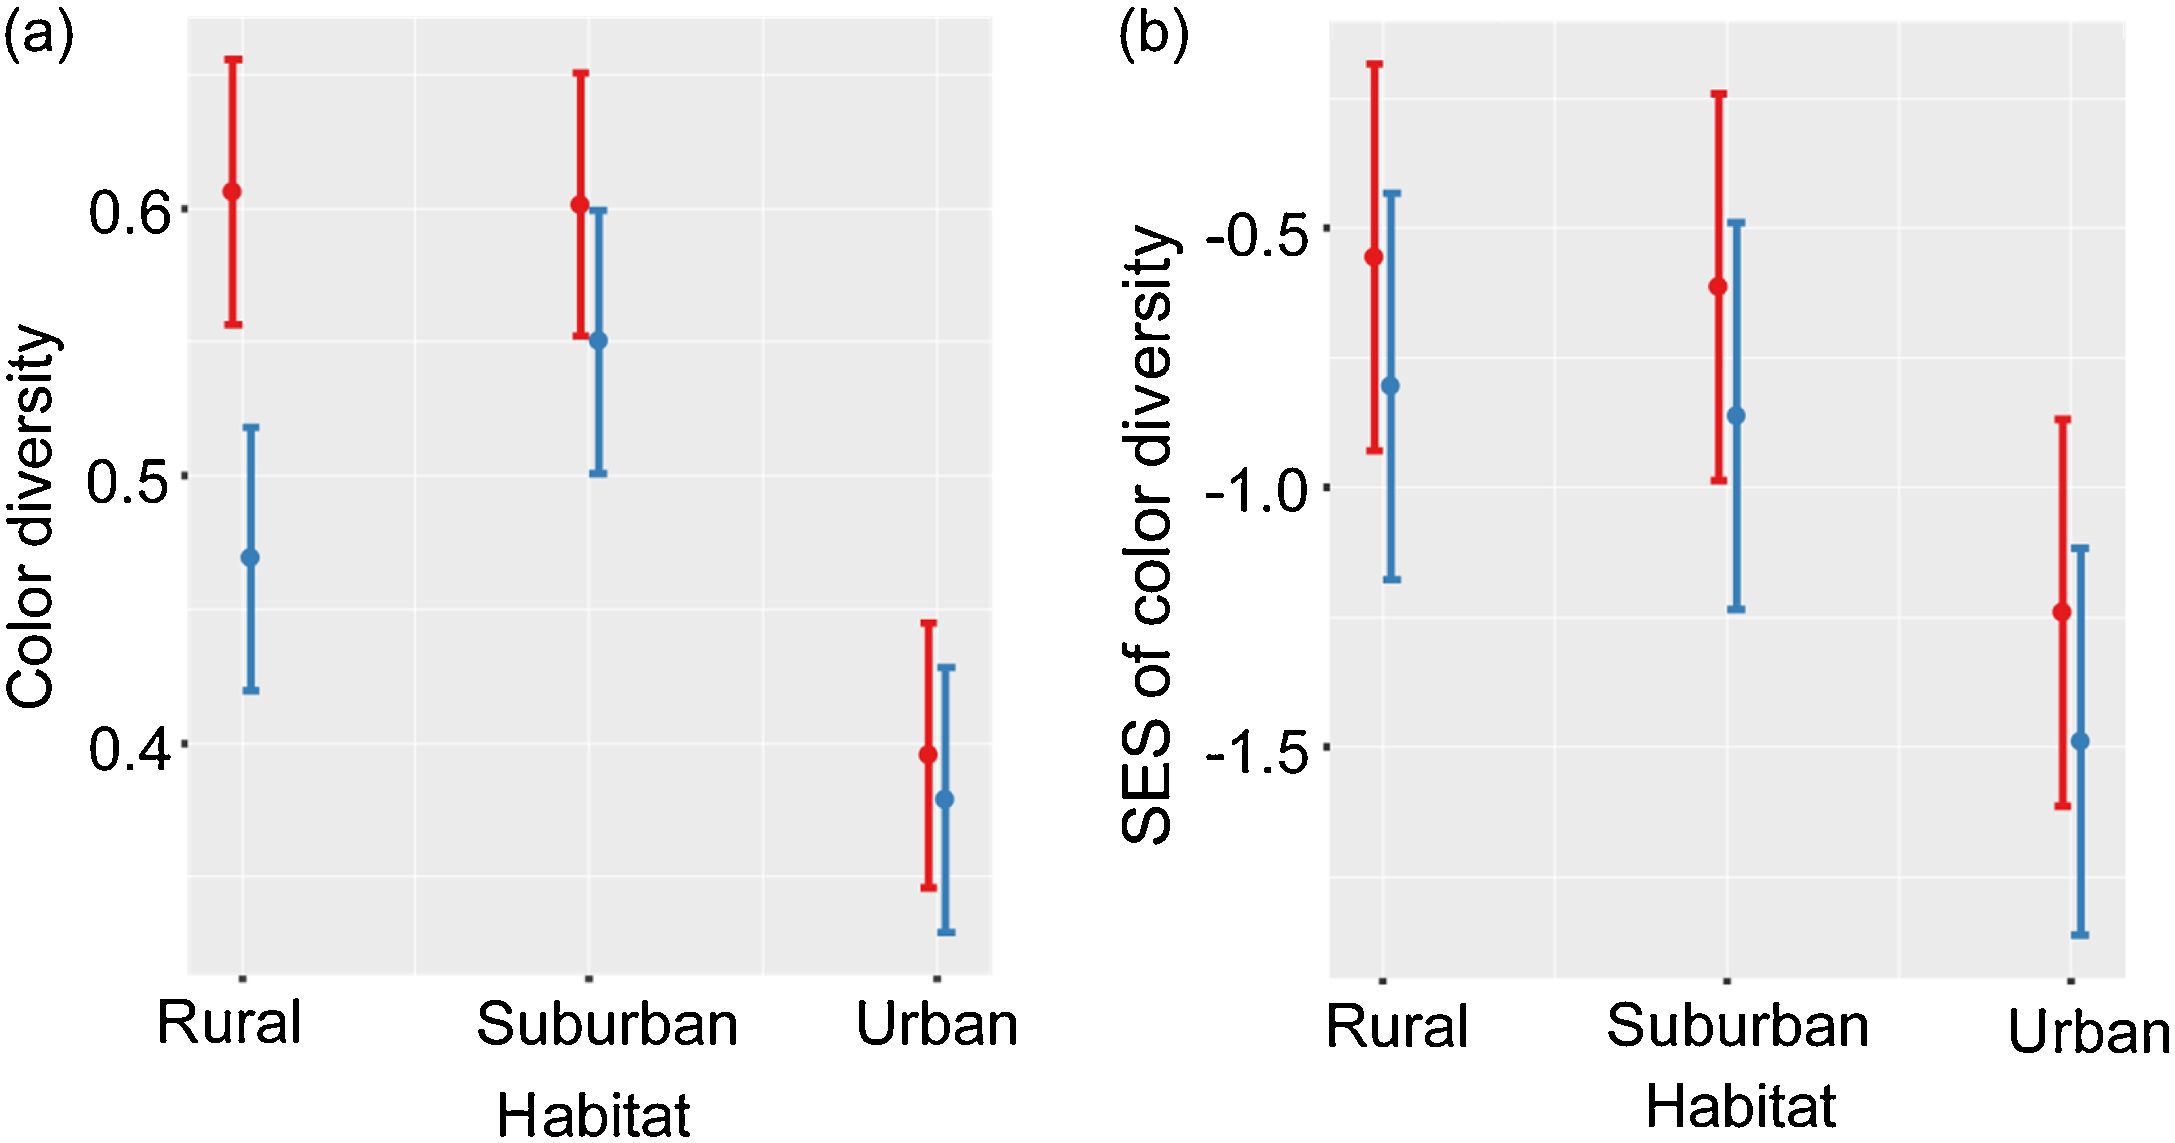
Color diversity (a) and SES of color diversity (b) variation during breeding (red) and non-breeding (blue) seasons along urban-rural gradients. SES, standardized effect size; values higher than zero indicate a greater diversity than expected by the null model, whereas values lower than zero indicate lower diversity than expected by the null model. Points are means, and vertical lines are confidence intervals.
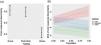
The seasonal changes of color composition varied between habitats (LRT = 33.43, P < 0.001; Table 2c; Fig. 2a). The seasonal change of color composition was lower in urban than in suburban and rural habitats (Tukey test, P < 0.05). The SES of the seasonal change of color composition were negative in the three habitats, suggesting that the seasonal variation of colors was lower than expected by chance (Fig. 2b). The SES of the seasonal change of color composition was lower in urban habitats than in suburban and rural habitats (Tukey test, P < 0.05), and the relation between the seasonal change of color composition and city population size varied with habitat type (LRT = 32.65, P < 0.001; Table 2d; Fig. 2b). In urban and suburban habitats the seasonal change of colors decreased with increasing city population size, whereas in rural habitats was observed the opposed trend.
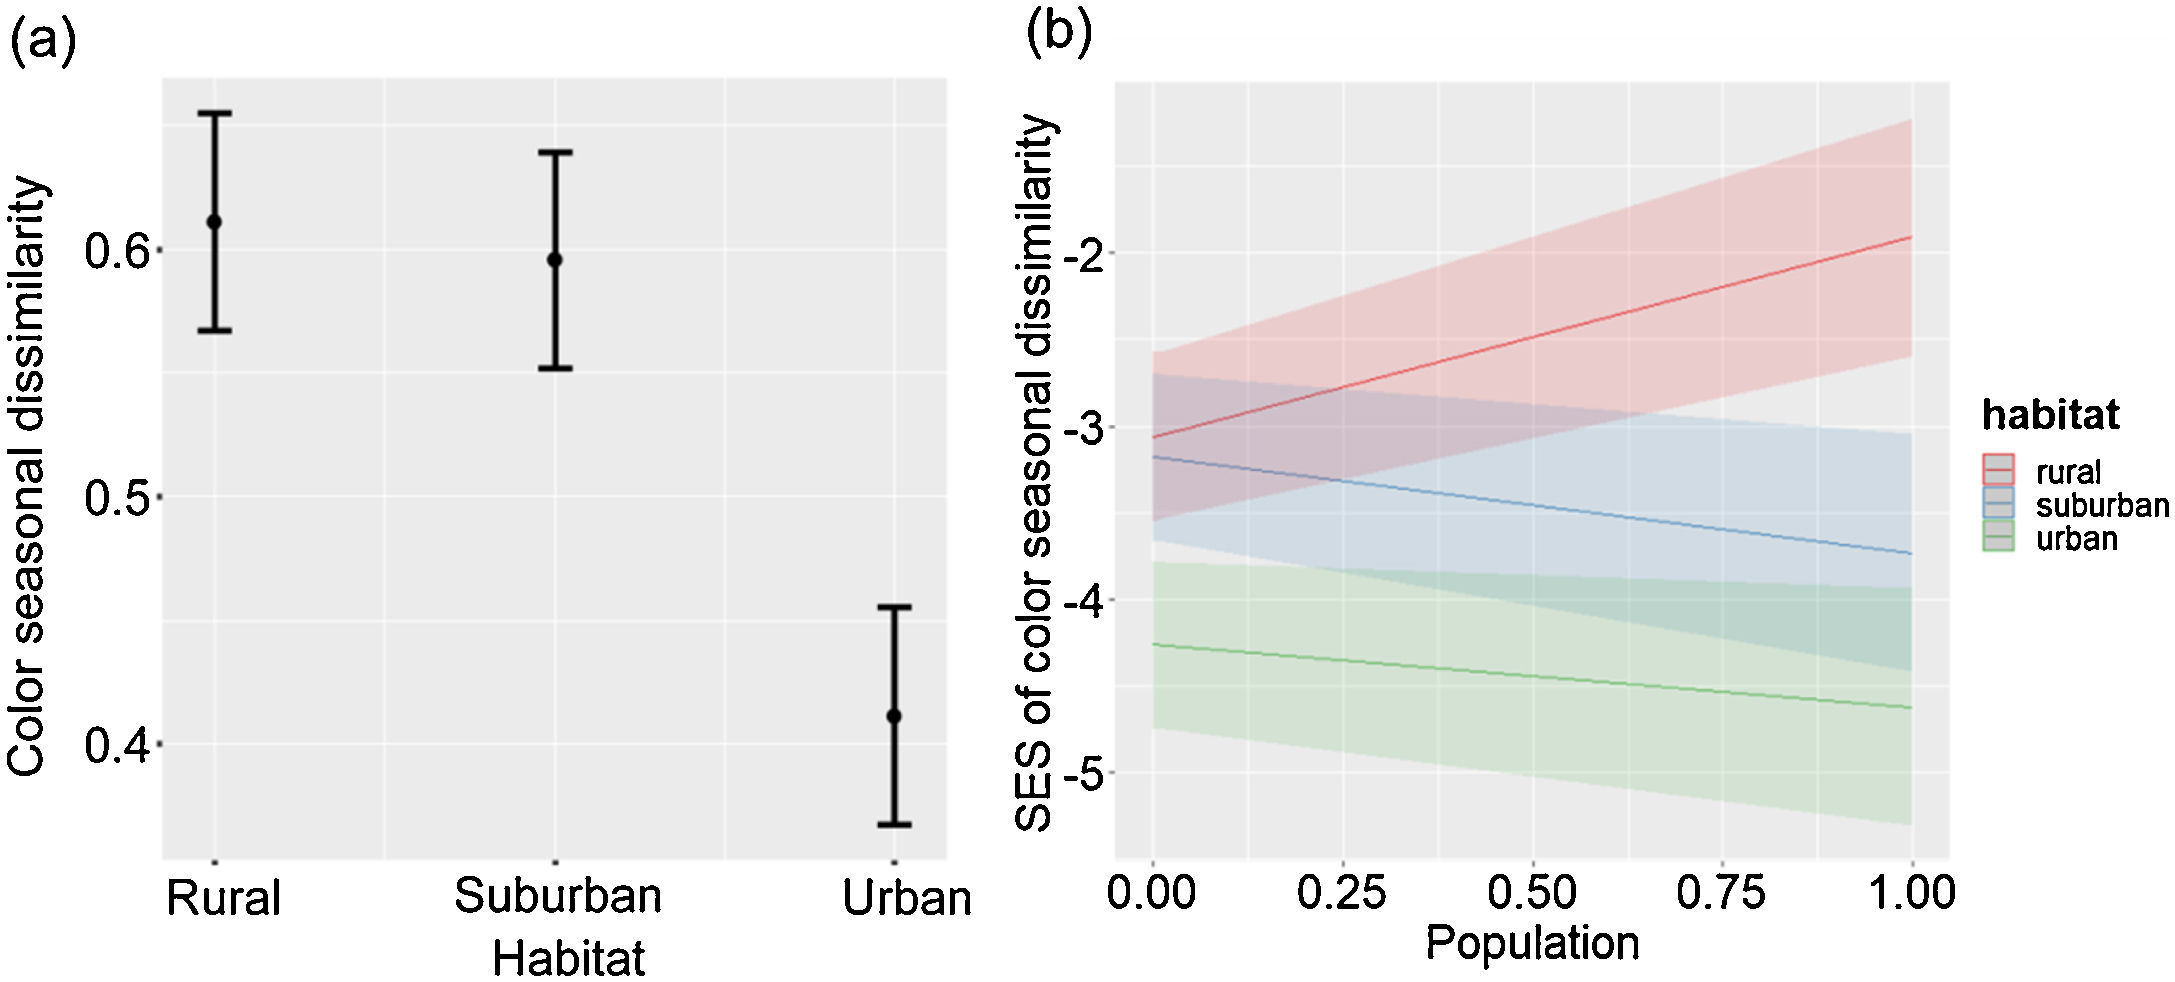
Color seasonal dissimilarity (a) and SES of color seasonal dissimilarity (b) along urban-rural gradients. SES, standardized effect size; values higher than zero indicate a greater diversity than expected by the null model, whereas values lower than zero indicate lower diversity than expected by the null model. In (a), points are means, and vertical lines are confident intervals. In (b), lines are fitted lines and shaded areas are confidence intervals. City population size was rescaled between 0 and 1.
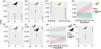
The CWMs of black, brown, grey, olive, dimorphic and iridescent plumages showed significant variations between habitats or seasons (Table 3). The CWMs of blue and green plumage colors showed no significant variations between habitats or seasons (LRT = 1.51, P = 0.471; LRT = 3.30, P = 0.192, respectively). Black, brown and dimorphic plumages showed a significant interaction between habitats and seasons. Black plumage was more abundant in the rural habitat during the breeding season (LRT = 46.75, P < 0.001; Table 3a; Fig. 3a). Brown plumage was more abundant in the rural habitat during the non-breeding season (LRT = 101.92, P < 0.001; Table 3b; Fig. 3b). Olive plumage was more abundant during the breeding season and in the rural areas of the largest city (LRT = 13.69, P = 0.003; Table 3c; Fig. 3c, d). Grey plumage was more abundant in the urban habitat during both seasons (LRT = 84.42, P < 0.001; Table 3d; Fig. 3e). Dimorphic plumage was more abundant in urban habitats, and in the rural habitat was more abundant during the breeding season (LRT = 94.24, P < 0.001; Table 3e; Fig. 3f). Moreover, the relationship between dimorphic plumage and city population size varied between habitats (Fig. 3g). Dimorphic plumage augmented with increasing city population size in urban and rural habitats, whereas in suburban habitats showed an opposed trend. Finally, iridescence plumage was more abundant in the urban habitat and during the breeding season (LRT = 44.93, P < 0.001; Table 3f; Fig. 3h).
Final Generalized linear mixed models showing the relationship between community-level weighted mean values and habitat types during the breeding and non-breeding seasons in central Argentina. SE: standard error; DF: degrees of freedom. * denotes an interaction between predictors.
| Variable | Value | SE | DF | t-value | p-value |
|---|---|---|---|---|---|
| a) Black color | |||||
| Intercept | 0.084 | 0.011 | 42 | 7.541 | <0.001 |
| Suburban habitat | −0.081 | 0.014 | 40 | −5.844 | <0.001 |
| Urban habitat | −0.084 | 0.014 | 40 | −6.050 | <0.001 |
| Non-breeding season | −0.076 | 0.013 | 42 | −5.612 | <0.001 |
| Suburban * Non-breeding | 0.075 | 0.019 | 42 | 3.957 | <0.001 |
| Urban * Non-breeding | 0.076 | 0.019 | 42 | 3.968 | <0.001 |
| b) Brown color | |||||
| Intercept | 0.416 | 0.036 | 42 | 11.706 | <0.001 |
| Suburban habitat | −0.134 | 0.044 | 40 | −3.050 | 0.004 |
| Urban habitat | −0.377 | 0.044 | 40 | −8.576 | <0.001 |
| Non-breeding season | 0.207 | 0.032 | 42 | 6.464 | <0.001 |
| Suburban * Non-breeding | −0.163 | 0.045 | 42 | −3.607 | 0.001 |
| Urban * Non-breeding | −0.209 | 0.045 | 42 | −4.621 | <0.001 |
| c) Olive | |||||
| Intercept | 0.040 | 0.015 | 44 | 2.656 | 0.011 |
| Suburban habitat | −0.011 | 0.020 | 38 | −0.572 | 0.571 |
| Urban habitat | −0.027 | 0.020 | 38 | −1.370 | 0.179 |
| City population size | 0.111 | 0.024 | 1 | 4.641 | 0.135 |
| Suburban * City population size | −0.116 | 0.034 | 38 | −3.405 | 0.002 |
| Urban * City population size | −0.111 | 0.034 | 38 | −3.282 | 0.002 |
| Non-breeding season | −0.026 | 0.012 | 44 | −2.216 | 0.032 |
| d) Grey | |||||
| Intercept | 0.188 | 0.033 | 45 | 5.611 | <0.001 |
| Suburban habitat | 0.330 | 0.047 | 40 | 6.983 | <0.001 |
| Urban habitat | 0.732 | 0.047 | 40 | 15.481 | <0.001 |
| e) Dimorphic plumage | |||||
| Intercept | 0.235 | 0.042 | 42 | 5.571 | <0.001 |
| Suburban habitat | 0.343 | 0.060 | 38 | 5.758 | <0.001 |
| Urban habitat | 0.646 | 0.060 | 38 | 10.854 | <0.001 |
| Non-breeding season | −0.169 | 0.031 | 42 | −5.371 | <0.001 |
| City population size | 0.210 | 0.068 | 1 | 3.108 | 0.198 |
| Suburban * Non-breeding | 0.153 | 0.044 | 42 | 3.447 | 0.001 |
| Urban * Non-breeding | 0.160 | 0.044 | 42 | 3.602 | 0.001 |
| Suburban * City population size | −0.296 | 0.096 | 38 | −3.091 | 0.004 |
| Urban * City population size | −0.118 | 0.096 | 38 | −1.233 | 0.225 |
| f) Iridiscent plumage | |||||
| Intercept | 1.737 | 0.365 | 44 | 4.763 | <0.001 |
| Suburban habitat | 1.290 | 0.489 | 40 | 2.637 | 0.012 |
| Urban habitat | 3.663 | 0.489 | 40 | 7.488 | <0.001 |
| Non-breeding season | −0.603 | 0.230 | 44 | −2.618 | 0.012 |
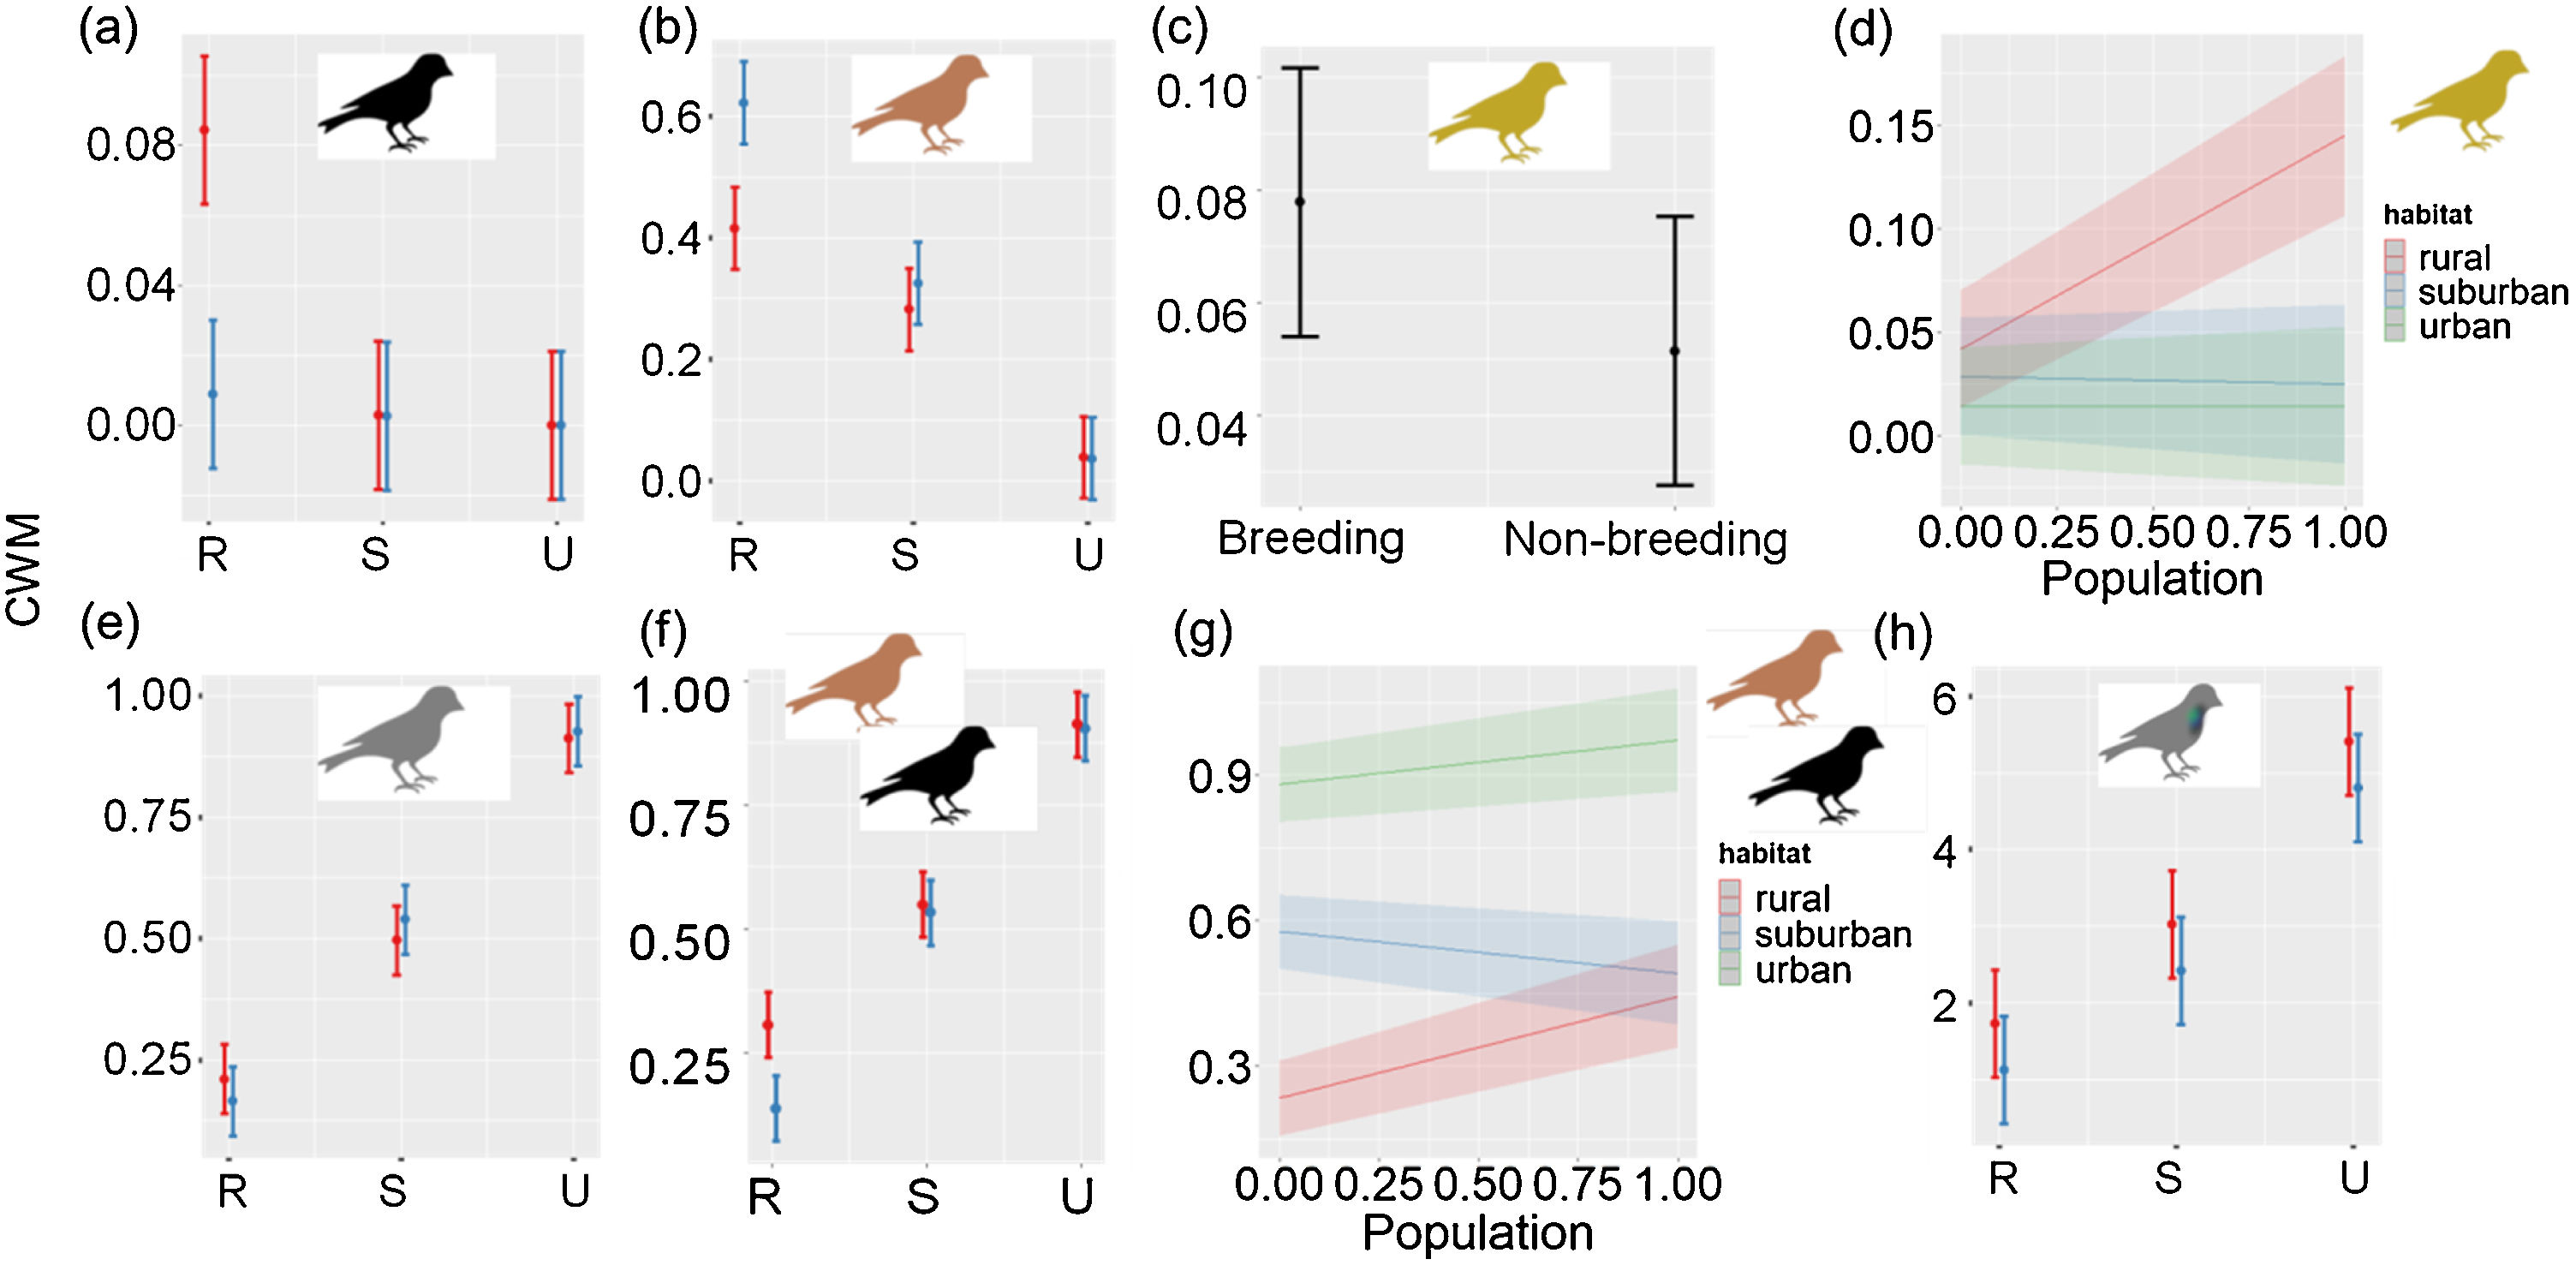
Community-level weighted mean values for plumage color (a) black, (b) brown, (c–d) olive, (e) grey, (f-g) dimorphism, and (h) iridescent plumage along urban-rural gradients. In (a), (b), (e), (f) and (h) red colors correspond to the breeding seasons and blue correspond to the non-breeding season. In (a)–(c), (e)–(f) and (h) points are means, and vertical lines are confident intervals. In (d) and (g) lines are fitted models and shaded areas confidence intervals. R: rural, S: suburban, and U: urban. City population size was rescaled between 0 and 1.
The patterns found showed that during the breeding season there was an increase in bird color diversity. However, after controlling for variations in bird species richness (SES values), bird color diversity was similar between seasons. Furthermore, bird color diversity and the seasonal change of bird composition were negatively related to urbanization and city population size of cities.
In central Argentina, bird species richness increase during the breeding season as a result of migrant bird’s arrival (Cueto and Lopez de Casenave, 2000; Leveau and Leveau, 2011; Palacio and Montalti, 2013; Haag et al., 2020). This arrival is associated with an increase of food resources during spring-summer (Hurlbert and Haskell, 2003). The results obtained showed that bird color diversity increased during the breeding season, but after controlling for variations in bird species richness, bird color diversity remained similar between seasons. Therefore, the increase of bird color diversity is a result of the increase of bird species richness.
Urban habitats had lower bird color diversity than suburban and rural areas during both seasons. The lower bird color diversity in urban habitats may be associated with lower availability of diverse food resources, such as insects and fruits, which may allow the presence of a larger number of bird species with varied plumage colors (Leveau, 2019a). On the other hand, the dominance of bird species with grey plumage or polymorphic plumage in urban areas, such as the House Sparrow (Passer domesticus) and the Rock Dove (Columba livia), may favor their camouflage with paved surfaces and their resistance to parasites (Jacquin et al., 2013; Leveau, 2021c).
After controlling for species richness variations, results showed that the seasonal changes of bird color composition along the urban-rural gradients were lower than expected by chance. Therefore, bird species color composition tended to be stable between seasons. However, the seasonal change of bird color composition was higher in rural than in suburban and urban habitats. This result agrees with our prediction, which stated that the greater annual food stability of urban habitats would result in the stability of bird species and, thus, bird plumage colors. In contrast, rural areas of central Argentina have a marked seasonal change of resources (Paruelo et al., 2001; Piñeiro et al., 2006; Lara et al., 2018; Leveau et al., 2018; Leveau, 2018), which may result in higher changes of bird species color composition.
City population size was also related to the seasonal change of color composition. Bird communities in urban and suburban habitats showed a lower seasonal change of colors in the most populated city. The increased city population size may be related to increase of pedestrian and car traffic, and more isolation of green areas to non-urban areas (Walmsley and Lewis, 1989; Leveau and Leveau, 2006; Barrigón Morillas et al., 2021). These factors may favor the annual persistence of a few bird species associated with humans, such as the Rock Dove and the House Sparrow, which in turn stabilize bird color composition. On the other hand, city population size may decrease the presence of migratory birds (Leveau, 2021d), thus decreasing the seasonal change of bird colors in cities.
In contrast, the seasonal change of color composition was higher in the rural areas of the most populated city. The rural areas of the most populated city were composed by agricultural and horticultural areas, which can increase the habitat heterogeneity and promote the seasonal variation of bird color composition.
Unlike urban and suburban habitats, rural areas were related to a significant seasonal change of several bird plumage colors. During the breeding season, rural areas had an increase of black and olive plumages. The increase of the black colors plumage was related to the arrival of migrant species, such as the Fork-tailed Flycatcher (Tyrannus savana) and the White-browed Blackbird (Leistes superciliaris) (Pearman and Areta, 2020), and the increased abundance of other resident species such as the Spectacled Tyrant (Hymenops perspicillatus) and the Yellow-winged Blackbird (Agelasticus thilius). The black plumage could favor the crypsis of these species in the herbaceous open habitat of the rural areas. The increase of olive plumage during the breeding season was related to the increased abundance of the Grassland Yellow-finch (Sicalis luteola), a grassland species which its olive color may also favor crypsis against the green herbaceous vegetation.
In contrast, birds with brown plumage increased their abundances in rural habitats during the non-breeding season. Due to rural areas during autumn and winter generally had brown shades due to the loss of photosynthetic activity, brown plumage in birds may favor their crypsis.
Several species that increased their abundances during the breeding season, such as the Grassland Yellow-finch, the Double-collared Seedeater (Sporophila caerulescens), the White-browed Blackbird and the Spectacled Tyrant had sexual plumage dimorphism. Sexual plumage dimorphism has been related to a carotenoid derived plumage, and these pigments are obtained through the diet (Gray, 1996). The Grassland Yellow Finch and the White-browed Blackbird had yellow and red plumage patches that are composed by carotenoids, and these pigments require an insect diet. Therefore, the increase of insects during the breeding season in rural areas (Danks, 2007) may favor the abundance of birds that use these food resources, and thus, favor the presence of plumage dimorphism.
This study used bird drawings to characterize interspecific bird color variation. However, birds can also perceive near ultraviolet colors (Barreira and Garcia, 2019) and, therefore, our description of bird color diversity may be underestimated. Thus, the results obtained must be taken with caution.
ConclusionsThe results obtained showed that diversity of bird plumage color increased during the breeding season along the rural-urban gradients. However, this increase was associated with the higher bird species richness during the breeding season. After controlling for this increase, there was no difference in bird color diversity between breeding and non-breeding seasons. Therefore, the temporal variation of color diversity in cities may be influenced by temporal dynamics of the regional species pool.
Urban areas were negatively related to bird color diversity, and the seasonal variation of color composition was more stable in urban than in suburban and rural areas. Therefore, urbanization is associated to a temporal homogenization of bird colors, which may be related to the stability of resources and habitat characteristics along the year.
Although city size may influence the seasonal variation of color composition, the results obtained were based only on three cities. Therefore, more replication is needed to get robust patterns of color diversity and city size.
Ethical approvalNot apply.
Funding sourcesThis research did not receive any specific grant from funding agencies in the public, commercial, or not-for-profit sectors.
CRediT authorship contribution statementNot apply.
Declaration of competing interestThe author declare that they have no known competing financial interests or personal relationships that could have appeared to influence the work reported in this paper.
AcknowledgementsTwo anonymous reviewers greatly improved a first draft of the manuscript. Paloma Garcia Orza revised the English writing.
The following are Supplementary data to this article: