


A diverse group of invasive grasses from tropical and subtropical Africa and Asia has spread throughout the Neotropics over the last decades. Despite their strong ecological impact, current and future distribution patterns of these grasses in the region according to climate change is poorly investigated. We chose ten high potential invasive grass species and used ecological niche modeling to project their geographic distribution within the Neotropics under four climate change scenarios (current, SSP1-2.6, SSP3-7.0 and SSP5-8.5 for 2100). Current climatically suitable areas for these invasive species were estimated to account for 51.3% of the Neotropics. Projections of future climatically suitable areas ranged between 47.0% and 57.6%, depending on the climate scenario. Range retractions are projected for Melinis repens and Urochloa decumbens regardless of the SSP scenario, while Arundo donax, Hyparrhenia rufa and Melinis minutiflora are expected to expand their range in all SSP scenarios. Currently, these ten invasive species have suitable areas that greatly overlap in dry regions of the Neotropics, mainly in the savannas of Central Brazil and Central America. However, a reduction in species overlap and a geographical expansion towards wetter regions is expected under the SSP1 and SSP3 scenarios, and towards drier regions under the SSP5 scenario.

Grasses of African and Asian origin were introduced at various times in the Neotropics, either accidentally or for commercial purposes and proved to be well-adapted to the climate and soils prevailing in the region. They have spread over large areas of natural ecosystems thus displacing native species owing to their aggressiveness and their great competitive power (Damasceno and Fidelis, 2020). Because of their rapid spread by seed or vegetative propagation, they are currently widely dispersed in disturbed areas and nature reserves and occupy diverse types of Neotropical ecosystems (Zenni et al., 2020). Invaded ecosystems tend to be biotical impoverished and differ markedly from adjacent non-invaded areas in structure and function, primarily related to the loss of woody species and changes in the fire regime (Williams and Baruch, 2000).
The influence of climate change scenarios on the geographic distribution of species is commonly assessed by using ecological niche modeling. Range expansion with climate change has been projected for invasive species in many taxa, such as in plants, fish, and birds (Hulme, 2016; Shrestha and Shrestha, 2019). Despite their impact on the Neotropics, the current distribution patterns of invasive grasses and their future distribution is still poorly investigated. As most alien species originate from tropical and subtropical Africa and Asia, high tolerance to elevated temperatures is expected, resulting in potential range expansion in the predicted global warming scenarios (Damasceno and Fidelis, 2020). However, in one of the few studies performed so far for invasive grasses in the Neotropical region, the distribution of alien grasses due to global climate change in South America in 2050 in the RCP4.5 scenario (Representative Concentration Pathways) showed a reduction for most species (Barbosa, 2016).
To date, few climate change models have incorporated land use in their projections of the future geographic distribution of species. Phase 6 of the Coupled Model Intercomparison (CMIP6) provides climate projections produced by an integrated assessment of models that are driven by new greenhouse gas emission and land use scenarios coupled with future pathways of societal development, the Shared Socioeconomic Pathways (SSP) (O’Neill et al., 2016). Integrating the RCP with the SSPs provides more realistic future scenarios (Box 1). Based on the climatic scenarios, it is virtually certain that there will be more frequent hot and fewer cold temperature extremes over most land areas on daily and seasonal timescales, as global mean surface temperature increases.
SSPs scenarios
SSPs can be defined as five narratives that describe plausible alternatives to demographic, economic, technological, social, governmental, and environmental changes over the scale of this century to facilitate analysis between models from different research groups (O’Neill et al., 2016). Here, the low-forcing scenario SSP1-2.6, the medium-forcing scenario SSP3-7.0 and the high-forcing scenario SSP5-8.5 were used:
The SSP1-2.6 projects a sustainable development pathway under a low-force scenario. It is based on the RCP2.6 scenario, in which the radiative forcing is adjusted to 2.6 W/m2 in 2100. The SSP1-2.6 aims to achieve development goals and reduce the vulnerability and challenges from climate change, aiming to limit the increase of global mean temperature to 2°C.
The medium-forcing scenario SSP3-7.0 projects a regional rivalry pathway under a moderate forcing scenario. It is based on the RCP7.0 scenario, the radiative forcing is adjusted to 7.0 W/m2 in 2100. The SSP3-7.0 scenario combines relatively high societal vulnerability and a high forcing level. The temperature increases in SSP3-7.0 was estimated to range between 3.7 and 4°C.
The high-forcing SSP5-8.5 scenario has vast carbon emissions and results in high societal vulnerability and low adaptability to climate change. It illustrates the worst-case emission scenario, which neglects climate change adaptation and will require extensive mitigation measures. The radiative forcing stabilizes at 8.5 W/m2 in 2100 resulting in a temperature increase of 4.1–4.8 °C (IPCC, 2014).
Considering the degradation status of the Neotropical dry regions and the predicted and ongoing climate change scenarios, the objective of this study was to estimate the possible expansion of the ten high (or very high) potential invasive Poaceae species mostly used for forage or pasture purposes in response to global warming. As these invasive grasses were originally from tropical and subtropical regions of Africa and Asia, the general expectation is an increase in climatically suitable areas for these invasive species in the Neotropics with global warming. Furthermore, we expect that the predicted increase in temperature and reduction in the amount and distribution of rainfall would be favorable for the expansion of these species into regions that are currently cooler and/or wetter than the climatically suitable areas for the species.
MethodsStudy areaThe Neotropical region follows the shapefile elaborated by Löwenberg-Neto (2014) and ranges from −117° 4′ 59.88″ to −34° 45′ 0″ longitude and from −55° 45′ 0″ to 32° 45′ 0″ latitude. Temperature (on average 10−30 °C) and rainfall (less than 100 to more than 4000 mm per year) show significant variation in the region (Burnham and Graham, 1999). From desert environments to humid forests, a range of ecosystems characterizes the Neotropical region. Among the biomes present in the Neotropics, we can highlight the rainforest in the Amazon and Atlantic Forest, the savanna, and the seasonally dry forest (Pennington and Lavin, 2016). The most extensive savannas are the Cerrado of Central Brazil and the Llanos of Venezuela and Colombia.
Species dataThe database of invasive alien species in Brazil, which was developed by the Horus Institute for Development and Environmental Conservation (2021), was used to select ten Poaceae species with high or very high invasive potential: Andropogon gayanus (high invasive potential, HIP); Arundo donax (HIP); Hyparrhenia rufa (very HIP); Megathyrsus maximus (HIP); Melinis minutiflora (HIP); Melinis repens (HIP); Urochloa brizantha (HIP); Urochloa decumbens (very HIP); Urochloa humidicola (HIP); Urochloa ruziziensis (HIP). Origin, date, place of introduction and reason for introducing each of these ten species are presented in Table S1 (Supplementary material).
When a species successfully establishes in the invaded area, a change in its ecological niche can occur (Fieldsend et al., 2021), either because of changes in biotic interactions or rapid evolution of the species (Pearman et al., 2008; Petitpierre et al., 2012). Thus, we chose to use only the Neotropical data of selected species that are considered as established exotic species (naturalized) in the region (Flora e Funga do Brasil, 2022). In addition, we made preliminary tests as indicated by Scherrer et al. (2021) that showed that the introduction of data records from the native area to estimate the potential distribution of the species resulted in a loss of accuracy in the Neotropical region (Fig. S1 in Supplementary material). Geographic information for these species, which is available in the public database Global Biodiversity Information Facility (GBIF, http://www.gbif.org), was used for potential ecological niche modeling (Fig. S1; Table S2 in Supplementary material). After standardization and exclusion of duplicate data, the final datasets for the Neotropics at 10 min’ resolution (∼340 km2) comprised 143 presence records for A. gayanus, 2121 for A. donax, 804 for H. rufa, 1134 for M. maximus, 765 for M. minutiflora, 1225 for M. repens, 315 for U. brizantha, 330 for U. decumbens, 113 for U. humidicola, and 40 for U. ruziziensis.
Potential distribution range — PDRTo estimate and map the potential distribution of the 10 selected species, gridded data sets of 19 bioclimatic variables at 10 min’ resolution were used (Table S3 in Supplementary material). To prevent overfitting of the models and select predictors most important for modeling, the VIF (Variance Inflation Factor) test in R 4.2.0 (R Core Team, 2020) was run to assess variable correlation, including latent correlations. The VIF test constrained predictors to only six non-correlated variables for model outputs (correlation < 0.85; threshold VIF ≤3.0).
Nine algorithms that are offered in the BIOMOD2 package (Thuiller et al., 2019) were used to generate the species distribution models (SDMs), which were categorized as: 1) one regression method (Generalized Linear Models — GLM); 2) five machine-learning or complex methods (Artificial Neural Networks — ANN, Generalized Boosted Models — GBM, Generalized Additive Model — GAM, Maximum Entropy — MaxEnt and Random Forests — RF); 3) two classification methods (Classification Tree Analysis — CTA, Flexible Discriminant Analysis — FDA); 4) the Surface Range Envelope — SRE model, which is very similar to Bioclim. The R script was prepared by Pedro V. Eisenlohr (https://github.com/pedroeisenlohr/niche_modelling).
Because our data consisted of species presence records only, pseudo-absence (background) points were generated and sampled across the study area. When fitting the CTA, RF, and GBM models, the same quantity of pseudo-absence points was generated as our species distribution records; however, the ANN, SRE, FDA, GLM, GAM, and MAXENT models were used with 1000 pseudo-absence points (Barbet-Massin et al., 2012). In both cases 70% of the species presence data were used to fit the models and 30% to assess model accuracy, with this process being repeated ten times.
The true skill statistic (TSS) values range from −1 to 1, where 0 indicates no predictive power. The algorithms with TSS ≤0.4 were excluded from the final consensus model because of their low accuracy (Allouche et al., 2006). The remaining algorithms were used to produce a consensus map based on binary maps of each algorithm chosen, and areas of high suitability will be those that most models have indicated as being prone to the occurrence of the species (Giannini et al., 2012).
To quantify the uncertainty among the models to actual data, the mean ROC (Receiver Operating Characteristic), standard deviation, and coefficient of uncertainty measures were calculated, i.e., sensitivity – the probability that a test result will be positive when the species is present (true positive rate, expressed as a percentage) (Thuiller et al., 2019). The consensus model generated for each species was classified based on the mean ROC sensitivity and the standard deviation (SD) of the ROC sensitivity values. Better-performing models have sensitivity values close to 100. An overall category of robustness or reliability was assigned as follows: poor (sensitivity ≤50 or SD ≥50), medium (sensitivity ≥50 with SD ≤45), good (sensitivity ≥70 with SD ≤30) and optimum (sensitivity ≥90 with SD ≤30).
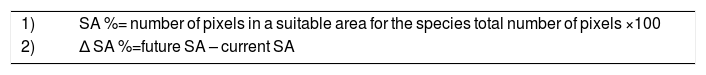
The final current and future consensus maps were transformed into binary suitable/unsuitable maps by using binary transformation with a mean threshold of the retained algorithms to compare the differences in area and the potential changes in the number of invasive grass species among the different scenarios. The suitable area (SA) in consensus models was calculated by the difference between the number of pixels in each class (0 = unsuitable; 1 = suitable) using the following equations:
For the prediction of the future model, the same set of bioclimatic variables for the decade 2091–2100 was downloaded from the WorldClim website. Here, the climate projection model CNRM_CM6-1 was considered since its version CNRM_CM5 had demonstrated good seasonal and inter-annual representation of most Brazilians river basins (Silveira et al., 2019). Differently from the representative concentration pathways (RCPs) proposed by the Coupled Model Intercomparison Project — CMIP5, CMIP6 launched a combination of scenarios between SSPs and RCPs by incorporating the future effects of different socioeconomic development pathways, which can provide more reliable global climate change scenarios (O’Neill et al., 2016; Box 1).
ResultsFollowing their introduction, these ten invasive species have rapidly expanded their geographical range in the Neotropical region and are widely distributed nowadays (Fig. 1). Hyparrhenia rufa, Megathyrsus maximus, Melinis minutiflora and Melinis repens showed the highest number of records in the Neotropics, mostly in Central America, south-eastern Brazil, and central-western Brazil. U. ruziziensis, the last species of the group to be introduced in Neotropics, about 1980 (Table S1), showed the smallest number of records and a more restricted distribution in the Neotropics (Fig. 1).
 Andropogon gayanus, (b) Arundo donax, (c) Hyparrhenia rufa, (d) Megathyrsus maximus, (e) Melinis minutiflora, (f) Melinis repens, (g) Urochloa brizantha, (h) U. decumbens, (i) U. humidicola and (j) U. ruziziensis.")
Current distribution of ten invasive Poaceae species in the Neotropical region according to data available from GBIF. (a) Andropogon gayanus, (b) Arundo donax, (c) Hyparrhenia rufa, (d) Megathyrsus maximus, (e) Melinis minutiflora, (f) Melinis repens, (g) Urochloa brizantha, (h) U. decumbens, (i) U. humidicola and (j) U. ruziziensis.
Bio 02, bio 03, bio 08, bio 15, bio 18 and bio 19 were the predictor variables selected by VIF (≤3.0) to construct the models (Table S3 in Supplementary material). The combination of these variables resulted in good reliable models (ROC sensitivity ≥74 with SD ≤6.0) (Table S4 in Supplementary material). However, not all models had good predictive power. The SRE algorithm did not present sufficient TSS values, so it was not included in any consensus model. GLM, ANN, FDA, and CTA were excluded from some consensus models following the same criteria (Table S4 in Supplementary material). The Maxent, GAM and RF algorithms were more efficient to predict the most suitable areas according to climatic variables for all species (Table S4 in Supplementary material).
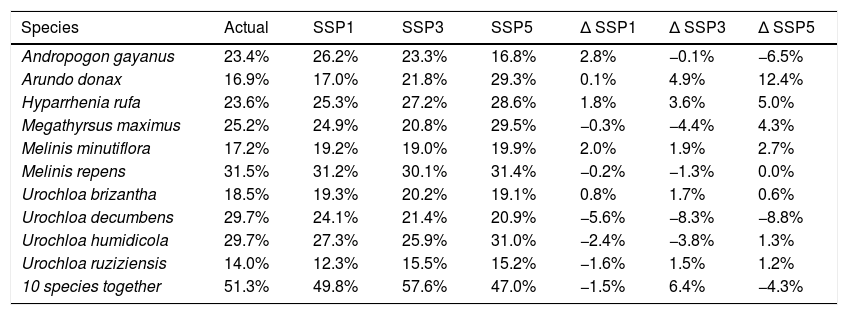
In general, current climate models show that climatically suitable areas for these species are distributed throughout the Neotropical region, with lower occurrence near the equator (between 10°S and 10°N) and in the Dry Chaco (ecoregion restricted to the northwestern two-thirds of western Paraguay, and east of the Andes in southeastern Bolivia and northwestern Argentina) (Fig. 2). The coastal region of Brazil, originally covered with Atlantic Forest and Caatinga, has extensive strips of high potential climatically suitable areas for most species (7–10 species). In the Brazilian savanna, there is a predominance of climatically suitable areas for the modeled Poaceae in the south and the central parts (Fig. 2). Large tracts of suitable areas to invasive species were found in Central America and the Great Caribbean Islands (Fig. 2). The species currently with the greatest potential distribution for the Neotropics were M. repens, U. decumbens and U. humidicola (Table 1). U. ruziziensis (14.0%), A. donax (16.9%) and M. minutiflora (17.2%) were the species with the lowest amount of climatically suitable areas in the Neotropics (Table 1). The overlap of the 10 species climatically suitable areas covered 51.3% of the Neotropics (Table 1).
.")
Potential distribution of 10 invasive grass species in the Neotropics under current climate conditions. Andropogon gayanus, Arundo donax, Hyparrhenia rufa, Megathyrsus maximus, Melinis minutiflora, Melinis repens, Urochloa brizantha, U. decumbens, U. humidicola and U. ruziziensis. Dry Ecoregions according to TNC TNC – The Nature Conservancy (2009).
Percentage of climatically suitable area in the Neotropics for ten invasive grass species under current and future climate conditions in the chosen Shared Socioeconomic Pathways (SSP) scenarios. SSP1-2.6 = low-forcing scenario; SSP3-7.0 = the medium-forcing scenario; SSP5-8.5 = high-forcing scenario; Δ = future scenario − actual scenario.
| Species | Actual | SSP1 | SSP3 | SSP5 | Δ SSP1 | Δ SSP3 | Δ SSP5 |
|---|---|---|---|---|---|---|---|
| Andropogon gayanus | 23.4% | 26.2% | 23.3% | 16.8% | 2.8% | −0.1% | −6.5% |
| Arundo donax | 16.9% | 17.0% | 21.8% | 29.3% | 0.1% | 4.9% | 12.4% |
| Hyparrhenia rufa | 23.6% | 25.3% | 27.2% | 28.6% | 1.8% | 3.6% | 5.0% |
| Megathyrsus maximus | 25.2% | 24.9% | 20.8% | 29.5% | −0.3% | −4.4% | 4.3% |
| Melinis minutiflora | 17.2% | 19.2% | 19.0% | 19.9% | 2.0% | 1.9% | 2.7% |
| Melinis repens | 31.5% | 31.2% | 30.1% | 31.4% | −0.2% | −1.3% | 0.0% |
| Urochloa brizantha | 18.5% | 19.3% | 20.2% | 19.1% | 0.8% | 1.7% | 0.6% |
| Urochloa decumbens | 29.7% | 24.1% | 21.4% | 20.9% | −5.6% | −8.3% | −8.8% |
| Urochloa humidicola | 29.7% | 27.3% | 25.9% | 31.0% | −2.4% | −3.8% | 1.3% |
| Urochloa ruziziensis | 14.0% | 12.3% | 15.5% | 15.2% | −1.6% | 1.5% | 1.2% |
| 10 species together | 51.3% | 49.8% | 57.6% | 47.0% | −1.5% | 6.4% | −4.3% |
The future potential distribution of climatically suitable areas for the ten invasive species varied depending on the species and the chosen climatic scenario. In all climatic scenarios M. repens (31.2% in SSP1, 30.1% in SSP3 and 31.4% in SSP5) and U. humidicola (27.3% in SSP1, 25.9% in SPP3 and 31.0% in SPP5) showed the highest amount of suitable areas (Table 1). On the other hand, U. ruziziensis (12.3% in SSP1, 15.5% in SSP3 and 15.2% in SSP5) and M. minutiflora (19.2% in SSP1, 19.0% in SSP3 and 19.9% in SSP5) showed the lowest availability of suitable areas. A. donax, H. rufa, M. minutiflora and U. brizantha showed an increase in suitable areas in all SSP scenarios (Table 1). Five species showed an expansion of the climatically suitable area in the SSP 1 and SPP3 scenarios. Seven species showed an expansion of the climatically suitable area in SSP5 with regards to the current climate (Table 1). In all three projected climate scenarios, U. decumbens and M. repens had reductions in climatically suitable areas (Table 1). Although only slight changes in the extension of climatically suitable areas were projected for the Neotropics (0–12.4 %), depending on the scenario, contrasting changes in niche overlap and in geographical range of suitable areas of the investigated species are expected (Fig. 3). In the SSP1 and SSP3 scenarios, there is a reduction in species overlap and a geographical expansion towards wetter areas in the Amazonia and in the Pampas (Fig. 3A, B). However, in the SSP5 scenario, the expansion of the species is directed towards the dry areas of the Dry Chaco, Great Caribbean Island and the Cerrado-Amazonian transition (near to 10°S parallel).
. (a) Projected species richness in SSP1-2.6, (b) projected species richness in SSP3-7.0, (c) projected species richness in SSP5-8.5. SSP1-2.6 = low-forcing scenario; SSP3-7.0 = the medium-forcing scenario; SSP5-8.5 = high-forcing scenario. Dry Ecoregions according to TNC – The Nature Conservancy (2009).")
Potential distribution of climatically suitable areas for 10 invasive grass species in the Neotropics under future climate conditions (2100). (a) Projected species richness in SSP1-2.6, (b) projected species richness in SSP3-7.0, (c) projected species richness in SSP5-8.5. SSP1-2.6 = low-forcing scenario; SSP3-7.0 = the medium-forcing scenario; SSP5-8.5 = high-forcing scenario. Dry Ecoregions according to TNC – The Nature Conservancy (2009).
The ten invasive Poaceae species are currently distributed mainly in the savannas of the western part of the Great Caribbean islands and southeastern and central Brazil, coastal regions of Central America (east and west coast) and costal region of South America (northwest coast in the Pacific side and east coast in the Atlantic side).
The large current distribution of the studied invasive species within the Neotropics suggest that they can successfully colonize different soil types in dry forests, shrub, and wooded savannas (Lannes et al., 2020). The Atlantic Forest biome of the coastline of Brazil and in the extreme west of the Paraná state, on the border of Brazil, Argentina, and Paraguay, showed high potential for many of these species. These were the initial regions of introduction of several species, such as M. minutiflora, U. decumbens, and U. humidicola, which have been used for pasture since 1950 (Parsons, 1972; Williams and Baruch, 2000), while others, however, arrived accidentally like M. maximus and H. rufa that were used as bedding on slave ships around the 18th century (Parsons, 1972). Within the Brazilian savanna, many field studies have confirmed their presence as invasive species in different vegetation types and also in protected areas (Damasceno and Fidelis, 2020; Lannes et al., 2020; Zenni et al., 2020). Despite their limited distribution in the Amazon, they have already been recorded in several protected areas of the region. At least half of the target species were found in Amazonian savannas, such as in the Tapajós National Forest (3° 31′ 01″ S 55° 04′ 23″ W) and in the Campos Amazônicos National Park (8° 34′ 41″ S 61° 50′ 28″ W). Although there are few records, the model of current climate predicts suitable areas in these protected areas of the Amazonian region.
The high plasticity of alien grasses, their rapid growth, and high reproductive rates may contribute to their invasive success in the face of climate change (Xavier et al., 2017). However, the suitability was higher in regions with a climate more similar to the species origin. For example, most invasive grasses showed low climate suitability for the Amazon Rainforest. In addition, compared to the fire-prone savanna vegetation of the Cerrado, the closed canopy of the Amazon Rainforest can function as a barrier for invasive species (Foxcroft et al., 2011), because shading makes the environment unsuitable for grasses. However, particularly in the Amazon Arc of Deforestation zone pastures with exotic grasses have been introduced (Cerri et al., 2018). The increasing expansion of pastures towards the Amazon Forest, entering through the deforestation regions, where the incidence of large fires is frequent, is worrying because it increases the chance that the invasive species would invade the remnants of native vegetation still present in this area (Silvério et al., 2013). U. brizantha and M. maximus stand out among invasive species (Molossi et al., 2020), both with increment prediction in the SSP5 scenario. A higher probability of occurrence of the SSP5 scenario and the projected reduction in the climatically suitable area in the Cerrado for U. brizantha pastures may further stimulate its use in other Neotropical regions, such as the Amazon.
In the extremes of the Neotropical region, a sharp increase in annual precipitation is projected in the SSP1 and SSP3 scenarios, while the SSP 5 predicts a smaller increase in annual precipitation (Fick and Hijmans, 2017). In these regions we project a decrease in suitable areas in SSP5 scenario and an increase in SSP1 and SSP3 scenarios. In the South, the Humid Pampas are characterized by a “landscape without trees”, which do not sustain forest formations (Tonello and Prieto, 2008). At the regional scale, there is a positive relationship between grass species richness and water availability in dry grassy ecosystems and a negative relationship in wet ecosystems, but for the humid pampas this relationship is not significant (Smith et al., 2022). This may help explain the difference of expansion patterns in the wetter Neotropical ecosystems.
Our results support the idea that climate change could alter the geographic range of invasive plant species as suggested by several studies (Bourou et al., 2012). However, depending on the species, climate change can increase or reduce climatically suitable areas (Gervais et al., 2020). High rates of reduction in the climatically suitable areas for several invasive grass species under climate change have been projected for South Africa (Parker-Allie et al., 2009), Australia (Gallagher et al., 2013), and South America (Barbosa, 2016). Contrary to their projections, depending on the species and the projected climate scenario, for 2100, we predict either a slight expansion or a small reduction of climatically suitable areas in the Neotropics for the ten selected invasive grass species under study. In this way, our hypotheses were partially confirmed, the models indicate heterogeneous effects of climate change on the potential distribution ranges of invasive grass species that varied depending on the species, geographic region of interest, and projected climate scenarios.
FundingThe Brazilian Council for Scientific Research (CNPq) financed the research project Long-term Ecological Research Network–PELD (CNPq/CAPES/FAPS/BC,NEWTON PROGRAM FUND; Grant Number: 441590/2016‐0 and MCTI/CNPq/FAPs; Grant Number: 403792/2012-6); INPA/MAUA Group, PPI: 1090-5; Coordenação de Aperfeiçoamento de Pessoal de Nível Superior - Brasil (CAPES) - Finance Code 001; INCT-ADAPTA (CNPq grant number: 465540/2014‐7; FAPEAM Grant Number: 062.1187/2017) and Fundação de Amparo a Pesquisa do Distrito Federal (grant no. 0193.000808/2015). A. C. Franco and M. T. F. Piedade are recipients of CNPq productivity fellowships (grant numbers 311362/2019-2 and 310547/2016-4 respectively).
Conflicts of interestAuthors declare no conflicts or competing interests.
The authors thank all colleagues that provited the GBIF data records. Matthew Miller helped with English editing of the manuscript.
The following is Supplementary data to this article:

