Host trait profiles are good predictors of parasite occurrence probabilities, especially amid shifts in species distribution due to land use and climate change. We investigated the relationship between microparasite richness (i.e., bacteria, protozoa, and viruses) and traits of wild mammal hosts (i.e., body mass, litter size, dietary guild, activity period, and foraging stratum). We also assessed correlations between host traits, transmission mode, and parasite taxonomy using a hierarchical joint species distribution model. Our analysis indicates host body mass as the most influential trait affecting the richness of zoonotic microparasites, which are shared between vertebrate animals and humans. Geographic variations in host diversity also significantly influenced microparasite distribution. Additionally, transmission modes correlated with host traits such as body mass, litter size, and activity period. The model also suggests that closely related bacteria exhibit an evolutionary signal related to host trait covariates. Finally, we identified potential distributions of zoonotic microparasites among wild mammals, particularly in primates, marsupials, and bats. Distribution patterns were evident in regions heavily influenced by land-use conversion. Our findings hold promise for informing stakeholders involved in One Health initiatives, particularly for wildlife health surveillance.

A critical aspect of predicting the emergence of zoonotic diseases lies in the scarcity of information regarding the distribution of parasites among host species (Woolhouse and Gowtage-Sequeria, 2005). Host trait profiles are good proxies for zoonotic parasite occurrence (Singh et al., 2023), especially amid shifts in species distribution due to land use and climate change (Carlson et al., 2022). Further, host traits and phylogeny generally explain parasite host ranges, suggesting that closely related host species or those with specific characteristics tend to share a more similar parasite community than other hosts (Davies and Pedersen, 2008; Huang et al., 2014; Stephens et al., 2019). Moreover, different transmission modes of parasites may correlate with host life-history traits, influencing the spread of parasites in nature (Antonovics et al., 2017). A unified approach that integrates these factors is valuable for forecasting potential host species and geographical areas.
Prior analysis supports using species-level traits to predict transmission risks and the zoonotic reservoir status of mammal species (Han et al., 2015). Host traits influence parasite transmission by affecting parasite encounters (e.g., traits associated with geographic range and resource exploitation by the host species) or acquisition (e.g., traits related to immunological investment). Accordingly, host body mass is related to higher parasite species richness, as larger hosts exhibit a slower life-history strategy with longer lifespans, potentially increasing exposure to parasite encounters across both macro- and microparasite groups (Lindenfors et al., 2007; Cooper et al., 2012a; Gutiérres et al., 2019). Furthermore, larger hosts may harbour richer parasite communities because they provide more parasite niches, such as larger organs, tissues, and body surface area that can be exploited by different parasite species. Nonetheless, this assumption could also reflect host-driven latitudinal patterns in parasites, shaped by trait-based geographic trends in hosts (e.g., Bergmann’s, MacArthur’s, and Rapoport’s rules; Poulin, 2021).
Host body size may also be correlated with metabolic rates. It is theorised that this impacts pathogen replication and the host immune response from a microbiological perspective (Wiegel and Perelson, 2004), although this remains debatable for some groups (e.g., carnivores, primates, and ungulates; Cooper et al., 2012a). For instance, bats, with their elevated metabolic capacity, which may enable daily activation of the immune system, potentially reduce viral virulence and enhance tolerance to viral infections (O’Shea et al., 2014).
In addition to body size and metabolic traits, another aspect of parasite transmission dynamics is the relationship between litter size and parasite species richness. This relationship is often explained by host species with a fast life-history strategy (r-strategists), which prioritise reproduction, and may provide demographic benefits (e.g., density) and immunological characteristics (e.g., weak immune response), thereby favouring parasite transmission and diversity (Lee, 2006). Additionally, parasite richness and parasite sharing may be facilitated by parasite transmission through shared geographical spaces among hosts (e.g., burrows, nests) or direct contact in areas with a higher density of host populations, resulting in increased encounter rates (Davies and Pedersen, 2008; Olival et al., 2017; Stephens et al., 2019). Therefore, both species traits and spatial overlap among species, as well as the parasite richness in known hosts, may be fundamental in identifying potential hosts of zoonotic microparasites.
In this context, we examined how host traits and host identity (at species and order levels) influence patterns of parasite richness across Brazilian territories, accounting for taxonomic grouping while also retaining species-level predictors to capture broader ecological trends. Brazil harbours a rich diversity of mammals, a taxonomic class that plays an essential role as hosts to many parasites (Woolhouse and Gowtage-Sequeria, 2005). However, there remains a gap in the reported parasite-host associations (Cruz et al., 2023a). Therefore, this approach can enhance proactive parasite surveillance by enabling the identification of potential hosts based on their morphological, ecological traits, and geographical distribution. We assumed that host traits shape the probability of parasite-host interactions (Olival et al., 2017) and, accordingly, we anticipated uncovering connections between host traits and the richness of zoonotic microparasites. Our goal was to identify wild mammal species and territories more suitable for the occurrence of zoonotic microparasites. Additionally, we investigated whether the transmission mode of parasites correlates with host traits. Finally, we evaluated whether members of specific microparasite taxa exhibit evolutionary signals linked to host traits, distinguishing them from other taxa.
Materials and methodsDatasetWe gathered data on parasite-host associations, host traits, and the transmission mode of parasites from the Brazilian Mammal Parasite Occurrence Data (Cruz et al., 2023a), with further details provided in the Supplementary material under ‘Description of the Dataset’. The spatial distribution of wild mammals was obtained from SALVE (ICMBio, 2022).
Statistical analysesTo address our main question—how parasite species occurrence within their hosts varies according to host traits, host identity (at species and order levels), and across a broad geographic scale (the Brazilian territory)—we analysed the data using Hierarchical Modelling of Species Communities (HMSC; Ovaskainen et al., 2017), an approach within the class of joint species distribution models. We fitted three multivariate probit regression models for zoonotic microparasites—bacteria, viruses, and protozoa (details are provided in the Supplementary material under ‘Description of the Statistical Analyses’), where the response variables were binary matrices representing the presence and absence of 30 bacteria, 11 protozoa, and 19 viruses within wild mammal species (Table S1). As explanatory variables, we used host body mass (log-transformed), litter size, dietary guild, activity period, and foraging stratum as fixed effects (see Table S2–S3 for details).
To account for variations in sampling effort attributed to different mammal species and mammal order during parasite surveys, as well as potential influences of host taxonomy on parasite specificity, we included host taxonomic order, host species, and study site as random effects (see Table S2–S3 for details). Species within the same order tend to share similar ecological and life-history traits, although species-level variation remains (Blomberg et al., 2003; Bielby et al., 2007). We defined the study site scale using the centroids of Brazilian states due to the limited availability of georeferenced data on parasite-host associations (Cruz et al., 2023b). Nonetheless, this geographical unit holds critical importance for informing public policies on the surveillance of zoonotic diseases. In the virus model, we removed the foraging stratum due to overfitting. Our analytical approach accounted for the broad host range of Trypanosoma cruzi, Escherichia coli, and Rabies lyssavirus. We initially fitted models excluding these species, then explored their impact on the overall model predictions.
We examined how the presence of species of zoonotic microparasites covariates with host traits, depending on transmission mode and parasite taxonomic relationships. As taxonomic data, we included a quantitative taxonomic tree, consisting of phylum, class, orders, families, genera, and species, generated using the ‘as.phylo’ function via ‘ape’ in the R-package version 5.0 (Paradis and Schliep, 2019). Additionally, we considered transmission mode (a categorical variable containing four classes: Direct, Indirect, Vector, and Trophic) as parasite species traits. We defined ‘transmission mode’ as the method by which a pathogen spreads among hosts (Antonovics et al., 2017) (details are provided in the Supplementary material under ‘Description of the Statistical Analyses’). If a zoonotic microparasite is transmitted through multiple modes (i.e., direct, indirect, vector, and trophic), all modes were included, each receiving equal weight in the analysis.
We fitted the HMSC model using the R-package Hmsc version 3.0 (Tikhonov et al., 2020). We sampled the posterior distribution with four Markov Chain Monte Carlo (MCMC) chains with 1000 x thin iterations used for burn-in and for the actual sampling, where we varied the thinning rate (thin = 10, 100, 1,000) until convergence was achieved (details in the Supplementary material). We examined MCMC convergence through the potential scale reduction factors of the model parameters (Gelman and Rubin, 1992).
To quantify the drivers of parasite species richness, we partitioned the explained variation among the fixed effects (body mass [log-transformed], litter size, dietary guild, activity period, and foraging stratum) and the random effects (host taxonomic order, host species, and study site) included in the model. We summarised the results by calculating the posterior mean and 95% credible intervals. Lastly, we predicted the distribution of zoonotic microparasites across wild mammal species and geographical areas, using data on the distribution of mammals in Brazil. All statistical analyses were performed using R version 4.3.2 (R Core Team, 2023).
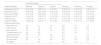
ResultsModel performanceThe MCMC convergence of the HMSC models developed for all the zoonotic microparasite taxonomic groups indicates reliable and stable model performance, with an average potential scale reduction factor for ꞵ-parameters—which measure the parasite species occurrence related to host trait covariates—of 1.02, and a maximum of 1.05. The models exhibited good data fit, as quantified by AUC, Tjur’s R², and RMSE (Table 1, Fig. S1–S3).
Summary of model performance metrics for the bacteria, protozoa, and viruses models. Model performance was assessed using Tjur’s R2, area under the receiver operating characteristic curve (AUC), and root-mean-squared error (RMSE). Mean values and their respective standard deviations (in parentheses), based on predictions from the four-fold cross-validated model, are provided. Tjur’s R2 measures the difference between predicted occurrence and absence probabilities, while the AUC captures the model’s ability to correctly classify occurrences. RMSE measures the squared difference between estimated occurrence and true species occurrence. The percentages of explained variance attributed to fixed and random effects (RE) are shown as averages across species. Results for models including T. cruzi, E. coli, and rabies virus are denoted with the letter ‘a’ for each parasite group.
| Taxonomic group | ||||||
|---|---|---|---|---|---|---|
| Output parameter | Bacteria | Protozoa | Viruses | Bacteriaa | Protozoaa | Virusesa |
| Explanatory Tjur R2 | 0.25 (0.20) | 0.23 (0.17) | 0.3 (0.22) | 0.25 (0.21) | 0.16 (0.16) | 0.26 (0.17) |
| Explanatory AUC | 0.95 (0.03) | 0.94 (0.05) | 0.96 (0.02) | 0.96 (0.02) | 0.93 (0.03) | 0.97 (0.04) |
| Explanatory RMSE | 0.16 (0.04) | 0.20 (0.08) | 0.17 (0.04) | 0.15 (0.04) | 0.18 (0.09) | 0.14 (0.01) |
| Predictive Tjur R2 | 0.13 (0.16) | 0.09 (0.12) | 0.18 (0.22) | 0.12 (0.16) | 0.09 (0.14) | 0.15 (0.16) |
| Predictive AUC | 0.74 (0.18) | 0.72 (0.11) | 0.8 (0.12) | 0.74 (0.16) | 0.70 (0.15) | 0.87 (0.08) |
| Predictive RMSE | 0.20 (0.06) | 0.24 (0.11) | 0.2 (0.05) | 0.19 (0.06) | 0.20 (0.11) | 0.17 (0.05) |
| Variance partitioning | ||||||
| Body mass (%) | 3.5 | 4 | 4.9 | 3.2 | 1.5 | 7.9 |
| Litter size (%) | 3.2 | 1.8 | 3.1 | 2.8 | 0.8 | 5.3 |
| Main guild (%) | 3.9 | 2.5 | 5.5 | 3.6 | 1.5 | 4.5 |
| Foraging stratum (%) | 2.4 | 2.3 | – | 2.5 | 1.6 | – |
| Activity period (%) | 2.7 | 1.8 | 4.2 | 2.1 | 1 | 4.4 |
| RE Host identity | 3.6 | 2 | 1.9 | 3.4 | 1.6 | 0.8 |
| RE Host order | 2.4 | 1.4 | 3.4 | 2.3 | 0.9 | 2.9 |
| RE Spatial | 4 | 8.1 | 3 | 5.8 | 7.8 | 4.4 |
Variance partitioning of the explanatory variables included in the models indicated that fixed effects (i.e., body mass, litter size, dietary guild, activity period, and foraging stratum) explained a substantial amount of model variation (Table 1, Fig. S4–S6). Among these variables, body mass (fixed effects) and geographical units (random effects) emerged as the most important predictors of parasite occurrence between hosts. Host body mass displayed a positive relationship with parasite richness for a broad spectrum of host taxa (Fig. S7). Overall parasite richness was relatively consistent across the main guild, activity period, and foraging stratum (Fig. S8–S10). Further, models’ performance, assessed through AUC, Tjur’s R2, and RMSE values, along with variable importance, was similar between analyses that incorporated E. coli and rabies virus into the models and those that excluded them (Table 1). While the model performance for protozoa, which include T. cruzi, remained unchanged (Table 1), the variance partitioning for body mass and spatial random effect was considerably reduced (Fig. S7, panel b).
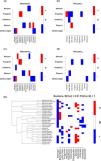
Transmission mode and taxonomy as shared responses by parasites to host traitsTransmission mode of the parasites covariates with host traits for each group of zoonotic microparasites, except for Protozoa. We observed a positive association between transmitted bacteria through direct contact and terrestrial hosts (Fig. 1, panel a). Conversely, the model showed a positive correlation between direct transmission and host litter size for viruses, excluding rabies virus (Fig. 1, panel b). However, this correlation is not evident when the rabies virus is considered (Fig. 1, panel d), and a new pattern appears, with a negative correlation between direct transmission and body mass. Therefore, these findings should be approached with caution and warrant further in-depth investigation.

Heatmap of estimated parameters linking parasite transmission mode and parasite species responses to host trait covariates. Red and blue colours indicate parameters estimated as positive and negative, respectively, with at least 95% posterior probability, while responses lacking strong statistical support are shown in white. Panels (a) show the model excluding E. coli, panel (b) show the model excluding rabies virus, and panels (c) and (d) models include these species. Panel (e) depicts shared zoonotic microparasite responses to host traits based on parasite taxonomy. Species are ordered according to their taxonomy, as illustrated by the taxonomy tree displayed in the panels.
Finally, the response of parasite species occurrence to host trait covariates displayed a high taxonomic relationship in the presence-absence model for Bacteria (P(rho) >0.9, estimated rho >1) and for Protozoa when T. cruzi was included in the data of species occurrence (P(rho) >0.9, estimated rho >1). For instance, when considering a relationship with at least a 95% posterior probability, 7% (2 out of 29) of the investigated bacteria species demonstrated a negative response to body mass, while 24% (7 out of 29) showed a positive response (Fig. 1, panel e). These proportions correspond to the species visually identified in Fig. 1 as having positive or negative associations with the host trait. Likewise, 27.5% (N = 8 from 29) of the species showed negative evolutionary signals associated with litter size and invertebrate diet, as illustrated by the species responses in the figure. The nocturnal activity trait negatively influenced only 3.5% (1 out of 29) of the investigated species, whereas 27.5% (8 out of 29) of the investigated zoonotic microparasite displayed a positive occurrence probability in nocturnal host species, and 34.5% (10 out of 29) presented a positive response to the diurnal activity trait (Fig. 1, panel e).
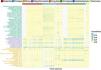
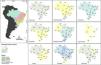
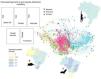
Zoonotic microparasite prediction among wild mammal species across a large geographical territoryWe found that Primates comprised the mammal order with the widest predicted range of zoonotic microparasite (Fig. 2). Examples of parasite occurrence probability across mammal orders include the protozoan Toxoplasma gondii in Primates (e.g., Ateles spp.), Carnivora (e.g., Lontra longicaudis), Cingulata (e.g., Cabassous spp.), and Cetartiodactyla (Dicotyles tajacu), Leishmania amazonensis, L. infantum, and Rotavirus A in Chiroptera (e.g., Micronycteris spp.), and Andes orthohantavirus, Juquitiba virus, Rio Mamore hantavirus, and Rickettsia rickettsii (bacteria) in didelphid marsupials (e.g., Gracilinanus spp. and Monodelphis dimidiata). The Brazilian territories exhibiting the highest estimated parasite richness, with at least four zoonotic species, include all states in the Northern region, except Tocantins (with a richness of 3.6); Mato Grosso in the Central-Western region; Bahia, Rio Grande do Norte, and Ceará in the Northeastern region; Rio Grande do Sul and Santa Catarina in the Southern region; and all states in the Southeastern region, except Espírito Santo (with a maximum richness of 3.6) (Fig. 3).

HMSC models fitted for each group of zoonotic microparasites (bacteria, protozoa, and viruses) based on body mass (log-transformed), litter size, main trophic guild, activity period, foraging stratum (fixed factors), host species identity (at species and order levels), and study site (random factor). The heatmap displays the unified results, with colours indicating the probability of zoonotic microparasite occurrence (vertical axis) between 0 and 1 (yellow to purple), according to host species suitability (horizontal axis). The probability of the parasite’s occurrence in a host species was not calculated when the association between them is already known (grey areas). Microparasite species are coloured by group.

Potential distribution of zoonotic microparasites according to host trait composition across study sites. Study sites abbreviations: AC - Acre, AL - Alagoas, AP - Amapá, AM - Amazonas, BA - Bahia, CE - Ceará, DF - Federal District, ES - Espírito Santo, GO - Goiás, MA - Maranhão, MG - Minas Gerais, MT - Mato Grosso, MS - Mato Grosso do Sul, PA - Pará, PB - Paraíba, PR - Paraná, PE - Pernambuco, PI - Piauí, RJ - Rio de Janeiro, RN - Rio Grande do Norte, RS - Rio Grande do Sul, RO - Rondônia, RR - Roraima, SC - Santa Catarina, SP - São Paulo, SE - Sergipe, TO - Tocantins. Eight states presented the highest probabilities of parasite occurrence: Roraima, Amazonas, Pará, and Tocantins in the Northern region; Mato Grosso and Goiás in the Central-Western region; and Maranhão and Piauí in the Northeastern region, where we estimated that the maximum parasite richness exceeds five zoonotic species. Primates and Chiroptera comprised the mammal orders with the broadest predicted range of zoonotic microparasites.
This study examined how host traits, parasite transmission modes, and taxonomy are related to the richness of zoonotic microparasites in wild mammals and predicted potential host species across Brazil. We found that body mass and geographic variation in host diversity are key factors, with their effects varying by parasite group. Correlations between host traits, transmission modes, and parasite taxonomy shaped parasite-host patterns. High predicted richness was concentrated in the Cerrado, Amazon, and Atlantic Rainforest biomes. These nuanced patterns emphasise that predictive models of parasite richness must account for both host ecological traits and parasite-specific attributes, such as taxonomy and transmission mode. By integrating these dimensions, our study contributes to a more mechanistic and evolutionarily informed understanding of zoonotic parasite ecology in wildlife.
Host traits and zoonotic microparasite richnessA novel insight from our results is the differential influence of body mass depending on the microparasite group, which challenges the assumption of a uniformly positive or negative relationship between host size and parasite richness. The attenuated effect of body mass in the protozoa model upon inclusion of T. cruzi suggests that widely distributed generalist parasites can mask trait-based patterns in parasite-host associations. This adjustment may also arise from the HMSC model’s reliance on community-wide mean traits, which can lead to an underestimation of probabilities for other common species (for an in-depth discussion, see Ovaskainen et al., 2017; Erickson and Smith, 2023), particularly due to T. cruzi’s broader host range. These findings underscore the need for refined modelling approaches that account for the ecological prominence of generalist parasites.
The variance explained by the fixed effects, such as body mass, litter size, diet, and foraging stratum, is also a significant predictor of zoonotic microparasite richness. Still, it only partially explains the observed variation. The magnitude of a significant spatial random effect suggests that unmeasured ecological and biogeographical factors, like host community composition and landscape structure, also play a substantial role (Andreazzi et al., 2023). These results emphasise the importance of considering both intrinsic host traits and broader geographic and environmental contexts when assessing patterns of zoonotic parasite distribution.
Transmission mode and parasite taxonomy correlate with host traitsOur analysis indicates a correlation between nocturnal species and bacteria transmitted through direct contact, highlighting how host activity shapes interactions and encounters with parasites (Gao et al., 2021). Additionally, some parasites may synchronise their activity patterns with those of their hosts and vectors (Rund et al., 2011). Consequently, both factors contribute to the increased potential for direct or vector-borne transmission. No association was found between transmission mode and host traits for protozoa, possibly because our dataset included primarily vector-dependent species, with little variation in transmission modes to reveal patterns in host traits. Although host group size and density were not incorporated into the models due to data limitations, these traits are recognised to influence parasite transmission dynamics (Altizer et al., 2003; Lindenfors et al., 2007; Han et al., 2015). Smaller-bodied species, like rodents and bats, often form larger social groups, increasing direct contact and potentially facilitating virus transmission (Clutton-Brock, 2009; Webber et al., 2017). However, correlation does not imply causation, and other unmeasured traits may also contribute to the observed patterns.
The bacteria used in our model encompass a highly diverse array of taxonomically distant species. Our results indicate that taxonomically closely related bacteria exhibit similar responses to host trait covariates. They suggest that some taxonomically conserved phenotypic traits in bacteria, potentially related to transmission dynamics, share an evolutionary signal associated with host traits, a positive, neutral, or negative signal, contingent upon the taxonomic lineage. However, research on the relationship between host and parasite ecological and life-history traits is still in its early stages (Martiny et al., 2015; Levin et al., 2021). Similarly, studies on the phylogenetic conservation of ecological traits among microparasites remain limited (Finlay, 2004; Philippot et al., 2010; Martiny et al., 2015). Future research should investigate which parasite traits, potentially influenced by phylogenetic relationships, are associated with the mammalian traits examined in this study.
We found that including T. cruzi or rabies virus into the models altered correlations between transmission mode and host traits, as well as the evolutionary signal of parasites. Such shifts reflect the sensitivity of hierarchical models like HMSC to dataset composition, since these models share information across species by implementing trait means and residual structures (Ovaskainen et al., 2017). Using a taxonomic tree instead of phylogenetic distances is also less accurate for evolutionary analyses. For instance, in our analysis, most protozoan species belong to the same genus or family, which makes them taxonomically close, potentially contributing to the lack of an evolutionary signal related to host trait covariates. Thus, the absence of an evolutionary signal may reflect either a true biological pattern that remains undetected or a methodological artefact resulting from limited taxonomic variability, such as in protozoa, which can reduce phylogenetic resolution (Vamosi et al., 2009). Additionally, using taxonomy as a proxy for phylogeny can introduce error, as taxonomically similar groups may be phylogenetically distant, and vice versa. For these reasons, we recommend interpreting the observed evolutionary signal with caution and emphasise the need for future analyses using robust genomic or multigene phylogenies.
Predictions of potential host species across a large geographical spacePrevious studies have shown that Chiroptera and Rodentia harbour the highest number of empirically detected zoonotic microparasites in Brazil (Cruz et al., 2023b). However, our findings reveal that Primates, Didelphimorphia, and Chiroptera exhibit the highest predicted parasite richness among terrestrial mammals. Notably, Primates display a greater proportion of zoonotic parasites than rodents or bats (Han et al., 2016; Cruz et al., 2023b).
Their close phylogenetic proximity to humans heightens the prominence of non-human primates as zoonotic potential sources (Cooper et al., 2012b; Olival et al., 2017), making them likely hosts for pathogens that can infect humans, while also being vulnerable to human-associated pathogens (Davies and Pedersen, 2008). However, phylogenetic proximity alone does not fully explain their role as reservoirs (Davies and Pedersen, 2008; Cooper et al., 2012b; Mollentze and Streicker, 2020), as viruses often infect distantly related hosts (Cooper et al., 2012b). Conversely, bats are considered ‘special reservoirs’ due to their long lifespans relative to body size (Munshi-South and Wilkinson, 2010), which increases their exposure to parasites (Luis et al., 2013). These results underscore the importance of integrating factors such as geographical distribution, host morphology, ecology, and life-history traits to improve our understanding of species that are more likely to be exposed to zoonotic microparasites due to shared ecological characteristics, for instance, overlapping periods of activity.
We identified territories in the Cerrado (a savannah-like biome situated in the Central-Western region), the Amazon, and the Atlantic Rainforest as particularly suitable for the occurrence of zoonotic microparasites, given the presence of potential host species. Previous studies highlight the risk of zoonotic disease emergence in Northern and Central-Western Brazil, mainly due to the high diversity of wild wild mammals and habitat loss (Han et al., 2016; Vale et al., 2021; Winck et al., 2022). Hence, our findings emphasise the importance of host traits and geography in predicting zoonotic parasite occurrences within a One Health approach, particularly as host distributions shift in response to human-driven changes in land use (Magioli et al., 2021) and climate (Carlson et al., 2022). These shifts can alter parasite-host dynamics and affect pathogen exposure in both human and wild species.
Limitations, potential implications, and future directionWhile our approach provides insights into parasite richness regarding parasite taxonomy, transmission mode, and their covariation with host traits, we acknowledge limitations that may affect model accuracy, including potential sampling bias, limited data on mammal life history, and unknown parasite transmission modes (Wille et al., 2021). Although the major host traits analysed are crucial for understanding parasite sharing, other factors that we were unable to test in our study are also expected to play a role in determining parasite occurrence, such as immunological factors, longevity, home range, and group size (Lee, 2006; Han et al., 2015; Olival et al., 2017). Data gaps hinder the incorporation of these factors into statistical models.
Our approach predicts areas with a high probability of zoonotic microparasite occurrence based on host traits. However, the apparent high probability of zoonotic occurrence in the Atlantic Rainforest, particularly in the Southern region, might be influenced by an overrepresentation of studies conducted there (Cruz et al., 2023b). To refine our predictions, further research should focus on targeted field studies in regions identified as favourable for zoonotic microparasite occurrence. Based on our findings, heightened surveillance of wild mammal species, particularly primates (Ateles spp.), bats (Micronycteris spp.), and marsupials (Gracilinanus spp. and Monodelphis dimidiata) is recommended, especially for key zoonotic pathogens such as Andes orthohantavirus, Juquitiba virus, Rio Mamore hantavirus, Vaccinia virus, Rotavirus A, Leishmania spp., and Toxoplasma gondii.
Surveillance efforts should be implemented through: (1) indirect monitoring via environmental faecal/urine sampling, and (2) direct, non-invasive monitoring of handled animals (e.g., during rescues, roadkill specimens) for faecal/urine/swab collection. These efforts are critical in regions where predicted zoonotic parasite richness is highest, notably in the Cerrado, Amazon, and Atlantic Rainforest biomes. Practical implementation could combine these sampling methods with community-based reporting of unusual wildlife mortality or behaviour. Integrating these approaches into existing biodiversity monitoring and public health initiatives may enhance early detection capacities and support a more proactive One Health surveillance system.
Moving forward, public health awareness programmes can address risks associated with human interactions with potential hosts, promoting responsible behaviours to reduce parasite transmission. Also, whenever a human zoonotic infection is documented in a new area, simultaneous investigations in non-human hosts should accompany public health initiatives. This proactive approach can help mitigate challenges posed by the absence of systematically organised data on parasite-host associations. Finally, integrating landscape and climate variables into the modelling framework can enhance our understanding of how environmental changes influence host traits and zoonotic dynamics, contributing to human and animal health, as well as biodiversity conservation efforts.
CRediT authorship contribution statementGabriella Cruz: Conceptualization, Data curation, Formal analysis, Investigation, Methodology, Visualization, Writing - original draft, and Writing - review & editing. Gisele Winck: Conceptualization, Investigation, Methodology, Writing - review & editing. Cecilia Andreazzi: Conceptualization, Funding acquisition, Investigation, Methodology, Writing - review & editing, Supervision.
Funding sourcesThis study was supported by Serrapilheira Institute grant [Cost Center 13754, project 6435; to G.L.T.C]; Brazilian Research Council postdoctoral fellowship (CNPq/MCTIC–Síntese em Biodiversidade e Serviços Ecossistêmicos–SinBiose) [152411/2020-8, 151224/2021-8, 165330/2021-0; to G.R.W.]; and Serrapilheira Institute postdoctoral fellowship [Cost Center 13754, project 5179; to G.R.W.]; Serrapilheira Institute grant [1912-32354; to C.S.A.] and Comunidad de Madrid grant [2022-T1/AMB-24091, to C.S.A]. The funding source had no involvement in the conduction of the research and preparation of the article.
Data availability statementThe dataset and the R code required to replicate the analysis are available at figshare https://doi.org/10.6084/m9.figshare.29066912. Please refer to the readme file for a more detailed description of the files.
The authors declare that they have no known competing financial interests or personal relationships that could have appeared to influence the work reported in this paper.
We thank Drs. Rosana Gentile, Fabiana Rocha, and Karla Campião for their valuable comments on the impact of host traits on parasite sharing in wild mammals. We also thank Dr. Roberto Vilela for his remarks regarding the limitations and use of the phylogenetic and taxonomic approach. We are also grateful to the Brazilian Coordination for the Improvement of Higher Education Personnel (CAPES) for providing the opportunity for the development of this work.
The following are Supplementary data to this article:

Gabriella Lima Tabet Cruz (Current address): Departamento de Biodiversidad, Ecología y Evolución, Universidad Complutense de Madrid, Madrid, Spain.