
In the Anthropocene, landscape transformations affect all ecosystems, including aquatic ones. Identifying the factors that influence zooplankton biodiversity is essential for understanding the drivers in aquatic systems. We examined the relationships between landscape variation and zooplankton community diversity using three landscape metrics: the anthropic transformation index, areas of native and anthropized land, and environmental heterogeneity across the Atlantic Forest, Tropical Savanna, and Tropical Dry Forests vegetation domains in Brazil. Community data, including diversity indices, were analyzed in conjunction with landscape metrics. The highest rate of anthropogenic transformation was observed near aquatic bodies in Tropical Dry Forest areas, indicating greater environmental degradation. Conversely, Atlantic Forest showed lowest rate of anthropogenic transformation, exhibiting peaks of the species richness, density and diversity. Zooplankton communities respond differently to anthropogenic influences, with beta diversity generally increasing in more transformed landscapes, which contrasts with the homogeneity observed in more preserved areas. Species composition was influenced by regional landscape variability, suggesting that local landscape patchiness plays a significant role. Our study demonstrated that landscape features play potential roles in shaping the biodiversity of aquatic microorganisms, providing novel insights into how landscapes metrics traditionally used in landscape ecology, can also be applied to model microinvertebrates distribution patterns.

Landscape changes, especially habitat loss and degradation, are particularly significant in Brazil's major vegetation domains, which are characterized by unique topography, diverse aquatic systems, and high levels of endemism (Drummond et al., 2005; Sousa et al., 2010). Among the six major Brazilian vegetation domains, the Tropical Savanna (Cerrado), Tropical Dry Forests (Caatinga), and Atlantic Forests stand out for their ecological richness. The Tropical Savanna is a heterogeneous domain, that supports a wide variety of species (Sano et al., 2019), while the Atlantic Forest is globally recognized as one of the most biodiverse ecosystems on the Earth (Faria and Kaizer, 2020; Solórzano et al., 2021). Both the Tropical Savanna and Atlantic Forest are classified as global biodiversity hotspots (Mittermeier et al., 2011). Similarly, the Tropical Dry Forests in Brazil also exhibit high levels of endemism (Silva et al., 2014; Caetano et al., 2022). Despite their ecological importance, these domains continue to undergo significant degradation driven by human activities (Dutra et al., 2012; Girardi, 2014; Lopes et al., 2020).
Human activities, particularly those related to the uses and occupations of lands, as well as the removal of riparian forests, are major drivers of landscape transformations, with cascading effects on aquatic ecosystems and biodiversity losses (Valiente-Banuet et al., 2015; Mello et al., 2020). They directly and indirectly impact aquatic systems by modifying river channels, increasing sedimentation, and introducing pollutants (Walks, 2008; Ding et al., 2016; Singh et al., 2021). These changes disrupt species dispersal, reduce habitat connectivity, and convert native ecosystems into agricultural lands, ultimately decreasing regional dissimilarity and promoting landscape homogenization (Morante-Filho et al., 2015; Coelho et al., 2018; Cardoso et al., 2020; Ramos et al., 2022).
Among aquatic biodiversity, zooplankton, a community of invertebrates, including rotifers, cladocerans, and copepods (Elmoor-Loureiro et al., 2023), are highly sensitive to environmental changes and are excellent indicators of ecosystem health due to their short life cycles and high dispersal capacities (Castilho-Noll et al., 2023). Consequently, zooplankton are valuable for assessing the impacts of disturbances on natural ecosystems. Understanding the spatial distribution of zooplankton species contributes to understanding how natural ecological processes (Heino et al., 2015a) and anthropogenic stressors (Simões et al., 2022) filter the regional species pool. Changes in species composition and biodiversity serve as critical tools for identifying environmental modifications and assessing ecological quality (Chase et al., 2020).
Metrics such as beta diversity can reveal environmental heterogeneity and spatial variation, helping to measure how habitat transformation affects communities (Bomfim et al., 2024a). However, assessing human impacts on landscapes remains challenging due to varying degrees of disturbance. The Anthropic Transformation Index (ATI), developed by Lemeshev (1982) and applied by Costa et al. (2014); Ribeiro et al. (2017); Vieira et al. (2021) and others, helps quantify human pressure and the extent of landscape changes, which makes it possible to diagnose the environmental quality of occupied environments (Gouveia et al., 2013; Silva et al., 2021).
Given that aquatic environments are closely linked with terrestrial ecosystems, analyzing land use changes in riparian zones is crucial for understanding how terrestrial transformations influence aquatic biodiversity (Meier et al., 2015; Usio et al., 2017; Mwaijengo et al., 2020). But the relationship between spatial variation of land uses and zooplankton diversity remains underexplored, especially in neotropics (dos Santos et al., 2025; Balseiro et al., 2023; Bomfim et al., 2024b). Therefore, the present study investigated the relationships between landscape variations in regions close to aquatic environments and the diversity (alpha and beta) of zooplankton organisms in zones of native vegetation and zones influenced by human activities in the Atlantic Forest, Tropical Savanna, and Tropical Dry Forests.
To advance the understanding of biodiversity variation patterns (Gaston, 2000), it is essential to consider that freshwater systems provide valuable opportunities to identify general drivers associated with the properties of ecological communities (Heino et al., 2015b). Among these drivers, land-use change plays a critical role, as it directly modifies habitat and landscape characteristics, thereby influencing environmental filtering processes that shape community composition and diversity (Chase et al., 2020). Based on this framework, we hypothesize that zooplankton biodiversity responds to landscape variation along environmental gradients. Specifically, we predict that (i) alpha diversity is greater in landscapes with lower environmental stress near aquatic‒terrestrial interfaces; (ii) the landscape structures of the Tropical Savanna and Tropical Dry Forests are more similar to each other than to those of the Atlantic Forest; and iii) beta diversity increases with landscape heterogeneity as an indirect response to anthropogenic influences on zooplankton community composition.
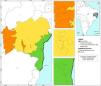
Materials and methodsStudy areaThe study area encompasses three vegetation domains in the state of Bahia (Brazil): the Tropical Savanna (called in Brazil by Cerrado), Tropical Dry Forests (called in Brazil by Caatinga), and Atlantic Forests. In the Tropical Savanna, 17 sampling sites were selected (Fig. 1), located between latitudes 12 ° 25' 50.5” S and 13 ° 0' 7.7” S and longitudes 46 ° 5' 20” W and 44 ° 37' 20.1” W, within the Corrente and Grande River basins. The water temperature during sampling ranged from 19.4 °C to 24.9 °C, the conductivity ranged from 3 μS/cm to 377 μS/cm, the dissolved oxygen concentration ranged from 10.8% to 85.1%, and the pH ranged from 5.5 to 6.5. This region, which is heavily impacted by agribusiness, faces significant environmental pressures, raising concerns about the conservation of its biodiversity (Bridgewater et al., 2002; Brannstrom et al., 2008; Lima and Calado, 2018; Dionizio and Costa, 2019).

In the Tropical Dry Forest, collections were carried out at 16 sites (Fig. 1), located between latitudes 14 ° 0' 28.3” S and 14 ° 9' 0” S and longitudes 41 ° 14' 45.6” W and 41 ° 11' 51.1” W, within the Paraguaçu and Contas River basins. During sampling, the water temperature ranged from 18.3 °C to 27.2 °C, the conductivity ranged from 11 μS/cm to 6023 μS/cm, the dissolved oxygen concentration ranged from 69.8% to 139.1%, and the pH ranged from 6.3 to 9.8. The Tropical Dry Forest, which is endemic to Brazil and characterized by prolonged droughts (Leal et al., 2003), consists of numerous intermittent rivers. Like the Tropical Savanna, it has been significantly altered by human activities, particularly due to the expansion of agribusiness (Teixeira et al., 2021).
In the Atlantic Forest, 15 sampling sites were selected (Fig. 1), located between latitudes 14 ° 13' 52.16” S and 14 ° 46' 14.45” S and longitudes 39 ° 30' 6.5” W and 39 ° 3' 34.24” W, within the Contas and Almada River basins. The water temperature varied between 24.9 °C and 32.7 °C, the conductivity ranged from 5.2 μS/cm to 314 μS/cm, the dissolved oxygen concentration ranged from 43.8% to 99.4%, and the pH ranged from 5.1 to 7.6. This area, located in southern Bahia, is part of the "Central Corridor of the Atlantic Forest," one of the most preserved regions. However, it faces significant pressure from activities such as agriculture, pasture, urbanization, and silviculture (Ramos et al., 2022).
Biological data sampling and environmental characterizationZooplankton sampling was carried out in medium and small lotic aquatic systems (perennial streams) during the dry season (April to November), from July 2022 to October 2023. Zooplankton communities were collected through horizontal trawls using a 68 μm mesh plankton net. In each sampling site, we trawled the net between three and five points to do a composite sample. The samples were immediately preserved with formalin buffered with calcium carbonate at a final concentration of 4%. Species identification was performed under stereoscopic and optical microscopy, following specialized literature (Sousa and Elmoor-Loureiro, 2019; Matsumura-Tundisi, 1986; Reid, 1985). Counts were conducted using Sedgwick-Rafter chambers, with 10 chambers per site and 3 mL of sample per chamber, resulting in 30 mL per site. The effort to identify species followed until the stabilization of the species accumulation curve. The filtered water volume was calculated using the equation Vf = π r2d, where Vf is the filtered volume, r is the radius of the net mouth, and d is the distance traveled (Pinto-Coelho, 2007). To characterize each sampling point, the physical-chemical of water were measured. Temperature and dissolved oxygen were measured by the multiparameter probe from Hanna model HI98193, while pH and conductivity were measured using the multiparameter probe Hanna, model HI98195.
Landscape analysisTo analyze the landscape features, a cartographic base including Brazil's territorial limits, Bahia's vegetation domains, and its hydrographic network was created using shapefile data from the Brazilian Institute of Geography and Statistics (IBGE, 2022). All the data were processed using QGIS 3.16 software (QGIS Development Team, 2022). For land use analysis, data from the Annual Mapping Project of Land Cover and Use in Brazil (MapBiomas, 2022), collection 7 for 2021, were used. The available categories were: Forest Formation, Savanna Formation, Mangrove, Wooded Sandbank Vegetation, Wetland, Grassland, Salt Flat, Rocky Outcrop, Herbaceous Sandbank Vegetation, Other non-Forest Formations, Pasture, Agriculture, Temporary Crop, Soybean, Sugar cane, Rice, Cotton (beta), Other Temporary Crops, Perennial Crop, Coffee, Citrus, Other Perennial Crops, Forest Plantation, Mosaic of Uses, Beach, Dune and Sand Spot, Urban Area, Mining, Other non-Vegetated Areas, River, Lake and Ocean, Aquaculture, and Non-Observed. A spatial resolution of 30 m was applied to analyze the area size, extent, and land use classes.
Zone of Influence (ZI) between aquatic and terrestrial systemsFor each sampling site, a 2-km-radius buffer was created to examine the influence of nearby environmental conditions on zooplankton diversity. Few studies have addressed the spatial relationship between land use and zooplankton communities at larger scales (Bomfim et al., 2024a), with most focusing on buffers between 50 and 500 m (Meier et al., 2015; Usio et al., 2017; Mwaijengo et al., 2020). Recent research (Valentim et al., 2024) has shown that even terrestrial permanent preservation areas (PPA) not designed for riparian ecosystems provide some protection to freshwater habitats. The quality of water systems is directly reflected in the biodiversity they support. Larger-scale studies, such as Mwaijengo et al. (2020), have demonstrated strong relationships between limnological conditions and land use, indicating that buffer zones of 100 m to 2 km can strongly influence macroinvertebrate communities. Therefore, the 2-km buffer was used to represent the zone of influence of the landscape on aquatic systems.
The area for each land use within the buffer zones was calculated using the "r.report" tool. All map creation and data processing steps were performed using QGIS 3.16.
Landscape metric analysisTo assess the effects of anthropogenic stress on zooplankton biodiversity, three landscape metrics were used for each sampling site, which were based on the 2-km buffer described earlier.
Anthropic Transformation Index (ATI) (Lemeshev, 1982; Mateo, 1991; Rodriguez et al., 2017): This metric reflects the degree of anthropogenic impact in 2021 at each site. The ATI is calculated as:
where the weights of each land use type were determined by analyses from different studies and for some of them, according to the knowledge of the researches about the studied area, resulting in the values showed in the Table 1. The final ATI for each sampling point determine an index from 1 (least degraded) to 10 (most degraded). Cruz and Teixeira (1998) further categorized these values into four degradation levels: (i) slightly degraded (0–2.5), (ii) moderately degraded (2.6–5), (iii) degraded (5.1–7.5), and (iv) highly degraded (7.6–10).The weights attributed to each land use classes.
| Land uses | Weights | Source |
|---|---|---|
| Grassland Formation | 1 | The authors |
| Other Temporary crops | 7 | The authors |
| Mosaic of uses | 5 | The authors |
| Pasture | 10 | Almeida et al. (2022) |
| Savanna Formation | 2 | Santos et al. (2024) |
| Other Perenial crops | 7 | Rodrigues et al. (2015) |
| Soybean crops | 9 | Rodrigues et al. (2012) |
| River, Lake and Ocean | 2 | Rodrigues et al. (2015) |
| Coffee crops | 9 | Rodrigues et al. (2012) |
| Forest Formation | 1 | Pereira et al. (2023) |
| Flooded field and Marshy areas | 1 | Rodrigues et al. (2015) |
| Other non-vegetated areas | 9 | Pereira et al. (2023) |
| Urban Areas | 9.7 | Rodrigues et al. (2015) |
| Silviculture | 6.2 | The authors |
| Rock outcrops | 1 | Rodrigues et al. (2015) |
Native vs. Anthropogenic Land Use: Land use categories from MapBiomas (2022) were grouped into native (e.g., forest formations, savannas, wetlands) and anthropogenic (e.g., urban areas, agriculture, pasture) categories. The sum of the following land use categories was considered native: forest formation; savanna formation; grassland formation; river, lake and ocean; flooded field and marshy areas; other non-forest formations; and rocky outcrops. For anthropic uses, the categories added were cotton, urbanized area, coffee, mosaic of uses (agriculture and pasture), other non-vegetated areas, other perennial crops, other temporary crops, pasture, silviculture, and soybean.
Environmental heterogeneity: The third metric represents a measure of the environmental heterogeneity of the zone of influence of the aquatic–terrestrial system at each sampling site. To this end, the Euclidean distance between the sampling sites was calculated using the standardized use categories. A permutational analysis of multivariate dispersion was then run (Anderson et al., 2006). From this analysis, the distance of the point from the centroid of a group was extracted, thus generating values that represent the environmental heterogeneity of a point from the average environmental heterogeneity of its respective group.
Data analysisThe observed species richness (Magurran, 2003), individual density, Shannon diversity index, and evenness (Krebs, 1998) were used as measures of alpha diversity. To demonstrate the richness of unique and shared species in each vegetation domain, a Venn diagram was constructed using the online software Bioinformatic and Evolutionary Genomic, which is available at: https://bioinformatics.psb.ugent.be/webtools/Venn/.
To verify the spatial differences in the composition of the zooplankton community along the sampling sites between the vegetation domains, a permutational multivariate analysis of variance (PERMANOVA) (Anderson, 2001) was performed, followed by a principal coordinate analysis (PCoA) to visualize the variation in the composition of the zooplankton community between the sampling sites.
Beta diversity was calculated by permutational analysis of multivariate dispersion (PERMDISP) (Anderson et al., 2006), and the relationships with the vegetation domains were subsequently tested via analysis of variance (ANOVA). The beta diversity index was represented by the average distance to the centroid of each group calculated by PERMDISP. Pearson's correlation was used to assess the relationships between community attributes and ATI and land use categories (native areas × anthropic areas) and zooplankton beta diversity. ANOVAs were calculated to evaluate the differences in landscape indices (ATI and environmental heterogeneity) between the domains.
Finally, a BIOENV procedure was performed to identify the best combination of land use categories associated with the zooplankton community (Clarke and Ainsworth, 1993). The best combination was tested via the Mantel test (999 permutations).
All analyses were performed in R.4.1 (R Core Team, 2021), and the "vegan" and "BiodiversityR" packages and the "ggplot2" package were used to create the graphs. The significance for all analyses was set at p < 0.05.
ResultsLandscape analysisEighteen land-use classes were recorded in the zones of influence surrounding aquatic systems in the Tropical Savanna, Tropical Dry Forest, and Atlantic Forests (see Table 1). A greater percentage of natural areas was observed in the zone of influence of the Atlantic Forest (73.9%), followed by the Tropical Savanna (59%) and the Tropical Dry Forest (47.8%). The most prominent land-use categories were savanna formations (30.3%), forest formations (22.6%), pasture (19.8%), and mosaics of agriculture and pasture (8.4%).
In the Tropical Savanna, the ATI ranged from slightly degraded (ATI = 2.3) to degraded (ATI = 6.4). In the Tropical Dry Forest, it ranged from moderate (ATI = 3.5) to highly degraded (ATI = 8.4), and in the Atlantic Forest, it ranged from slightly degraded (ATI = 1.5) to highly degraded (ATI = 8.5). ATI variations were statistically significant (F2,45 = 11.89; p < 0.05) and differed between the Tropical Savanna and Tropical Dry Forest zones of influence (p < 0.01), as well as between the Tropical Dry Forest and Atlantic Forest zones of influence (p < 0.01). On average, the highest ATI values were recorded in the Tropical Dry Forest zone of influence (Fig. 2).
Community descriptions
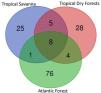
A total of 138 zooplankton taxa were identified across the 49 sampling sites (Table S1 - Supplementary Material). Rotifers accounted for 73 taxa, followed by cladocerans (40 taxa) and copepods (25 taxa). Among the total taxa, 39 occurred in the Tropical Savanna, 45 in the Tropical Dry Forest, and 89 in the Atlantic Forest. Among the vegetation domains, the Tropical Savanna had 25 exclusive taxa, the Tropical Dry Forest had 28 exclusive taxa, and the Atlantic Forest had 76 exclusive taxa (Fig. 3).

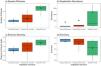
Species richness differed between the vegetation domains (F2,45 = 21.85; p < 0.05), with the highest values observed in the Atlantic Forest (Fig. 4a). Individual density was also greater in the Atlantic Forest but did not differ significantly across domains (F2,45 = 1.29; p = 0.28) (Fig. 4b). Shannon diversity significantly differed between the vegetation domains (F2,45 = 8.34; p < 0.05), with the highest values occurring in the Atlantic Forest (Fig. 4c). Evenness also differed between domains (F2,45 = 4.25; p < 0.05), indicating greater species dominance (i.e., lower evenness) in the Atlantic Forest (Fig. 4d).

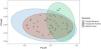
The zooplankton community composition differed among the vegetation domains (PERMANOVA, pseudo-F = 2.16; p < 0.01). The PCoA scatter plot revealed greater overlap in community composition between the Tropical Savanna and Tropical Dry Forest (Fig. 5).
Correlations between landscape features and biological attributes
Pearson correlation analysis revealed no significant associations between ATI and community attributes (richness, evenness, and abundance). Additionally, no significant associations between community attributes and ATI values were found within any vegetation domain (Pearson correlations, p > 0.05).
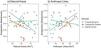
The relationships between beta diversity and land use in the zones of influence varied among the vegetation domains. In the Tropical Savanna, the beta diversity of zooplankton was negatively correlated with native areas (r = −0.75, p < 0.01; Fig. 6a) and positively correlated with anthropogenic areas (r = 0.65, p < 0.01; Fig. 6b), indicating an increase in community variation with increase in anthropization. Similar trends, though nonsignificant, were observed for the Tropical Dry Forest (Figs. 6a and b). In contrast, no association between beta diversity and land use was detected in the Atlantic Forest (Figs. 6a and b).

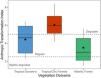
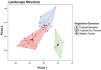
There was a significant difference in landscape structure across zones of influence between vegetation domains (PERMANOVA: F2,45 = 37.34; p < 0.05; Fig. 7). In the Atlantic Forest, there was greater forest formation and mosaic use. In contrast, the Tropical Savanna presented greater savanna formation and soybean. The Tropical Dry Forest area presented relatively high values of coffee, pasture, and other non-vegetated areas. However, a greater similarity in landscape structure was observed between the Tropical Savanna and Tropical Dry Forest zones of influence (Fig. 7), with a similar homogeneity of variance in land use percentages among the vegetation domains (PERMDISP: F2,45 = 2.03; p = 0.13).

Zooplankton beta diversity exhibited similar spatial variation patterns across vegetation domains (F = 0.97, p = 0.38). Among the vegetation domains, ATI and beta diversity were positively associated in the Tropical Savanna (Pearson-r = 0.79; p < 0.01).
The land-use categories identified by BIOENV as the most influential in explaining zooplankton beta diversity across the three vegetation domains were forest formation, land-use mosaic (agriculture and pasture), rivers, lakes, oceans, cotton, and rocky outcrops. The Mantel test, which considers land-use categories selected by BIOENV and beta diversity, was significant across all the sampling sites (Mantel-r = 0.35; p = 0.01). This suggests that greater environmental dissimilarity between landscape-use categories was associated with greater species composition differences.
DiscussionThe Atlantic Forest presented the highest alpha diversity and percentage of exclusive species and lowest ATI index, corroborating our first prediction. The high percentage of native areas within this vegetation domain, consisting of remaining forest patches, contributed to these findings, where it is expected to be found a wider range of microhabitats and environmental conditions capable of sustaining a more diverse array of species (Molina et al., 2017; Capellesso et al., 2022; Ribeiro et al., 2025). In contrast, the Tropical Savanna and Tropical Dry Forest, characterized by higher levels of habitat alteration, supported fewer taxa overall and showed a higher degree of community overlap. These findings are consistent with previous studies (e.g., Cortez-Silva et al., 2020; Bomfim et al., 2023; Santos et al., 2025) that highlight the influence of both local and regional factors on freshwater zooplankton biodiversity. While local attributes such as habitat quality (Gutierrez et al., 2022; das Candeias et al., 2022) and availability of refuges (Deosti et al., 2021) are key drivers of alpha diversity, regional elements, such as similarity in vegetation physiognomy (Dodds et al., 2019) and landscape connectivity (Pedruski and Arnott, 2011), appear to shape community composition across broader scales. Although zooplankton species partially overlap among the areas, they respond differently to environmental filters specific to each domain (Cabral et al., 2020). These differences arise because environmental filters vary across regions, influencing species selection and shaping their responses to environmental conditions (Agra et al., 2021; Diniz et al., 2021; Astorga et al., 2014).
The landscape composition surrounding the sampled aquatic systems varied markedly across the three vegetation domains. The Atlantic Forest exhibited the highest proportion of natural areas (73.9%) and the lowest ATI values, indicating relatively preserved conditions in its buffer zones. In contrast, the Tropical Dry Forest showed the greatest anthropogenic pressure, with only 47.8% of natural cover and the highest ATI values. These statistically significant differences indicate varying degrees of landscape transformation, likely driven by region-specific agricultural expansion and historical land-use policies, in a process known as frontier theory (Schielein and Börner, 2018), which is often associated with negative impacts on the both terrestrial (Foley et al., 2005; Phillips et al., 2017) and aquatic biodiversity (Dudgeon et al., 2006; Miserendino et al., 2011; Augusto et al., 2025).
The beta diversity increased in response to anthropogenic impacts, particularly in the Tropical Savanna and Tropical Dry Forest, which experienced the highest degrees of human transformation in the aquatic-terrestrial interface zones. This positive relationship indicates that an increase in the range of environmental gradients drives changes in the zooplankton community, revealing the deterministic influence of habitat heterogeneity on beta diversity (Stegen et al., 2013; Socolar et al., 2016). This also helps explain our third prediction, as anthropogenic transformations in the Tropical Dry Forest and Tropical Savanna induce eutrophication and other stressors, directly influencing zooplankton community composition (Diniz et al., 2021). For instance, the highest ATI values at Tropical Dry Forest sites reflect significant anthropogenic pressure, where livestock expansion is a main economic activity (Alves et al., 2009). Livestock and wood extraction are key drivers of spatial heterogeneity across the Tropical Dry Forest (Antongiovanni et al., 2018). These activities, combined with natural vulnerabilities like river intermittency, pose significant threats to biological diversity and primary productivity in these domains.
Thus, the land-use mosaics (including forest formation, agriculture, pasture, and cotton) surrounding aquatic environments promoted species turnover. This aligns with previous studies (Maloufi et al., 2016; Bomfim et al., 2024a), indicating that environmental changes in the landscape act as filters, selecting a local species from the regional pool. In other words, variations in local environmental conditions drive a high replacement of species (Braghin et al., 2015), likely because the environmental characteristics imposed by land use stress aquatic environments, limiting species establishment (Bomfim et al., 2024a; Duré et al., 2025). Moreover, forest cover affects zooplankton functional guilds by altering local environmental variables related to feeding strategies (Bomfim et al., 2023). Biodiversity is rarely governed by a single mechanism, especially when disturbance sources and intensities vary across regions (Hawkins et al., 2015; Socolar et al., 2016; Simões et al., 2022).
The combined analysis of landscape metrics (ATI, anthropogenic areas and environment heterogeneity) highlights the value of multiple approaches to better understand biodiversity variations. The different ways of measuring environmental variation on the basis of landscape metrics used in this study helped to understand the spatial distribution of zooplankton diversity, with an emphasis on ATI, which is driven by greater weights in areas with human activities (Rodriguez et al., 2017). The analysis that grouped land uses into native and anthropic areas also helped to reveal the gradients of change in species composition. Landscape heterogeneity through the standardization of categories captured the relationship of species composition variation only at the regional level. These discussions are pivotal for identifying the relationship between landscape environmental heterogeneity and aquatic biodiversity because the choice of spatial land-use metrics can bias conclusions of land-use impacts in river systems (Mwaijengo et al., 2020), and the sign and strength of correlations between environmental heterogeneity and biodiversity depend on the level of anthropogenic disturbance (Agra et al., 2021).
This study contributes to understanding the role of landscape structure in aquatic microbiodiversity distribution. Expanding the use of landscape metrics as indicators of ecosystem disturbance is crucial for increasing the explained variation in the plankton-environment relationship (Meier et al., 2015) and supporting decision-making about water resource management (Ding et al., 2016).
ConclusionLand-use composition and anthropogenic pressure significantly influenced zooplankton community structure in lotic aquatic systems across different vegetation domains. While species richness and diversity were highest in more preserved landscapes, such as the Atlantic Forest, beta diversity was more responsive to land-use heterogeneity and degradation, particularly in the Tropical Savanna. Our findings confirm that landscape heterogeneity alters alpha and beta diversity patterns and that the use of multiple metrics is key to understanding the effects of landscape changes on aquatic biodiversity. The association between specific land-use categories and beta diversity highlights the importance of landscape-scale processes in shaping aquatic biodiversity.
FundingWe thank the FAPESB (Fundação de Amparo a Pesquisa do Estado da Bahia)for supporting the project. NRS thanks Nacional de Desenvolvimento Científico e Tecnológicofor their grants (Process: 308074/2022-0).
The authors declare that they have no known competing financial interests or personal relationships that could have appeared to influence the work reported in this paper.
The following is Supplementary data to this article: