


Abiotic determinants of global biogeographical patterns are well known for a range of taxa, particularly plants and vertebrates. However, they are largely undescribed for most arthropods which constitute the bulk of the world biodiversity. Based on recently updated ant databases, we estimate the relative strength of abiotic and topographic determinants of ant species richness at the global scale, and investigate how such determinants vary across zoogeographic realms. We used ant species distribution to estimate ant species richness, the number of sampling points, and estimated species richness per cell of 2° worldwide. We fit simultaneous autoregressive models (SAR) to test the relative importance of six explanatory variables: annual rainfall, rainfall seasonality, mean temperature, actual evapotranspiration, mean altitude, and topographic heterogeneity, on estimated species richness. At the global scale, estimated ant species richness was best explained by annual rainfall and mean temperature. However, while annual rainfall affected positively estimated species richness for most realms, the sign of the mean temperature varied between realms. Furthermore, rainfall seasonality, actual evapotranspiration, mean altitude and topographic heterogeneity affected negatively estimated ant species richness in a number of realms. The variation in ant diversity determinants between realms challenges the generality of the global pattern and demonstrates the importance of regional ecological and historical settings. This provides useful information for conservation planning and helps predict how ants will respond to global and regional climate change.
How biodiversity is structured globally and which factors determine such patterns are long-standing issues in ecology. Latitudinal diversity patterns are well known for plants and several groups of vertebrates, including amphibians, reptiles, birds, and mammals (Hughes et al., 2021; Jenkins et al., 2013; Kreft and Jetz, 2007; Torres-Romero and Olalla-Tárraga, 2015). For invertebrates, global biodiversity patterns are much more scarce due to their overall richness and strong sampling limitations and biases. This knowledge gap, however, is closing for some insect groups, such as dragonflies, bees, butterflies, and ants (Economo et al., 2018; Hughes et al., 2021; Kass et al., 2022; Orr et al., 2021). Describing global species richness distribution patterns is crucial for biodiversity conservation planning (Mittermeier et al., 2004) and actions, such as delimiting conservation areas (Orr et al., 2021). Besides, understanding how biodiversity patterns are structured by abiotic factors allows us to predict how they will be affected by climate change (Komatsu et al., 2019; Orr et al., 2021).
Global biodiversity patterns are strongly determined by the abiotic environment (Hawkins et al., 2003; Ilsøe et al., 2017). Frequently, annual rainfall and mean temperature have emerged as the best predictors of global biodiversity patterns for several taxa, for example, mammals, amphibians, birds, and plants (Hughes et al., 2021; Kreft and Jetz, 2007; Torres-Romero and Olalla-Tárraga, 2015), as higher water availability and higher temperatures constitute favorable environmental conditions for many species in many places (Hawkins et al., 2003). Other abiotic factors, such as actual or potential evapotranspiration, also emerged as good predictors of biodiversity (Kaspari et al., 2000). Besides, factors promoting environmental heterogeneity, such as topographic factors (e.g., mean altitude and topographic heterogeneity), are also recognized as drivers of biodiversity on a global or regional scale (Torres-Romero and Olalla-Tárraga, 2015). In short, heterogeneous environments enable a wider range of species to be included in local species reserves (Stein et al., 2014).
Global variation in biodiversity is also influenced by historical factors such as geographic isolation and limited dispersal. Furthermore, climatic and topographic conditions are distinct between regions providing specific ecological and evolutionary contexts (Holt et al., 2013). Thus, generalizations of global patterns are risky because they ignore regional environmental variation, so the importance of approaches that include analyses at global and regional spatial scales grows (e.g., Torres-Romero and Olalla-Tárraga, 2015; Ilsøe et al., 2017; Lion et al., 2019). Investigations from bioregions, such as the zoogeographic realms proposed by Holt et al. (2013), can help us advance our understanding of the historical and ecological determinants of diversity patterns, given that zoogeographic realms have intrinsic differences related to the history of their phylogenetic communities.
Ants are social insects that are one of the most abundant organisms in terrestrial ecosystems (Dunn et al., 2009). The twenty-two thousand ant species estimated in the world dominate basically every inch of land and canopy, except when excluded by abiotic extremes. They are ferocious predators influencing the trophic web of natural and anthropogenic ecosystems, being able of altering the physical and chemical properties of the soils (Gomes et al., 2010). Also, ants are engaged in relevant mutualistic interactions with plants, including their defense role against herbivores, seed dispersal, and pollinators (Oliveira and Koptur, 2017). Also, they perform important ecosystem services, such as pest control. Recently, an effort was made to make available the world ant records on public platforms, allowing us to advance several aspects of ant ecology, evolution, and biogeography (Guénard et al., 2017). It is now apparent that the distribution of ant diversity resembles that of vertebrates, such as reptiles and mammals (Kass et al., 2022). The equatorial region exhibits higher ant biodiversity supported by a larger number of tropical ant lineages and a longer diversification time (Economo et al., 2018). However, marked differences are noted between the distribution of ant diversity and other taxa, such as low species richness in the Afrotropical realms (Gueńard et al., 2012; Kass et al., 2022). As in other taxon, abiotic conditions are important determinants of ant diversity (Costa et al., 2017). However, the global and regional determinants of ant diversity still seem uncertain. Our knowledge is limited to a few studies of communities at the global level with 50 sampling points worldwide (Dunn et al., 2009; Gibb et al., 2015), limited to regions (Bishop et al., 2014), or at the genus level (Gueńard et al., 2012). The effect of topographic conditions on ant species richness is still uncertain, with local and regional studies indicating positive, negative, and neutral effects of altitude (Bishop et al., 2014). Thus, the aim of our work was (1) to test the relative strength of abiotic and topographic gradients in determining global diversity patterns of ants, and (2) to test the generality of the importance of these factors across zoogeographic realms.
Material and methodsAnt datasetGlobal ant species distribution records were obtained in the Dryad platform ( Kass et al., 2022, https://doi.org/10.5061/dryad.wstqjq2pp) as a product of the Global Ant Biodiversity Informatics (GABI) project (Guénard et al., 2017). This database compiles data from the literature, museums, and other virtual databases (e.g., Global Biodiversity Information Facility - GBIF). The occurrence records in this database were optimized using a series of processes, including cleaning, georeferencing, and data optimization, as described in detail by Kass et al. (2022a, b). The database had in total 14,302 species and 1,479,293 records, which are projected following the WGS84 Datum coordinate system and, in the original source, each latitude and longitude record was rounded to four decimal places. Here, for our purposes, records within two decimal places were aggregated into a single record and is considered an independent sample site (Menegotto and Rangel, 2018). Also, we included in our database only records with a valid name or synonym according to AntCat (https://antcat.org/). Thus, the aggregated database, used in all our analyses, contained 557,754 unique records, distributed across all continents except Antarctica.
To test the generality of the effect of the abiotic variables on the global ant diversity patterns, we partitioned the dataset into 11 zoogeographic realms according to Holt et al. (2013): Afrotropical, Australian, Madagascar, Nearctic, Neotropical, Oceania, Oriental, Palearctic, Panamanian, Saharo-Arabian, and Sino-Japanese. Here, we assumed that the historical processes are relatively independent between realms as has been demonstrated for other taxa (Holt et al., 2013).
Sampling effort and species richnessObserved species richness of each realm and of each two-degree continental cells worldwide were calculated (N = 5077). We chose such resolution since, despite recent efforts, ant records are still relatively scarce and heterogeneously distributed in space.
We calculated the number of sampling points for each realm and for each two-degrees cell, as a proxy for sampling effort with the help of the raster R package (Hijmans and van Etten, 2014). Then, for each two-degrees cells we calculated sampling coverage based on Chao and Jost (2012). For the analyses, we only considered (i) cells with more than 10 sample points to ensure a minimum sampling effort per cell which can lead to more reliable estimates (Beck and Kitching, 2007), and (ii) cells with sample completeness greater than 33% based on sampling coverage (Chao and Jost, 2012).
Ant species richness was estimated for each two-degree cell and for each Realm based on the Chao2 index (Chao et al., 1988), a widely used measure for estimating species richness, particularly useful for incidence data (e.g., see Costa and Schmidt, 2022).
Explanatory variablesTo test how the estimated species richness per site responds to abiotic factors, we pre-selected 12 potential predictors of interest. First, we selected some variables from the Worldclim dataset (Hijmans et al., 2005) particularly related to water availability and temperature: mean annual temperature (Bio1, hereafter mean temperature), temperature seasonality (Bio4), maximum temperature of the warmest month (Bio5, hereafter maximum temperature), minimum temperature of the coldest month (Bio6, hereafter minimum temperature), annual precipitation (Bio12, hereafter annual rainfall), precipitation of the wettest month (Bio13, hereafter maximum precipitation), precipitation of driest month (Bio14, hereafter minimum precipitation) and precipitation seasonality (Bio15). Ants are ectothermic organisms, particularly thermophilic, so it is expected that warmer regions will harbor greater ant diversity (Sanders et al., 2007). In addition, increased water availability ensures favorable conditions for ants through increased availability of resources and shelter (Gibb et al., 2015). This set of predictors had already been shown to be important in predicting ant diversity at different spatial scales (Costa et al., 2017; Gibb et al., 2015). We also selected actual and potential evapotranspiration from the MODIS spatial data repository – Moderate Resolution Imaging Spectroradiometer (Running et al., 2018). Actual evapotranspiration depends on temperature, vegetation structure, and water availability. It measures the amount of water that is incorporated by the atmosphere from evaporation and plant transpiration processes and has been related previously to the global species richness of amphibians and mammals (Buckley and Jetz, 2007; Torres-Romero and Olalla-Tárraga, 2015). Finally, we calculated the mean altitude of each 2-degrees cell grid and its coefficient of variation (henceforth topographic heterogeneity) from the Worldclim 10 arc-min altitude layer (Hijmans et al., 2005), with the lestR R package (Vilela and Villalobos, 2015). These topographic factors are important predictors of species richness of mammal and plants on a global scale (Stein et al., 2014; Torres-Romero and Olalla-Tárraga, 2015). All potential predictors varied widely globally (Fig. S1).
A Spearman's cross-correlation matrix revealed that several of the 12 potential predictors were highly correlated (Figs. S2 and S3). Thus, we selected only the variables that had correlation values between −0.7 and 0.7 to ensure some degree of independence among variables. The six continuous explanatory variables selected to be included in the models were: annual rainfall, precipitation seasonality, mean temperature, actual evapotranspiration, mean altitude, and topographic heterogeneity. When such selected variables were included in an ordinary least squares (OLS) multiple regression model to explain variation in estimated species richness worldwide (Table. S2) and checked the variance inflation factors (VIF), all variables indicated acceptable levels of collinearity (<5) (Table S3).
Statistical analysisTo deal with spatial autocorrelation, we fitted spatial autoregressive models (SAR) to account for residual autocorrelation by defining a spatial weight matrix from the four nearest neighbors of each cell (k = 4) and a row standardization scheme (Kissling and Carl, 2008). First, we analyzed the data globally, and posteriorly, we analyzed separately for each realm. The explained variation of the models was quantified using Nagelkerke's R² (hereafter, R²). For the analyses, annual rainfall, actual evapotranspiration and mean altitude were log10-transformed to ensure centrality, and all explanatory variables were z-transformed to ensure the comparability of their effects. Spatial correlograms of Moran's model I were constructed using the "correlog" function of the "ncf" package in R (Bjornstad, 2009; Supporting Information, Fig. S4–S5).
ResultsGlobal distributionsObserved species richness was heterogeneously distributed across the globe, with the richer zones concentrated in the Panamanian realm and in the southern portions of the Nearctic realm (Fig. 1A). Furthermore, the eastern of the Neotropical realm, the southeast of the Afrotropical realm, Madagascar, the Mediterranean region, and southern portions of the Oceania realm also had high to medium observed species richness values.
 Observed ant species richness, (B) Number of ant sampling points, as a measure of sampling effort, C. Estimated ant species richness. Information is represented in a 2 by 2 degrees grid. Observed species richness and number of sampling points are represented in a log2-scaled. The letters represent the realms: Afrotropical (AFR), Australian (AUS), Madagascar (MAD), Nearctic (NEA), Neotropical (NEO), Oceania (OCE), Oriental (ORI), Palearctic (PAL), Panamanian (PAN), Saharo-Arabian (SAH), and Sino-Japanese (SIN).")
The global biogeography of ants. (A) Observed ant species richness, (B) Number of ant sampling points, as a measure of sampling effort, C. Estimated ant species richness. Information is represented in a 2 by 2 degrees grid. Observed species richness and number of sampling points are represented in a log2-scaled. The letters represent the realms: Afrotropical (AFR), Australian (AUS), Madagascar (MAD), Nearctic (NEA), Neotropical (NEO), Oceania (OCE), Oriental (ORI), Palearctic (PAL), Panamanian (PAN), Saharo-Arabian (SAH), and Sino-Japanese (SIN).
Sampling effort, however, was also highly unevenly distributed in space (Fig. 1B). From the 5,077 continental two-degree cells of the world grid, 2,218 cells contained no sampling point, this being mostly distributed in the frozen regions of the Nearctic, Palearctic, Sino-Japanese, and Oriental realms, but also in the dry and hot regions of the Saharo-Arabian, and Afrotropical realms. A significant number of cells were also not sampled in the central part of the Neotropical and Afrotropical realms. In contrast, ant sampling was relatively intense in the central and southern regions of the Nearctic realm, in the western region of the Palearctic realm, and in the Panamanian and Australian realms. In total, 2,859 cells had at least one sampling point and 1,481 had 10 or more.
The global biogeographical pattern for the estimated species richness (Fig. 1C) was similar to that of observed species richness. The equatorial region is the main hot zone of diversity, especially the Neotropical, Afrotropical, Madagascar, and Panamanian realms. The Oceania and Oriental realms also have large numbers of species. The Nearctic and Palearctic realms, and the central area of the Australian realm have lower species overall.
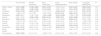
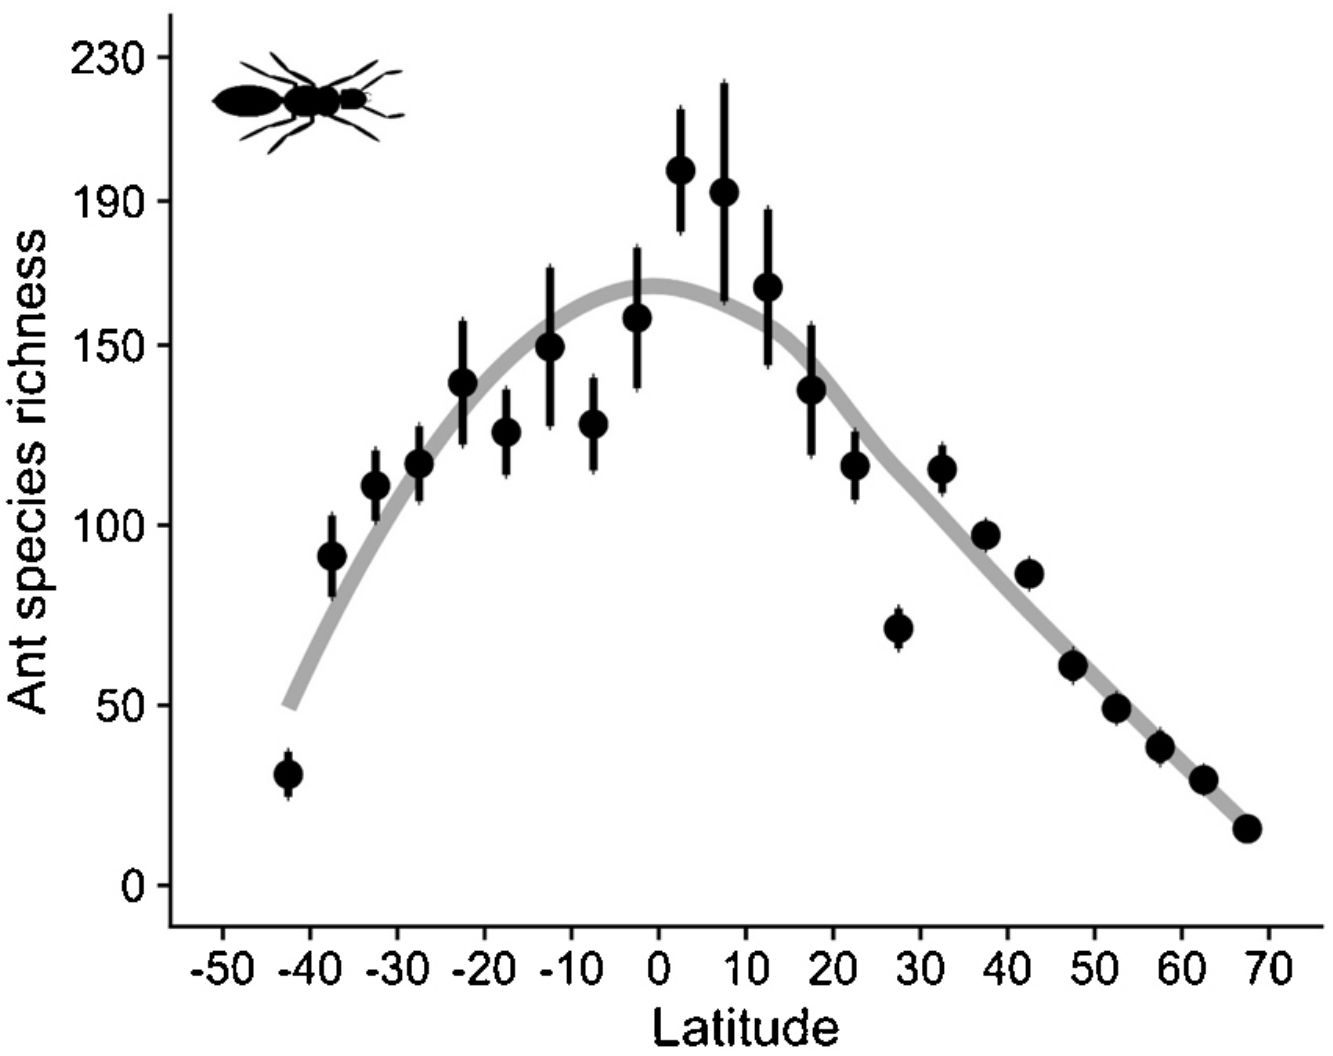
As expected, estimated species richness exhibited a unimodal latitudinal gradient, reaching around 170 ant species per two-degrees cells at the equator but dropping towards the south and north poles (Fig. 2).
Comparing total ant richness across realms
Overall, our data-set contained 14,328 ant species. Total observed species richness (Srealm) was higher for the Oriental (2,803 species), Neotropical (2,733), Afrotropical (2,319) and Panamanian (1,863) realms, and lower for Madagascar (754) and Sino-Japanese (659) (Fig. 3A). However, such values are highly influenced by the differential sampling effort between realms. Sampling effort (Erealm), measured by the total number of sampling points for the realm, was highest in the northern hemisphere realms, Nearctic (39,001) and Palearctic (28,732), while realms with vast arid and semiarid regions such as the Oceania (1,562) and Madagascar (1,372) realms were least sampled (Fig. 3B). Moreover, estimated species richness, was higher for the Oriental (3,466), Neotropical (2,874), Afrotropical (2,633), Panamanian (2,069) realms, intermediate for the Australian (1,786), Oceania (1,461), Nearctic (1,360) and Palearctic (1,295) realms, and lower for Saharo-Arabian (1,237), Sino-Japanese (860) and Madagascar (831) realms (Fig. 3C).
 Total ant species richness per realm, (B) Mean species richness per realm, (C) Total sampling effort per realm, (D) Mean number of sampling points per two-degree cells, (E) Estimated species richness per realm, and (F) Mean estimated species richness per realm. For the symbols of the realms, see Fig. 1.")
Patterns of species richness per realm. (A) Total ant species richness per realm, (B) Mean species richness per realm, (C) Total sampling effort per realm, (D) Mean number of sampling points per two-degree cells, (E) Estimated species richness per realm, and (F) Mean estimated species richness per realm. For the symbols of the realms, see Fig. 1.
Local observed species richness (Slocal) was, in average, higher for the Madagascar (mean = 144.7 ± 21.6 [SE] species), Panamanian (137.1 ± 19.6), Neotropical (71.6 ± 4.8) and Australian (58 ± 4.9) realms, and lowest for the Sino-Japanese (28.3 ± 3.2) and Saharo-Arabian (25.3 ± 2.3) realms (Fig. 3D). However, the local sampling effort (Elocal) also differed widely across realms, being, in average, higher in the Nearctic (80.6 ± 5.2) and Panamanian (78.5 ± 11.0) realms, and lower in the Sino-Japanese (14.4 ± 2.7) and Saharo-Arabian (13.2 ± 1.6) realms (Fig. 3E). Estimated local species richness (SSlocal) was, in average, higher for the Madagascar (169.6 ± 24.8), Panamanian (166.7 ± 22.8), Neotropical (129.9 ± 13.4) and Oriental (90.6 ± 8.1) realms, intermediate for the Australian (78.1 ± 6,1), Nearctic (64.3 ± 3.1), Paleartic (61.1 ± 7.0), Afrotropical (59.8 ± 4.9) realms, and lower for the Oceania (57.4 ± 8.8), Sino-Japonese (47.8 ± 7.2), and Saharo-Arabian (39.9 ± 3.1) realms (Fig. 3F).
Predictors of ant biodiversity patternsFor the global model, which explained 42% of the variation of estimated ant richness, mean temperature (β = 0.419 ± 0.064), annual rainfall (β = 0.327 ± 0.052) and mean altitude (β = 0.316 ± 0.047) were the strongest predictors. Besides, topographic heterogeneity (0.09 ± 0.034) had a weaker positive effect, rainfall seasonality (0.158 ± 0.052) had a negative effect and actual evapotranspiration had a non-significant effect (Table 1 and Fig. 4). By adding realm to the global model (as a fixed factor), the explanatory power did not improve substantially (r2 = 0.44) and annual rainfall, mean temperature, mean altitude, topographic heterogeneity and rainfall seasonality remained as the five significant predictors (Table 1).
Estimates (±SE) of predictors of estimated ant species richness worldwide and in different realms.
| Annual rainfall | Rainfall seasonality | Mean Temperature | Actual evapotranspiration | Mean altitude | Topography heterogeneity | R² | |
|---|---|---|---|---|---|---|---|
| Global + realms | 0.375 ± 0.056 | −0.180 ± 0.052 | 0.581 ± 0.079 | −0.082 ± 0.044 | 0.334 ± 0.047 | 0.089 ± 0.034 | 0.44 |
| Global | 0.327 ± 0.052 | −0.158 ± 0.053 | 0.419 ± 0.064 | −0.080 ± 0.043 | 0.316 ± 0.047 | 0.091 ± 0.034 | 0.42 |
| Afrotropical | 0.576 ± 0.133 | −0.337 ± 0.125 | −0.121 ± 0.157 | −0.393 ± 0.144 | 0.049 ± 0.168 | 0.301 ± 0.146 | 0.34 |
| Australian | −0.335 ± 0.217 | 0.3 ± 0.294 | −0.09 ± 0.302 | 0.619 ± 0.183 | 0.583 ± 0.135 | 0.083 ± 0.138 | 0.43 |
| Madagascar | 0.225 ± 0.111 | −0.146 ± 0.258 | −1.031 ± 0.325 | −0.916 ± 0.288 | −0.589 ± 0.323 | 0.759 ± 0.269 | 0.68 |
| Nearctic | 0.067 ± 0.078 | −0.246 ± 0.092 | 0.895 ± 0.103 | −0.226 ± 0.07 | 0.309 ± 0.088 | 0.005 ± 0.068 | 0.65 |
| Neotropical | 0.392 ± 0.154 | −0.119 ± 0.129 | 0.288 ± 0.172 | −0.013 ± 0.096 | 0.328 ± 0.151 | 0.093 ± 0.099 | 0.28 |
| Oceania | −0.104 ± 0.325 | 0.019 ± 0.33 | 0.396 ± 0.438 | −0.558 ± 0.43 | 0.489 ± 0.378 | −0.094 ± 0.218 | 0.39 |
| Oriental | 0.064 ± 0.144 | −0.124 ± 0.154 | 0.137 ± 0.188 | −0.141 ± 0.157 | 0.043 ± 0.164 | 0.084 ± 0.132 | 0.14 |
| Palearctic | 0.078 ± 0.096 | −0.184 ± 0.118 | 0.435 ± 0.112 | −0.192 ± 0.081 | 0.254 ± 0.106 | 0.105 ± 0.074 | 0.46 |
| Panamanian | 0.773 ± 0.137 | 0.066 ± 0.139 | −0.145 ± 0.192 | −0.523 ± 0.171 | −0.006 ± 0.168 | −0.118 ± 0.131 | 0.61 |
| Saharo-Arabian | 0.500 ± 0.149 | −0.172 ± 0.124 | 0.083 ± 0.166 | −0.010 ± 0.137 | 0.087 ± 0.154 | 0.108 ± 0.141 | 0.28 |
| Sino-Japanese | 0.645 ± 0.243 | 0.01 ± 0.179 | −0.038 ± 0.199 | 0.219 ± 0.158 | 0.034 ± 0.251 | 0.279 ± 0.185 | 0.69 |
Numbers in bold indicate significant values (p < 0.05).

Estimated coefficients plot of the simultaneous autoregressive model for estimated species richness worldwide. Bars represent standard error and black balls represent significant values. GLO indicates the global model. For the symbols of the realms, see Fig. 1.
The positive significant effect of annual rainfall in the global models also emerged in the Afrotropical (β = 0.576 ± 0.133), Madagascar (β = 0.225 ± 0.111), Neotropical (β = 0.392 ± 0.154), Panamanian (β = 0.773 ± 0.137), Saharo-Arabian (0.500 ± 0.149) and Sino-Japanese (0.645 ± 0.243) realms, while only the Australian and Oceania realms show non-significant negative effects (Fig. 4A). Furthermore, rainfall seasonality affected negatively the estimated species richness in the Afrotropical (β = −0.337 ± 0.125) and in the Nearctic realms (β = −0.246 ± 0.092, Fig. 4B).
Although the effect of mean temperature on estimated species richness was positive for the global model, the sign of this effect was significantly positive for the Nearctic (β = 0.895 ± 0.103) and Palearctic (β = 0.435 ± 0.112) realms, but significantly negative for the Madagascar (β = −1.031 ± 0.325) realm (Fig. 4C).
Although actual evapotranspiration had no effect on the global models, it had significant negative effects in five realms, Afrotropical (β = −0.393 ± 0.144), Madagascar (β = −0.916 ± 0.288), Nearctic (β = −0.226 ± 0.07), Palearctic (β = −0.192 ± 0.081) and Panamanian (β = −0.523 ± 0.171), and positive effect in the Australian realm (β = 0.619 ± 0.183) (Table 1, Fig. 4D).
The global positive effect of mean altitude emerged in the Australian (β = 0.583 ± 0.135), Nearctic (β = 0.309 ± 0.088), Neotropical (β = 0.328 ± 0.151) and Palearctic (β = 0.254 ± 0.106) realms (Fig. 4E). Finally, topographic heterogeneity positively affected estimated species richness in the Afrotropical (β = 0.301 ± 0.146) and Madagascar (β = 0.759 ± 0.269) realms (Fig. 4F).
The explanatory power of the models varied considerably between realms. The highest determination coefficients were observed in the Sino-Japanese (R2 = 0.69), Madagascar (0.68), Nearctic (0.65), Palearctic (0.46), and Australian (0.43) realms, while the lowest determination coefficient were verified in the Saharo-Arabian (0.28), Neotropical (0.28), and Oriental (0.14) realms.
DiscussionClimatic and topographic conditions are important determinants of global biodiversity patterns (Hawkins et al., 2003; Buckley and Jetz, 2007; Ilsøe et al., 2017). Our findings point to mean temperature, annual rainfall and mean altitude as the main drivers of ant biodiversity worldwide. However, the influences of abiotic factors are complex, and although we detect general patterns, differences between zoogeographic realms reveal that biodiversity is structured differently given local and regional ecological conditions.
The spatial patterns presented here are similar to global patterns of species richness of terrestrial vertebrates (Buckley and Jetz, 2007; Torres-Romero and Olalla-Tárraga, 2015), dragonflies (Hughes et al., 2021), and vascular plants (Kreft and Jetz, 2007), with the hot zones of diversity concentrated especially in the equatorial region, mostly in the Neotropical, Panamanian, Afrotropical, and Oriental realms. Plants secure resources, and shelter, and locally alter the microclimate, favoring ants (Oliveira and Koptur, 2017), so it could be expected that the general patterns of ants are partly similar to those of vascular plants. Our findings are partly at odds with global patterns of bee species richness (Orr et al., 2021), as the southern regions of the Neotropical and Australian realms show high numbers of bee species, whereas ants do not appear to be as diverse in these regions. This discrepancy highlights the importance of revealing the global patterns of other invertebrate taxa. Our results largely agree with other studies of ants on a global scale, indicating the tropical region as the main center of diversity (Dunn et al., 2009; Gibb et al., 2015; Kass et al., 2022). Here, however, we point to the Afrotropical realm as a center of ant diversity, different from that described in Kass et al. (2022).
Water availability is a strong factor affecting diversity patterns globally (Hawkins et al., 2003). Annual rainfall has previously been pointed out as a key driver of ant diversity at local, regional and global scales (Gibb et al., 2019, 2015; Vasconcelos et al., 2018). In our global analysis, annual rainfall emerged as an important driver of ant species richness at the global scale, being also relevant for several realms (i.e., Panamanian, Sino-Japanese, Afrotropical, Saharo-Arabian, Neotropical and Madagascar). Ants benefit from annual rainfall through different pathways. Areas with higher rainfall develop forests with higher, continuous, and multilayer canopy, providing additional foraging ground, shelter, and nesting sites for the ant colonies (Yanoviak and Kaspari, 2000). Also, higher rainfall is normally associated with a higher diversity of plants and, consequently, to a higher diversity of their associated arthropods, many of them used as prey by generalist and specialized ants. Under adequate amounts of nutrients, higher rainfall also leads to higher productivity, which is translated into a higher availability of food resources (Queiroz et al., 2013). Globally, higher mean rainfall was positively correlated to the rainfall of the driest month (r = 0.64; Fig. S3), which indicate a higher consistency of conditions and resources over time (Arnan et al., 2006; Gibb et al., 2015). Consistently, rainfall seasonality had a negative effect on ant estimated species richness in global scale, and in the Nearctic and in Afrotropical realms.
World regions with high temperatures host a large proportion of the global biodiversity, this being frequently associated to the higher diversity of plants and higher productivity, providing resources to other organisms in a positive trophic cascade (Kaspari et al., 2000; Liang et al., 2016). Since most ants are thermophilic, regions with higher mean temperatures are expected to lead, in general, to higher local species diversity (Dunn et al., 2009; Ilsøe et al., 2017). In addition, hottest regions, especially near the equator, harbor a greater number of ant lineages, which have had a longer time to diversify (Economo et al., 2018), and therefore harbor a greater number of species today. Our results indicate that mean temperature is a major determinant of estimated ant species richness on a global scale, as has been suggested by other large scale studies (Dunn et al., 2009; Gibb et al., 2015). Increasing temperature favors ants by allowing them to forage more and harvest more energy (Yanoviak and Kaspari, 2000). In colder regions such as Nearctic, increasing temperature it decreases individual mortality, thus preventing colony decline and reducing local extinction rates, especially by nest freezing (Sanders et al., 2007). However, in hot regions, such as the Madagascar realm, species richness decreases with mean temperature. In this realm, the mean temperature value is strongly correlated with the maximum temperature of the warmest month (r = 0.78) and the minimum temperature of the coldest month (r = 0.78) (Fig. S3), which should limit the local establishment of many species, since the maximum temperature values are probably above their ecophysiological limits.
Actual evapotranspiration has been suggested as a measure of ecosystem productivity (Rosenzweig, 1968), an important driver of diversity as has been demonstrated globally for mammals (Torres-Romero and Olalla-Tárraga, 2015) and plants (Kreft and Jetz, 2007) and, regionally, for ants (Kaspari et al., 2000). However, the global model did not support actual evapotranspiration as an important factor in determining ant diversity patterns at global scale, in contrast to what it could be expected by the energy-water hypothesis (Kaspari et al., 2000). Indeed, in contrast to what it could be expected, we found negative effects of actual evapotranspiration in five realms, Afrotropical, Madagascar, Nearctic, Palearctic and Panamanian, while we found a strong positive effect only in the Australian realm.
The effects of altitude on ant diversity patterns have been extensively investigated at various scales (Bishop et al., 2014; Longino et al., 2019; Sanders et al., 2007), but their effects are still uncertain. A number of studies indicate that species richness of ant peaks in areas of intermediate elevation, at about 500 m, and then diversity declines to near absent species in areas of high elevation (Longino et al., 2019). However, other studies report a decline in species richness with increasing average altitude, driven by decreasing temperature (Sanders et al., 2007). On a global scale, we found that increasing mean altitude elevates estimated species richness, with this effect emerging in the Australian, Neotropical, Nearctic, and Palearctic realms. Higher altitude sites have been relatively less affected by anthropogenic disturbance and are therefore better conserved (Lewis et al., 2015). In this context, the effects of altitude on ant species richness may be linked to local conditions (e.g., conservation status, soil type, or vegetation cover). In addition, the mean altitude may represent to some extent the heterogeneity of the environment, since at our grain (2 degrees), it may harbor a range of heterogeneous habitats at different levels of mean altitude, making it possible for a larger set of species to be included in a local pool. Congruently, our findings indicate that topographic heterogeneity elevates the estimated species richness in global scale and, Afrotropical and Madagascar realms. Previously, topographic heterogeneity (environmental) has been noted as a global driver of biodiversity (Stein et al., 2014), this is because, greater heterogeneity ensures that more species meet their niche needs.
Abiotic factors have a significant influence on the structure of ant communities worldwide and across realms, as discussed in this and other studies (Costa et al., 2018; Dunn et al., 2009; Gibb et al., 2015). However, historical processes of diversification and extinction strongly influence current patterns of diversity (Holt et al., 2013). The niche conservatism hypothesis, offers a useful explanation for the distribution of current ant diversity (Economo et al., 2018). According to this hypothesis, climatic niches evolve slowly, and clades have higher diversity in their ancestral climatic niche (Wiens and Donoghue, 2004). Ants emerged approximately 170 million years ago and diversified over the Cretaceous (age of angiosperms) to the late Pleistocene when the global climate was hottest and more humid (Economo et al., 2018; Moreau et al., 2006). Thus, current patterns of ant diversity are the end result of niche conservatism, given that ants are ectothermic and thermophilic(Sanders et al., 2007), the transition to cooler climates at high latitudes could be a barrier, with a tendency to occur rarely, leading high latitude regions to have a smaller set of phylogenetically clustered species from younger lineages (Economo et al., 2018). In addition, the niche conservatism hypothesis may explain the peak diversities in higher-elevation areas, currently, lowlands near sea level (<500 m altitude) are excessively hot currently (compared to the past) for many ant species, which limits the local species assemblage (Longino et al., 2019; Longino and Branstetter, 2019).
Insects, including ants, are declining at an alarming rate (Fonseca, 2009), jeopardizing important ecosystem services, such as population and pest control, nutrient cycling and seed dispersal (Leal et al., 2014; Oliveira and Koptur, 2017). Therefore, conservation protocols aimed at conserving this group are becoming increasingly important. Currently, conservation goals are generally formulated at a global scale based on the assumption that regions that are diverse for vertebrates or plants are also diverse for other taxa (Mittermeier et al., 2004). However, this assumption is unsafe since patterns of biodiversity differs among taxa, scales, and ecological and historical context. This study found that the hot zones of ant diversity resemble that of vertebrates and vascular plants, as described previously (Gueńard et al., 2012; Kass et al., 2022), but important differences also emerged. Thus, further effort should be done to describe the geographical patterns of arthropods and other invertebrates which represent the bulk of the world biodiversity.
We are currently facing an unprecedent global climate change caused by human activities. It is estimated that global temperatures will increase, in average, at least two degrees Celsius by the end of this century and that this will lead to drastic regional spatio-temporal changes in temperature and precipitation (Magnan et al., 2021). The impacts are expected to disproportionately affect different regions of the world. For example, many regions of the Southern Hemisphere are expected to experience a sharp decline in annual precipitation by the end of the century (Pontes et al., 2020). This can be exacerbated by the high rates of deforestation in many tropical rainforest areas (d’Annunzio et al., 2015). Since ants are sensitive to natural and human-induced changes (Ribeiro-Neto et al., 2016; Vasconcelos et al., 2018) and our results demonstrated their sensitivity to abiotic gradients, we predict that ant diversity will be greatly affected by climate change. Our results not only reveal natural biogeographical patterns of ants but can serve as a basis for future global and regional conservation initiatives aiming to mitigate the effects of global change.
Author's contributionsAD and CRF contributed to the study conception, sampling and analysis design. AD ran all statistical analyses and made all tables and figures. AD and CRF contributed to the writing up of all drafts of the manuscript.
Conflict of interestsThe authors fully agree with the submission of the manuscript and have no conflicts of interest
Data availability statementAll the data used here can be retrieved on publicly accessible digital platforms, antmaps (https://antmaps.org/about.html) and antweb (https://www.antweb.org/). The R project with the scripts will be available upon request to the corresponding author.
A.D. received support from the Coordenação de Aperfeiçoamento de Pessoal de Nível Superior (CAPES;88887495257/2020-00), C.R.F. received support from the Conselho Nacional de Desenvolvimento Científico e Tecnológico (CNPQ;314944/2020-6). We express our thanks to the Programa de Pós-Graduação em Ecologia da Universidade Federal do Rio Grande do Norte which provided support for this research. Additionally, we thank the Laboratory of Plant Ecology at Universidade Federal da Paraíba for their support.
The following is Supplementary data to this article:


