


Although a few studies have addressed the combined effects of climate change and habitat loss on biodiversity at a regional scale, the extent to which climate change will impact species occurrence at the landscape scale remains unclear. We evaluated the potential effects of climate change at the landscape scale for 11 bird species endemic to the Atlantic Forest biodiversity hotspot. We quantified current and future climatic suitability for each species using ecological niche models, and quantified habitat amount and structure using connectivity analyses. Climate and landscape suitability were then combined using two approaches, which differed in the spatial scale at which climate was quantified. First, we incorporated climate at patch-level into the probability of connectivity (PC) index, obtaining a Combined Landscape Suitability (CLS) index. Second, we multiplied climate at landscape-level with PC. Climatic suitability at the landscape scale was predicted to vary little (<3%) from current to future conditions and there was a high correlation between current and future CLS and PC x climate, regardless of the method used and species’ trait differences (r ≥ 0.95 for all species). Landscapes that currently have the highest suitability for birds are likely to remain highly suitable in the future, regardless of climate change. For Atlantic Forest endemic birds, our results suggest that climate change will have minor effects on landscape-level, which does not exclude potential impacts at a regional scale. This study supports the growing perception that, in tropical regions, land-use change is an urgent threat to biodiversity.
One pressing issue in biodiversity conservation is the potential impact of climate change on species (IPCC, 2019; Peterson et al., 2011), which has been widely estimated by ecological niche models (Manes et al., 2021; Thomas et al., 2004). This type of model maps climatically suitable areas for species under current and future conditions, usually at the macroscale (e.g. Araújo et al., 2004; Lemes and Loyola, 2013), correlating environmental conditions at 10 arcmin to 30″arcsec with species occurrences (e.g. Hijmans et al., 2017, 2005). Despite the great contribution to advancing ecological theory, these models have had relatively few direct applications for conservation, because (i) climatic suitability is not the only factor contributing to species persistence (Dilts et al., 2016; Jetz et al., 2007), (ii) the method relies on incomplete biological information (e.g. Beck et al., 2014), (iii) there are a number of uncertainties in the method that may not accurately reflect the impact of climate over species (for details on methodological uncertainties see, for example, Diniz-Filho et al., 2009; Goberville et al., 2015; Zurell et al., 2012), and (iv) there is a lack of quality climate data at fine scales over a broad area (e.g. Kearney et al., 2014).
Furthermore, in a world increasingly dominated by human activities, the combined effect of habitat loss and fragmentation is still regarded as the most important threat to biodiversity worldwide (Haddad et al., 2015; Püttker et al., 2015). Landscapes with low habitat cover and a high degree of fragmentation usually have small and isolated habitat patches, which may hamper movement and resource acquisition by individuals (Andrén, 1994; Lees and Peres, 2009; although the actual effects of habitat fragmentation are still under intense debate: Fahrig, 2019; Fletcher et al., 2018). In addition, as habitat loss reaches a certain threshold, the decline in population density may be especially fast (Andrén, 1994). Previous studies have observed a sharp decline in community integrity for vertebrates in landscapes with less than 30% of forest cover (Banks-Leite et al., 2014). Hence, it is not surprising that landscape metrics have increasingly been incorporated in efforts to prioritize areas for species conservation across many spatial scales (Moilanen et al., 2005; Visconti and Elkin, 2009).
Analyses at the landscape level are particularly valuable, as they make management decisions more accurate and accessible to managers (Lindenmayer et al., 2008; Worboys et al., 2016). Therefore, combining climate change predictions, habitat cover and landscape structure change into the prioritization of areas for conservation is crucial (e.g. Dilts et al., 2016; Gouveia et al., 2016; Keppel et al., 2015; but see Scriven et al., 2015). After all, areas with suitable habitats may become unsuitable under climate change (Jetz et al., 2007; Nadeau and Fuller, 2016). Some studies have incorporated the effect of land cover on species distributions under climate change (e.g. Alagador and Cerdeira, 2018; Dilts et al., 2016; Gouveia et al., 2016; Scriven et al., 2015), and assessed continuous climatic suitability at fine scales (e.g. using regular grid over the studied area, Alagador et al., 2016, 2014). Other studies went further in climate and land cover change estimates by also incorporating landscape metrics to assess habitat structure (e.g. Dilts et al., 2016; Gouveia et al., 2016; Scriven et al., 2015). These studies that considered landscape metrics first defined climatically suitable areas by binary forecasting (i.e. zero for unsuitable and one for suitable), at coarse spatial scales (regional, continental or global), and then calculated landscape metrics inside the climatically suitable areas.
However, the extent to which climate change will affect landscape-level suitability for species has not been widely approached. In addition, by using binary instead of continuous forecasts, previous studies were not able to rank landscapes according to their combined climatic and habitat suitability, under different climatic conditions. For these reasons, it is still unclear whether landscapes that currently have high habitat and climate suitability will remain so under widespread climate change. This is a critical issue considering the increased use of landscapes as planning units for establishing priority areas for conservation and ecological management (Lindenmayer et al., 2008).
To test whether climate change can affect the suitability of landscapes for species, we mapped, quantified, and combined climatic and habitat suitability for species at the landscape level, in the Atlantic Forest, one of the world’s most threatened biodiversity hotspots (Myers et al., 2000). To do so, we used two approaches differing in the spatial scale at which climatic suitability was quantified. First, we included patch-level climatic suitability as an additional attribute in the broadly used Probability of Connectivity Index (PC; Saura and Pascual-Hortal, 2007), obtaining an integrative index, hereafter referred to as Combined Landscape Suitability (CLS). High CLS values indicate that landscapes are both climatically suitable and have large and/or well-connected habitat patches, thus providing suitable habitat for a given species. Second, we estimated landscape suitability by multiplying the traditional PC by landscape-level average climatic suitability. By correlating current and future estimates of landscape suitability, we were able to assess the degree to which climate change can affect the relative suitability of landscapes for species. As model species we selected 11 bird species, all endemic to the Atlantic Forest, with different dispersal abilities and range sizes.
Materials and methodsStudy area and focal speciesThe Atlantic Forest has high species richness and endemism due to its great spatial and climatic heterogeneity (Loiselle et al., 2010; Myers et al., 2000). Over the last century, extensive deforestation caused substantial loss of native forest and habitat fragmentation. The Brazilian portion of the forest currently holds only ∼27 to 28% of its original cover (MapBiomas, 2021; Rezende et al., 2018), 83% of which are located within fragments smaller than 50 ha (Ribeiro et al., 2009). The Atlantic Forest is also one of the world’s most studied biodiversity hotspots for climate change impacts on biodiversity (Manes et al., 2021).
We selected 11 bird species as model organisms, all endemic to the Atlantic Forest (see Table S1, Vale et al., 2018). The species differ in phylogenetic history, conservation status, geographical distributions, and functional traits, such as body mass and diet, which are important determinants of dispersal ability (see Table S1, Sutherland et al., 2000). We used this set of species to cover a broad array of potential responses to different connectivity scenarios and climatic regions of the Atlantic Forest.
Ecological Niche Models (ENM)We compiled species occurrence records from the Global Biodiversity Information Facility (GBIF, http://www.gbif.org) and the literature (Souza et al., 2011). Occurrence records with missing or wrong coordinates (see protocol at Hijmans, 2020) and located less than 1 km from each other were eliminated, using the package ‘spThin’ (Aiello-Lammens et al., 2015). All species presented more than 15 independent occurrence records and therefore were nicely tuned to be robustly modeled by ENM (Table S1).
We used bioclimatic variables describing the historical (a.k.a. current, average for 1960–1990) and future (average for 2041–2060) climate, downloaded from WorldClim, at 30″ resolution (Hijmans et al., 2005). We chose five GCMs from the Coupled Model Intercomparison Project (CMIP5) with the best performance for tropical areas: BCC-CSM1-1, HadGEM2-ES, IPSL-CM5A-LR, MIROC5, and NorESM1-M (Anav et al., 2013; Yin et al., 2013). To be conservative, we used the RCP 8.5 scenario, in which there is no substantial change in current patterns of production and consumption (IPCC 2013). We selected a subset of bioclimatic variables that had low collinearity (r < 0.3), performing a Pearson correlation matrix, using package ‘corrplot’ (Wei et al., 2013) in R (R Core Team). The selected variables were Mean Diurnal Range of Temperature, Isothermality, Temperature Annual Range, Mean Temperature of Wettest Quarter, Precipitation of Wettest Quarter, and Precipitation of Coldest Quarter.
Because different modeling algorithms may produce different predictions (Diniz-Filho et al., 2009; Elith and Graham, 2009), we used five algorithms: Bioclimate analysis (BIOCLIM), which requires only presence data; Maximum Entropy (MaxEnt), which requires presence and background data; and Generalized Linear Model (GLM), Random Forest and Support Vector Machine (SVM), which require presence and pseudo-absence data. For the algorithms that use pseudo-absence data, we created 100 pseudo-absence points for each occurrence record randomly distributed within the geographic extent of the analysis (adapted from Barbet-Massin et al., 2012; Lobo and Tognelli, 2011), using the package ‘dismo’ (Hijmans et al., 2017) in R. For MaxEnt, we created 10,000 background points randomly distributed within the geographic extent of the analysis (Barbet-Massin et al., 2012; Phillips and Dudík, 2008). The calibration and projection area of the models refer to the minimum convex polygon based on the species occurrence records, plus 20% of the polygon area as an external buffer (Barve et al., 2011).
We evaluated the models using 10-fold cross-validation to evaluate model performance, using the True Skill Statistic (TSS) (Allouche et al., 2006). To convert continuous suitability maps into binary maps, we used the maximum training specificity and sensitivity threshold rule. Continuous ensemble models were created by the TSS weighted mean of individual model outputs, eliminating models with TSS < 0.7, and the binary ensemble models were created by the majority rule (Araújo and New, 2007). Final binary map projections had pixels classified as either 0 (unsuitable) or 1 (suitable), while continuous map projections had pixels ranging from 0 to 1. We ran the models using package ‘modleR’ (Sánchez-Tapia et al., 2018). Both projection outputs had 30″ resolution. In the next step, (as explained in the next section), we downscaled these maps to assess climatic suitability at the landscape scale.
Landscape structure analysesTo quantify landscape structure across the entire Brazilian Atlantic Forest, we used the forest remnants maps (2011–2012) from SOS Mata Atlântica and INPE (2013) (Fig. S1). These maps were produced by visual interpretation of Landsat images from 2011 and 2012 and included only forest fragments larger than 3 ha. We used the same forest remnants data for both periods, current and 2050, as the focus of the analysis was to assess how climate change, alone, could affect landscape suitability for the species. Furthermore, there are no high-resolution maps of predicted future forest cover for the Atlantic Forest.
We divided the Atlantic Forest into 50,000 ha hexagons (“landscapes”, hereafter), and used Albers Equal Area Conic Projection for area calculations. The choice of landscape size followed two criteria. First, the inclusion of a large number of forest fragments, which allows a detailed and robust quantification of landscape structure and reduces potential biases related to the segmentation of the study area into hexagons (e.g. an artificial reduction in the size of patches located near landscape boundaries, see Fig. 3 as an example). The Atlantic Forest is highly fragmented, in which ∼80% of its fragments are <50 ha and the average distance between fragments is large (∼1.5 km) (Ribeiro et al., 2009; Rosa et al., 2021). Second, considering an area compatible with the dispersal ability of the studied species, large enough to allow movements of the species with largest dispersal ability (e.g. ∼5 km for Amazona brasiliensis, Pyrrhura cruentata, and Odontophorus capoeira, Table S2, in a hexagon which is ∼28 km in its diagonal, i.e. 5.6 times longer).
For each landscape we calculated the Probability of Connectivity Index (PC; Saura and Pascual-Hortal, 2007), to quantify landscape structure. PC encompasses landscape area, patch area, and distances between patches, considering species dispersal ability (i.e. functional connectivity of habitat patches). Hence, PC provides an integrative metric that quantifies the habitat suitability for a given species in a given landscape (e.g. Pascual-Hortal and Saura, 2006; Saura and Pascual-Hortal, 2007). This index has received empirical support from many studies (reviewed in Saura, 2015) and is able to predict species occurrence patterns (Awade et al., 2012). For this reason, the PC index has been increasingly used to rank and prioritize landscapes for conservation and restoration (e.g. Aquilué et al., 2020; Giannini et al., 2015; Tambosi et al., 2014; Ward et al., 2020).
To combine climatic suitability and habitat availability into a single metric for each landscape, we considered two alternative approaches. First, we incorporated climatic suitability directly into the calculation of the PC index, as a “patch attribute” (see Saura and Pascual-Hortal, 2007). This “Combined Landscape Suitability” (CLS) index was quantified for each hexagon as follows:
where n is the number of forest fragments, ai and aj are the sizes of the forest fragments in each pair of fragments (i and j), bi and bj are the climatic suitability for each fragment, P*ij is the maximum probability of connection between the two fragments, and A2L is the landscape area. We obtained the climatic suitability of each forest fragment from the continuous map projection for each species (which ranged from 0 to 1), extracting the value for the patch centroid. Higher CLS values indicated landscapes with large and well-connected forest fragments (i.e. high values of ai and P*ij), and with high climatic suitability (i.e. high values of bi).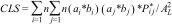
To estimate P*ij and calculate the CLS index, we had to estimate the dispersal ability for each of the 11 studied bird species. Because the dispersal ability of most neotropical birds is unknown, we estimated mean dispersal ability using functional groups based on an allometric model for birds from Sutherland et al. (2000) (see Supplementary Information for details, and Table S2).
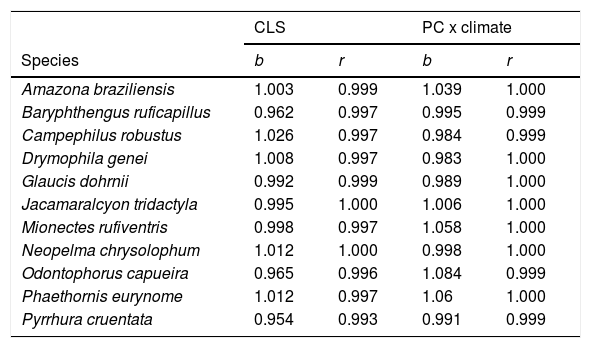
We also considered a second approach to combine climatic and habitat suitability. In the second approach, we calculated the traditional PC index of each landscape, without considering the climatic suitability of each fragment. Then, we calculated the average climatic suitability of each landscape, i.e. the average values of climatic suitability among all pixels in the landscape. Finally, we calculated the product of PC and average climatic suitability. The main difference between the two approaches is the spatial scale at which the climatic suitability is quantified: CLS uses climatic information for each habitat patch (finer scale), whereas the second approach (PCxclimate, hereafter) only uses average climatic suitability across the entire landscape (coarser scale). As the two approaches provided very similar results (see Table 1), and the first approach uses more refined climatic information, we focused the remaining of the Methods and the Results on CLS. We calculated the PC and CLS indices in the software Conefor Sensinode 2.5.8, using the R command line version (Saura and Torné, 2009).
Correlation slope (b) and coefficient (r) of the combined landscape suitability index (CLS) under current and future conditions, and the connectivity index (PC) multiplied by current and future climate.
| CLS | PC x climate | |||
|---|---|---|---|---|
| Species | b | r | b | r |
| Amazona braziliensis | 1.003 | 0.999 | 1.039 | 1.000 |
| Baryphthengus ruficapillus | 0.962 | 0.997 | 0.995 | 0.999 |
| Campephilus robustus | 1.026 | 0.997 | 0.984 | 0.999 |
| Drymophila genei | 1.008 | 0.997 | 0.983 | 1.000 |
| Glaucis dohrnii | 0.992 | 0.999 | 0.989 | 1.000 |
| Jacamaralcyon tridactyla | 0.995 | 1.000 | 1.006 | 1.000 |
| Mionectes rufiventris | 0.998 | 0.997 | 1.058 | 1.000 |
| Neopelma chrysolophum | 1.012 | 1.000 | 0.998 | 1.000 |
| Odontophorus capueira | 0.965 | 0.996 | 1.084 | 0.999 |
| Phaethornis eurynome | 1.012 | 0.997 | 1.06 | 1.000 |
| Pyrrhura cruentata | 0.954 | 0.993 | 0.991 | 0.999 |
To calculate CLS, we considered all landscapes that overlapped the suitable areas for each species, i.e. the areas with suitable climate in the present and/or in the future as estimated by the binary projections. However, within this range, we considered the values from continuous models to estimate CLS. We then calculated the CLS for each landscape and performed a Pearson correlation between the current and future CLS for each species. A strong positive correlation indicates that climate change will have minor effects on landscape prioritization. The results were also very similar when we used generalized least square models to correlate the CLS values, controlling spatial autocorrelation among landscapes (Table S3).
We also analyzed separately landscapes with forest cover higher or lower than 30% and 50%. These thresholds were based on previous studies that have shown an abrupt change in community integrity for birds in landscapes with less than 30% forest cover in the Atlantic Forest, and that landscapes with more than 50% forest cover retain almost all species (Banks-Leite et al., 2014; Martensen et al., 2012).
We also performed paired T-tests to compare current and future climatic suitability, using the continuous values of the models. It is important to note that we did not quantitatively compare the two approaches addressed in the study (i.e., “CLS” with “PCxclimate”), but the current and future conditions as estimated by each approach, independently.
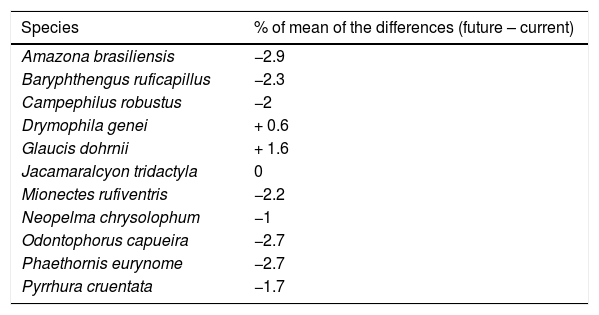
ResultsThe ecological niche models indicated that climate change will slightly reduce climatic suitability for eight species (from 1% to 2.9% per cell, on average), slightly increase climatic suitability for two species (from 0.6% to 1.6%) and will not affect climatic suitability for one species (Table 2). Considering both habitat suitability only (i.e. the original PC, or PC-only) and CLS (in which patch-level climatic suitability is applied as an additional attribute in the PC), most of the Atlantic Forest landscapes had low suitability values (Fig. 1). Additionally, the values obtained by the two habitat suitability approaches (i.e. CLS, and PCxclimate) were very similar (Table 1). The highest values of CLS were concentrated mainly in southeastern Atlantic Forest (Fig. 2 as an example, and Fig. S2).
Changes in climatic suitability for each species. The percentage values of the mean of the differences from continuous projections obtained by Student’s test t. Positive and negative values indicate increases and decreases in climatic suitability, respectively. The p-values were < 0.05 for all species.
| Species | % of mean of the differences (future – current) |
|---|---|
| Amazona brasiliensis | −2.9 |
| Baryphthengus ruficapillus | −2.3 |
| Campephilus robustus | −2 |
| Drymophila genei | + 0.6 |
| Glaucis dohrnii | + 1.6 |
| Jacamaralcyon tridactyla | 0 |
| Mionectes rufiventris | −2.2 |
| Neopelma chrysolophum | −1 |
| Odontophorus capueira | −2.7 |
| Phaethornis eurynome | −2.7 |
| Pyrrhura cruentata | −1.7 |
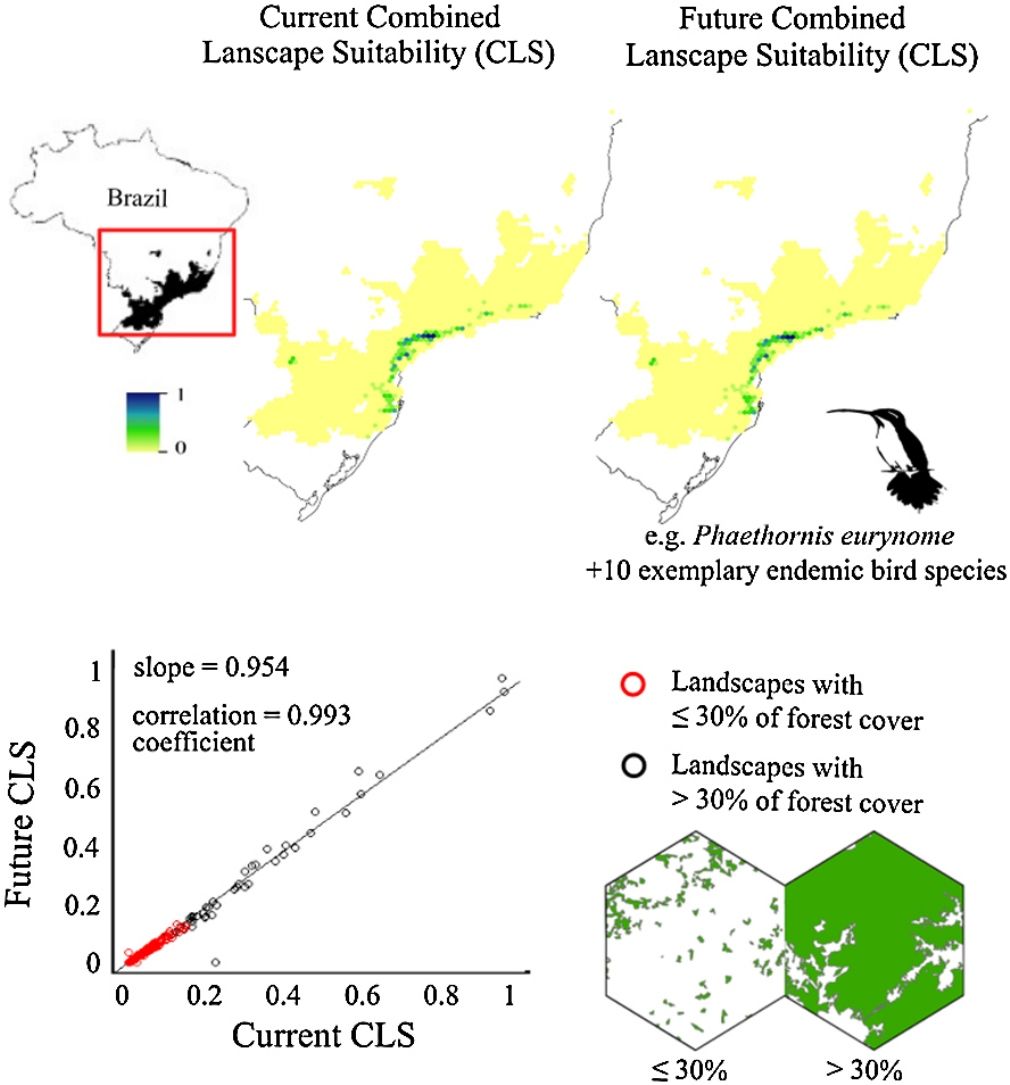
. Red dots represent landscapes with ≤30% forest cover; black dots represent landscapes with >30% of forest cover. The slope (b) and the correlation coefficient (r) are also shown. Pie-charts refer to forest cover proportion. Dark green represents the proportion of landscapes with ≤30% forest cover and light green represents the proportion of landscapes with >30% forest cover. See the pie-charts for the proportion of landscapes with ≤ and > 50% forest cover for all species in Fig. S4.")
Correlation between future and current combined landscape suitability (CLS). Red dots represent landscapes with ≤30% forest cover; black dots represent landscapes with >30% of forest cover. The slope (b) and the correlation coefficient (r) are also shown. Pie-charts refer to forest cover proportion. Dark green represents the proportion of landscapes with ≤30% forest cover and light green represents the proportion of landscapes with >30% forest cover. See the pie-charts for the proportion of landscapes with ≤ and > 50% forest cover for all species in Fig. S4.
 values between future and current scenarios. As an example of the 11 species of this study, it shows the distribution area of two species with extreme dispersal ability: a. Odontophorus capueira and b. Phaethornis eurynome. Each unit of the map is a landscape (hexagon of 50,000 ha), inside the Atlantic Forest in Brazil. As CLS ranged from 0 to 1, the change values could range from -1 to 1, although very low values were found. Due to the high similarity between current and future results, only current CLS maps for all 11 species are presented in Fig. S2.")
Change in Combined Landscape Suitability (CLS) values between future and current scenarios. As an example of the 11 species of this study, it shows the distribution area of two species with extreme dispersal ability: a. Odontophorus capueira and b. Phaethornis eurynome. Each unit of the map is a landscape (hexagon of 50,000 ha), inside the Atlantic Forest in Brazil. As CLS ranged from 0 to 1, the change values could range from -1 to 1, although very low values were found. Due to the high similarity between current and future results, only current CLS maps for all 11 species are presented in Fig. S2.
, with different forest amount (i.e. low, intermediate, and high), as examples. For each landscape, the values of current climatic suitability, future climatic suitability, Probability of Connectivity (PC), and Combined Landscape Suitability (CLS) are shown for two example species with extreme dispersal abilities: Odontophorus capueira (dispersal ability of ∼5 km) and Phaethornis eurynome (dispersal ability ∼658 m).")
Three representative landscapes (50.000 ha), with different forest amount (i.e. low, intermediate, and high), as examples. For each landscape, the values of current climatic suitability, future climatic suitability, Probability of Connectivity (PC), and Combined Landscape Suitability (CLS) are shown for two example species with extreme dispersal abilities: Odontophorus capueira (dispersal ability of ∼5 km) and Phaethornis eurynome (dispersal ability ∼658 m).
The current and future CLS values were highly correlated (r ≥ 0.996, Fig. 1). These patterns were consistent among species, despite the differences in their dispersal abilities and distribution ranges. The CLS change maps of Odontophorus capueira (∼5 km dispersal ability) and Phaethornis eurynome (∼658 m) are shown as two representative examples, considering their high and low dispersal abilities (Fig. 2). The change maps show very low values (almost all close to zero, with very few exceptions), showing little difference between current and future patterns (Fig. 2). The similarity between current and future suitability values can be seen by focusing on particular landscapes with different forest amount (i.e. low, intermediate, and high; Fig. 3). In these illustrative landscapes, current and future climatic suitability differ by less than 0.1, and PC-only and CLS (one of the examples of the combined approach) differ only by 0.05 or are the same when habitat amount is smaller than 30% or larger than 50%. The second approach to combine climatic and habitat suitability returned similar correlations as the first approach (Table 1). Therefore, the high correlations between current and future landscape suitability values hold regardless the method used to estimate landscape suitability.
The amount of forest cover in the landscapes had a strong effect on CLS. Landscapes with ≤ 30% forest cover had very low CLS (≤ 0.2 for the standardized CLS values), whereas landscapes with >30% of forest cover had both low, medium and high CLS (Fig. 1). Most landscapes inside species’ distribution ranges had ≤30% forest cover, except for Amazonas brasiliensis that had more than half of the landscapes >30% of forest cover (Fig. 1, Table S4). The results were even more discrepant when applying a 50% forest cover threshold (rather than 30%), with the vast majority of landscapes inside species’ distribution having ≤ 50% forest cover (Fig. S3, Table S4).
DiscussionOur results show that climate change is unlikely to substantially impact the suitability of landscapes for the 11 target endemic and forest-dependent Atlantic Forest bird species. Landscapes that currently have the highest climatic and habitat (i.e. habitat amount, patch size, and isolation) suitability and landscapes that currently have the lowest suitability are predicted to remain so in the future. These patterns are the same regardless of whether climatic suitability is quantified at the patch (CLS) or the landscape (PCxclimate) scale.
Most Atlantic Forest landscapes had low values for both climatic and habitat suitability approaches (at patch and landscape scales, Fig. 1, Table S4). The prevalence of low values reflects the critical situation of this biodiversity hotspot. The Atlantic Forest has suffered extensive habitat loss and fragmentation, and is currently dominated by small and highly isolated fragments (Rezende et al., 2018; Ribeiro et al., 2009; Rosa et al., 2021; Tambosi et al., 2014). As our metrics (CLS and PCs values) depend on species’ dispersal abilities, species with high dispersal ability would be expected to show high metrics values. However, even considering species with very low (e.g. 658 m for Phaethornis eurynome) and very high (e.g. ∼5 km for Odontophorus capueira) dispersal abilities, most landscapes had low metrics values, and the few high values were concentrated in the southeastern Brazilian coast. These results reinforce the patterns shown by Tambosi et al. (2014) and Vale et al.(2018), with higher environmental suitability in the southern and southeastern portions of the Brazilian coast (e.g. Fig. 2 and S2). These regions still have relatively high forest cover under continuous forest stretches, especially in mountain areas (Rezende et al., 2018).
The similarity between current and future climatic and habitat suitability, regardless of the spatial scale (habitat patch vs. landscape), occurred despite the differences among species in terms of functional traits, range sizes, and occurrence areas (Table S1). According to the literature, species that differ in these characteristics are expected to be impacted by climate change with different intensities (e.g. Jiguet et al., 2007; Manes et al., 2021; Vandewalle et al., 2010). Small-ranging species, for example, are expected to be more vulnerable to climate change than large-ranging species (Manes et al., 2021). Our set of species included birds with very different range sizes, such as Baryphthengus ruficapillus (2465 landscapes units, i.e. 1,232,500 km2) and Amazona brasiliensis (58 landscapes units, i.e. 29,000 km2), but that still did not show substantial differences between current and future estimates. The Atlantic Forest has a great latitudinal extent and diverse climates, with the northeast expected to become drier under future climate change, while the precipitation in the southeast is expected to increase (PBMC, 2013; Souza et al., 2014). Even species that occurred exclusively in either of these regions, such as Gaucis dohrnii in the northeast and Drymophila genei in the southeast, did not show differences between current and future suitability estimates. These results, although unexpected, reinforce the generality of the patterns found, in which species with different characteristics (i.e. traits, range size and latitudinal occurrence) showed similar current and future climatic suitability at landscape level.
It is important to note that we considered the same land cover scenario for the current and future periods. This decision was taken for three reasons. First, by using a same land cover map to represent current and future conditions, we were able to estimate the individual effects of climate change, alone, at the landscape scale. Second, there is no high-resolution land cover future maps depicting forest cover at patch and landscape scales. Third, no significant land-use changes are expected for the Atlantic Forest in the future (Câmara et al., 2015; Soterroni et al., 2018; Vaz et al., 2021; but see the optimistic expectation of increasing forest cover in Crouzeilles et al., 2019). Its forest cover has remained relatively constant for at least 30 years (Rosa et al., 2021). Despite suffering great human pressure (e.g. urbanization and agriculture, sometimes worsened by bad policy, Ferrante and Fearnside, 2019; Vale et al., 2021b), many reforestation actions are being carried out in the Atlantic Forest (e.g. due to Atlantic Forest Restoration Pact, Rodrigues et al., 2009; Brazil’s National Native Vegetation Recovery Plan, Brazil, 2017), resulting in a slightly net forest gain (Rosa et al., 2021). Even with the same land cover map, the two climatic and habitat suitability approaches (i.e. CLS and PCxclimate) presented no substantial difference between climate scenarios. Hence, this result suggests that habitat amount and structure are critical determinants of habitat suitability (i.e. great effect on CLS and PCxclimate), at least in the Atlantic Forest, a highly fragmented landscape.
In this context, conservation efforts capable of improving landscapes’ habitat amount and connectivity, for example via restoration, are essential to increase birds’ conservation and dispersal potential. Restoration efforts can be seen as an adaption strategy to climate change impacts on endemic birds and other species (Ramalho et al., 2021; Zwiener et al., 2017). Climate change adaptation can be defined as an “adjustment in natural or human systems in response to actual or expected climatic stimuli or their effects, which moderates harm or exploits beneficial opportunities” (IPCC, 2001). Fortunately, restoration as an adaptation tool to reduce the impacts of climate change has been one of the main strategies employed on Atlantic Forest (Crouzeilles et al., 2019; Rodrigues et al., 2009; Vale et al., 2021a, 2021b; see restored areas in observatoriodarestauracao.org.br). A recent study estimated that more than 1 million hectares of the Atlantic Forest have been restored, and the forecast for 2050 is of 15 million hectares, if the Atlantic Forest Restoration Pact is fulfilled (Crouzeilles et al., 2019; Rodrigues et al., 2009).
Although a few previous studies have considered land cover (habitat amount and structure) in combination with climate change, they were limited by an application at a regional or macro scale (e.g. Dilts et al., 2016; Gouveia et al., 2016; Scriven et al., 2015). The macro-scale approaches used in these studies provide an important broad overview of spatial conservation priorities and climate change impacts on species (e.g. Alagador and Cerdeira, 2018; Dilts et al., 2016; Gouveia et al., 2016; Scriven et al., 2015), but may ignore finer habitat and climatic patterns. Incorporating continuous climatic suitability and combining it with habitat amount and structure, at patch and landscape scales, has the advantage of revealing subtle but important variations. Although these variations were not conspicuous in our study (considering the species and region evaluated), they may arise in other contexts. Studies that assess climate suitability at fine scales (e.g. by remote sense data, available only for current scenarios; Alsamadisi et al., 2020; Lassueur et al., 2006; Sillero et al., 2021) could show a stronger pattern at the scales investigated here. Assessing the combined habitat suitability (CLS) at the landscape scale, in particular, can be crucial, as landscapes are ideal units for management and conservation actions (e.g. Arroyo‐Rodríguez et al., 2020; Lindenmayer et al., 2008).
The CLS represents a new contribution to understanding the combined effects of climate change and landscape structure on species. Although climate change impacts at patch and landscape levels were not evident for the Atlantic Forest, they might be relevant in other regions, enabling the ranking of habitat patches and landscapes based on climatic and habitat suitability. For Atlantic Forest endemic birds, our results suggest that climate change will contribute little to landscape prioritization for conservation. This finding, however, does not exclude potential impacts at regional and global scales, which have been widely reported in the literature (e.g Barbet‐Massin et al., 2012; Loiselle et al., 2010; Manes et al., 2021; Souza et al., 2011).
ConclusionTaken together, our results suggest that climate change is unlikely to modify relative habitat suitability for birds at a landscape scale. Therefore, our study adds to the growing perception that, in tropical regions, land-use changes may be a more urgent threat to biodiversity than climate change (e.g. Jetz et al., 2007; Scriven et al., 2015). Our results also highlight the critical situation of the Atlantic Forest biodiversity hotspot, with most landscapes having low suitability and forest cover, many below the extinction threshold of 30% suggested for birds and other taxa (Banks-Leite et al., 2014; Rezende et al., 2018). Considering that reforestation can improve habitat suitability and can offset the impacts of climate change (Ramalho et al., 2021; Rodrigues et al., 2009; Zwiener et al., 2017), this study reinforces the need to prioritize restoration efforts in the Atlantic Forest to increase habitat quality and quantity, while also acting as a climate change adaptation strategy (Zwiener et al., 2017).
We are thankful to Milton Cezar Ribeiro and Vinicius F. Farjalla for helpful comments on earlier versions of the manuscript. The authors have received support from Carlos Chagas Filho Foundation for Research Support of Rio de Janeiro State (FAPERJ), and National Council for Scientific and Technological Development (CNPq). This was supported by the Coordenação de Aperfeiçoamento de Pessoal de Nível Superior - Brasil (Coordination of Higher Level Staff Improvement - CAPES) [Finance Code001]. LT received a scholarship from CAPES and Fundação de Amparo à Pesquisa do Estado do Rio de Janeiro (FAPERJ) [E-26/200.247/2016]. MMV received support from MCTI/CNPq/FAPs PELD (34/2012), Conselho Nacional de Desenvolvimento Científico e Tecnológico (CNPq) [444704/2014,304309/2018-4] and FAPERJ [E-26/111.577/2014]. JAP was supported by FAPERJ (E-26/010.002334/2016 and E-26/010.000398/2016) and CNPq (424061/2016-3). This paper is a contribution of the Brazilian Research Network on Climate Change (Rede CLIMA/MCTIC) funded by CNPq [550022/20147] and FINEP [01.13.0353.00] and the National Institutes for Science and Technology (INCT) in Ecology, Evolution and Biodiversity Conservation, supported by MCTIC/CNPq[465610/2014-5] and FAPEG [201810267000023].
The following is Supplementary data to this article:

