


Optimizing research efforts for biodiversity monitoring is crucial to conservation projects and actions to increase our ability to inform conservation priorities. However, it requires the financial and human capacity. Euglossini bees have been used in monitoring actions as successful bioindicators. Yet, relationships among variables and stressors are complex and can change over time, environment, and local conditions. Here we investigated the influence of sample area on sampling to maximize the cost-benefit ratio of collection effort and the relationship from Euglossini bees with environmental predictors at a mesoscale (25 km2) in central Amazonia considering PPBio plots structure. We found differences considering the sampling unit scale, including capturing different assemblage species compositions. Most bee species were sampled along the phosphorus gradient. Due to the growth of deforestation in the Amazon Forest, especially in the so-called “Arc of Deforestation”, these bees could provide quick and valuable information about landscape quality. Here we present part of the pieces from a giant puzzle that we still need to complete to provide conservation efforts for this group. Our work highlighted the need to consider soil and nutrient variables other than vegetation and distribute scents traps in larger areas instead of in small plots.
Protecting biodiversity and predicting how vegetation and animal communities respond to negative impacts of human activities (e.g., landscape use and soil degradation) are key scientific topics in this century (Cardinale et al., 2012; Foley, 2005). Scientists must understand the patterns and processes in biological systems and develop assessment and evaluation procedures that assure the maintenance of biological resources (Yoccoz et al., 2001). That assessment must include direct biological monitoring (Lutter et al., 2018), which can provide information about species identity (where the data is absent or scarce), ecosystem process, and habitat conservation status. With science-budget cuts threatening even more conservation projects and actions (Kowaltowski, 2021; Malakoff, 2020), monitoring actions may compete for funds with many other activities related to biodiversity protection. Therefore, optimizing research resources is mandatory to increase spatial and temporal coverage of biodiversity monitoring.
Biodiversity monitoring must be sufficient to reflect fluctuations and trends in natural populations to increase our ability to inform conservation priorities (Jetz et al., 2019). This, however, is not simple or trivial as monitoring programs are usually designed to balance two main key points: the sampling area (extension) and resources (human and financial). The first point (extension) may reflect when sampling is enough, i.e., our capacity to sample populations or communities in the area, but often the decision about the sampling extension is related to financial or capacity building (i.e., the human capacity available to process the biological data) (Magnusson et al., 2005). This is particularly relevant for invertebrates in tropical regions since biodiversity studies are biased towards vertebrates and temperate regions (Titley et al., 2017).
Euglossine bees, also known as orchid bees, are ecologically important forest-dependent pollinators and thus significant components among pollinators of Neotropical forests. Orchid-bee conservation is considered vital for natural and semi-natural areas (Aguiar and Gaglianone, 2012; Brosi, 2009; Brosi et al., 2007). Since the discovery of aromatic-scent components attracting orchid bees in the 1960s (Dodson et al., 1969), this group is frequently used to assess environmental impacts. Orchid bees respond to stressful factors, such as forest fragmentation, and are sometimes considered good bioindicators of environmental quality (Aguiar et al., 2014; Aguiar and Gaglianone, 2012; Brosi, 2009; Carneiro et al., 2021).
The Amazon forest is reported to have the richest fauna and the highest levels of endemism of orchid bees (Nemésio and Silveira, 2007). Previous studies with this group indicate that some biotic, such as vegetation types and plant phenology (Aguiar et al., 2014; Zimmerman et al., 1989) or general abiotic variables, such as precipitation, altitude, temperature, or humidity (Zimmerman et al., 1989; Abrahamczyk et al., 2011; Andrade-Silva et al., 2012; Aguiar and Gaglianone, 2012; Aguiar et al., 2014; Giangarelli et al., 2015; Mateus et al., 2015), can be related to orchid-bee communities. However, relationships among variables and stressors can change over time, environment and local conditions (Belsky and Joshi, 2019; Polatto et al., 2014).
The Reserva Florestal Adolpho Ducke (Ducke Reserve), maintained by the Instituto Nacional de Pesquisas da Amazônia on the outskirts of Manaus, Amazonas, has been the focus of studies of diverse organisms (plants and animals) in recent decades (e.g., Castellani and Freitas, 1992; Hopkins, 2005; Lima and Magnusson, 2006). In general, the biodiversity of Reserva Ducke is tightly linked to its soil being acidic and poor in nutrients, such as phosphorus, calcium, and potassium (Chauvel et al., 1987). Thus previous studies dealing with population or community spatial structure included soil variables to investigate the spatial distribution of organisms in the Ducke Reserve (Aguiar et al., 2006; Costa et al., 2005; Guedes et al., 2021; Magnusson et al., 2005). Soil variables, such as phosphorus and the sum of bases, can influence nectar chemical composition and plant volatile compounds. However, although those variables have been investigated for other bee groups, such as Bombus and Apis, and plant communities (Nunes et al., 2015; Ceulemans et al., 2017), such aspects have not been used to assess the composition of orchid-bee communities. Understanding the landscape-scale distribution of bees can provide a more realistic scenario for conservation actions (Boscolo et al., 2017; Kremen and Ostfeld, 2005; Vickruck et al., 2021).
Understanding population patterns is important, but sampling must not cause depletion of individuals sufficient to threaten species. This is important for organisms already suffering declines due to anthropogenic disturbance, such as bees (Cane and Tepedino, 2001). Determining the sample size sufficient to investigate the relationships between local orchid-bee assemblages and abiotic factors associated with species distribution in the landscape is crucial for species conservation and optimizing monitoring programs. In this study, we investigated whether (i) the sampling area (plot, line or grid) affects diversity indices (richness, abundance and composition) of orchid-bee assemblages to determine the spatial distribution of sampling that maximizes the cost-benefit ratio of collection effort in surveys of orchid bees. We also (ii) investigated how orchid bees are related to environmental predictors (trees and palms species composition, soil phosphorus, and the sum of bases) at a mesoscale (25 km2) in central Amazonia. We predicted that orchid bees would be more related to plant composition variation (direct factor), than soil nutrients (indirect factors).
Material and methodsStudy siteThe surveys were carried out in Ducke Reserve, Manaus, Amazonas, Brazil (02°55′S, 59°59′W). The vegetation of the reserve is “terra-firme” forest and is not seasonally flooded. The terrain is undulating, with an altitudinal variation of 80 m between the plateau and the valleys. The reserve's climate is humid tropical, with a relative humidity of 75–86% and annual precipitation of 1.750–2.500 mm. The rainy season generally occurs from November to May, with March and April having the highest monthly rainfall. The “less rainy” season occurs from June to November, with September usually the driest month (Oliveira et al., 2008). The annual average temperature is 26 °C with slight thermal variation during the year, with the average monthly temperatures differing by less than 3 °C between the warmest and coolest months. The greatest temperature variation occurs throughout the day, reaching 8 °C (Oliveira et al., 2008).
Sampling designThe Ducke Reserve has a system of trails and permanent plots regularly distributed across the area maintained by the Biodiversity Research Program (PPBio) (Pezzini et al., 2012). The system of trails gives access to permanent plots regularly distributed at 1 km. The permanent plots are 250 m-long and follow the terrain contour line to minimize edaphic factors within plots (Pezzini et al., 2012).
We used a nested hierarchical design to investigate the effect of the sampling area on the diversity of orchid bees. We maintained the same daily and overall sampling effort between the three sampling scales: plot, line and grid. The plot was the smallest sample unit investigated and represented a 250 m transect that follows the terrain contour. For six consecutive days, we installed four scent traps at every 50 m in the L3-0500 plot, totaling 20 scent traps per day (Fig. 1). The scent traps consisted of adapted 2 L plastic bottles, with four funnel-shape entrances at each side (Campos et al., 1989). All scent trap were installed at ∼2 m height, and harboured only one aromatic compound (methyl salicylate, cineole, eugenol, and vanillin). Scent traps were installed in the early morning and revisited every 24 h to refresh the aromatic compounds and remove the bees collected. Given the daily visit and to avoid interference, no conservative liquid was used inside the bottles. We used the same daily effort (20 traps of four aromatic compounds) for sampling a 5 km grid line. On six consecutive days, we placed one trap of each aromatic compound in five plots along the L3 line, totaling 20 traps per day (Fig. 1). We repeated the same collection protocol for the entire grid. On five consecutive days, we deployed four scent traps (methyl salicylate, cineole, eugenol, and vanillin) in each plot of a 5 km line, but in this case, using different lines each day. In the end, the same collection effort per day was applied to each sample-size class. This procedure kept the sampling grain constant between line and grid samples and varied the scale between the three size classes. However, the plot samples represent a smaller grain and scale. Sampling was carried out in December 2005.
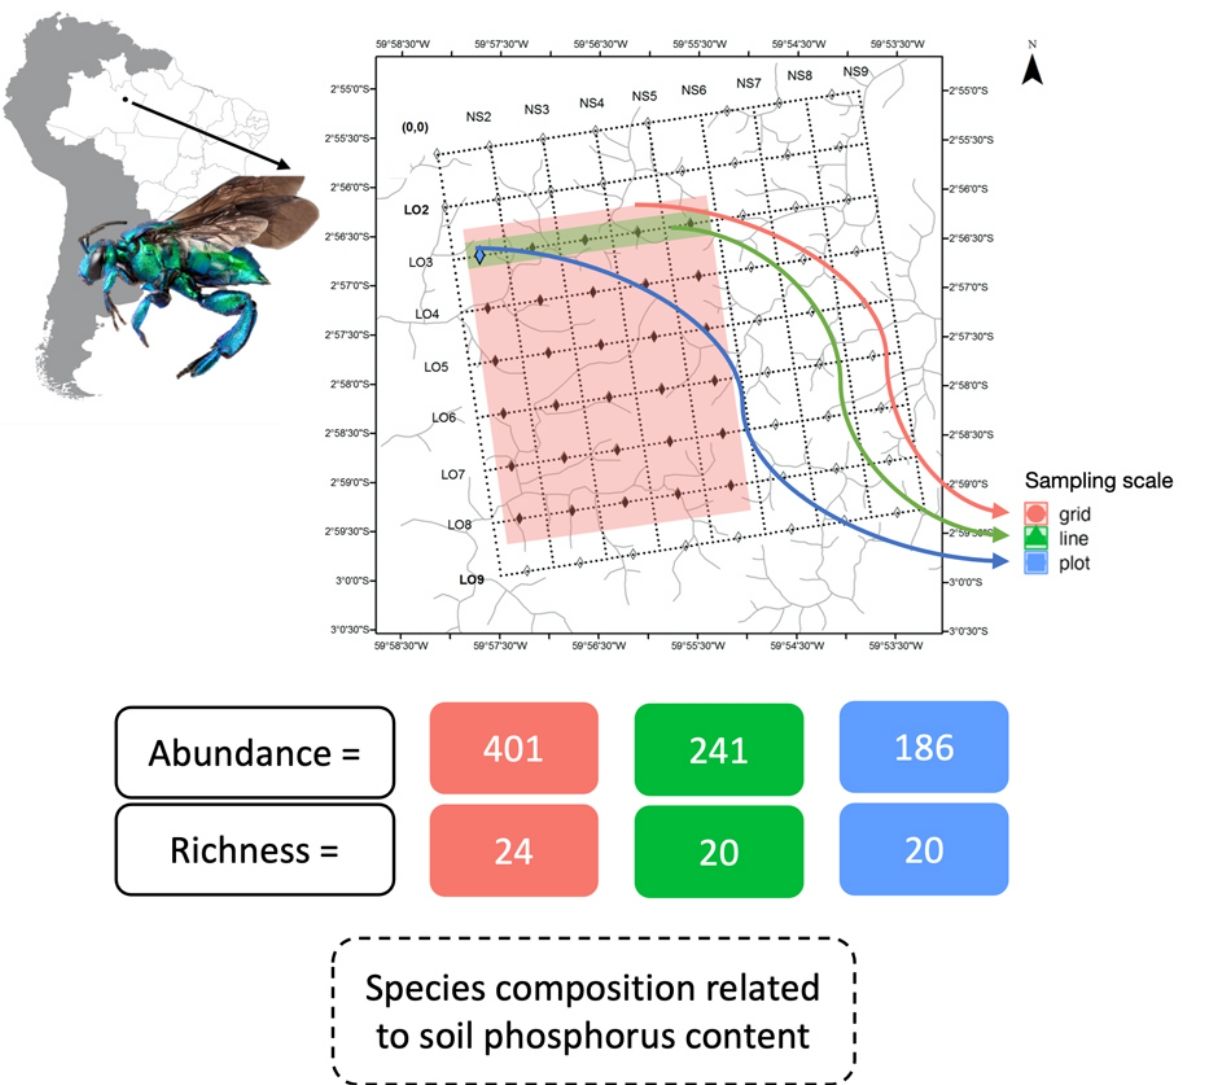
 (Pezzini et al., 2012). Sample coverage for the three sampling scales, grid, line, and plot. Grid is related to the entire pink filled area inside the square, the line is demonstrated by the green are inside square and plot to the blue square.")
Permanent plots at the Ducke Reserve related to Biodiversity Research Program (PPBio) (Pezzini et al., 2012). Sample coverage for the three sampling scales, grid, line, and plot. Grid is related to the entire pink filled area inside the square, the line is demonstrated by the green are inside square and plot to the blue square.
All the captured bees were identified to the lowest possible level and deposited in the Invertebrate Collection of the National Institute of Amazonian Research (INPA Collection) by the specialist Dr. Márcio Luis de Oliveira (INPA). We also compared the number of species collected in our samples with the overall records of orchid bees sampled from Ducke, deposited in the INPA Collection from 1956 until the implementation of the Biodiversity Research Program (PPBio) site (i.e., up to December 2005). All specimens deposited at INPA Collection were identified by the same expert (Dr. Marcio Luis de Oliveira), and all label information was digitalized.
Survey effort comparisonsWe used rarefaction curves based on Hill’s numbers (q = 0) to investigate the number of orchid bee species sampled at each scale (Chao et al., 2014). The rarefaction curves were calculated based on the abundance of individuals. We also estimated the sample completeness for each sampling scheme. This method compares species richness among methods by standardizing sampling effort by sample completeness (Chao and Jost, 2012). This metric varies between zero (no completeness) to 1 (all species were sampled). Confidence intervals (95%) and extrapolation to estimate species richness were calculated following Chao et al. (2014). We also evaluated the mean number of species and individuals for each sampling scale based on 999 bootstrap resamples of our sampling units. The bootstrap procedure ignores species identity and provides a reliable estimate of species and individuals number per sampling unit.
We used permutational multivariate analysis of variance (PERMANOVA), based on the Bray–Curtis distance, to compare orchid-bee composition between sampling scales (Anderson, 2001). We used post hoc pairwise comparisons between sampling scales with Holm’s method to control multiple-hypothesis tests. We calculated the p-values based on 999 permutations and used an NMDS to visualize the results. We also compared the sample composition heterogeneity between sampling scales using Multivariate Homogeneity of Groups Dispersions (BETADISPER) (Anderson, 2006). This analysis is a multivariate analogue of Levene's test for homogeneity of variances and was based on Bray–Curtis distance matrices. Post-hoc comparisons between sampling scales were made with Tukey’s Honest Significant Difference method.
We calculated the mean and 95% confidence intervals of orchid-bee abundance via 999 bootstrap permutations to investigate the possible depletion by consecutive sampling. While technically, there was no resampling at grid scale (each grid line was sampled only once), we used this statistic as a “control” for comparisons with plot and line sampling units, which were resampled on five consecutive days. All analyses were done in R (R Core Team, 2020).
Orchid-bee mesoscale distributionWe investigated the relationship between orchid-bee species composition and environmental predictors at mesoscale (grid covering 25 km2). We used the species composition of trees and palms, soil phosphorus, and the sum of bases as predictors of orchid bees. Male orchid bees collect floral perfumes (volatile lipids) produced in osmophores of many plant species, especially orchids (Cameron, 2004; Vogel et al., 1990). Palm and tree species were sampled in the same plots. Smaller trees (between 1 and 10 cm DBH) were sampled in an area of 4 m from the center line of the plots (∼0.1 ha). Trees and palms with >10 cm DBH were sampled at 20 m around the center line of each plot (∼ 0.5 ha), and larger trees with >30 cm DBH were sampled at 40 m around the center line (∼1 ha). For more details on plant sampling and identification, see (Costa et al., 2005; de Castilho et al., 2006; Schietti et al., 2014). We also used phosphorus and the sum of bases as an indirect predictor of orchid-bee species composition, as these variables are relevant for several plant taxa (Quesada et al., 2010; Zuquim et al., 2012). Phosphorus and the sum of bases were measured based on six soil samples collected every 50 m in each plot. The six samples were combined, dried and used for soil analysis. The phosphorus and sum of bases were measured following the EMBRAPA protocol (Teixeira et al., 2017). All predictor variables used here are available from the PPBio website (https://ppbio.inpa.gov.br) with detailed metadata.
To investigate whether plant species composition, phosphorus and sum of bases influence orchid-bee assemblage composition, we used a multivariate approach that uses a generalized linear model (GLM) framework to evaluate habitat-community relationships across all species (Wang et al., 2012). The manyglm function in the R package ‘mvabund’ fits GLM individually to each species and combines the results in a “assemblage” response (Wang et al., 2012). Plant species composition was summarized by the NMDS axis, based on the Bray–Curtis distance. We then constructed a manyglm model using the species occurrences as dependent variables and the plant species composition (NMDS axis solution), phosphorus, and sum of bases as independent variables. We estimated P values from 999 bootstrap resamples. The manyglm models were fitted with negative binomial error distribution to account for overdispersion. We checked the model fit by visual inspection of residuals.
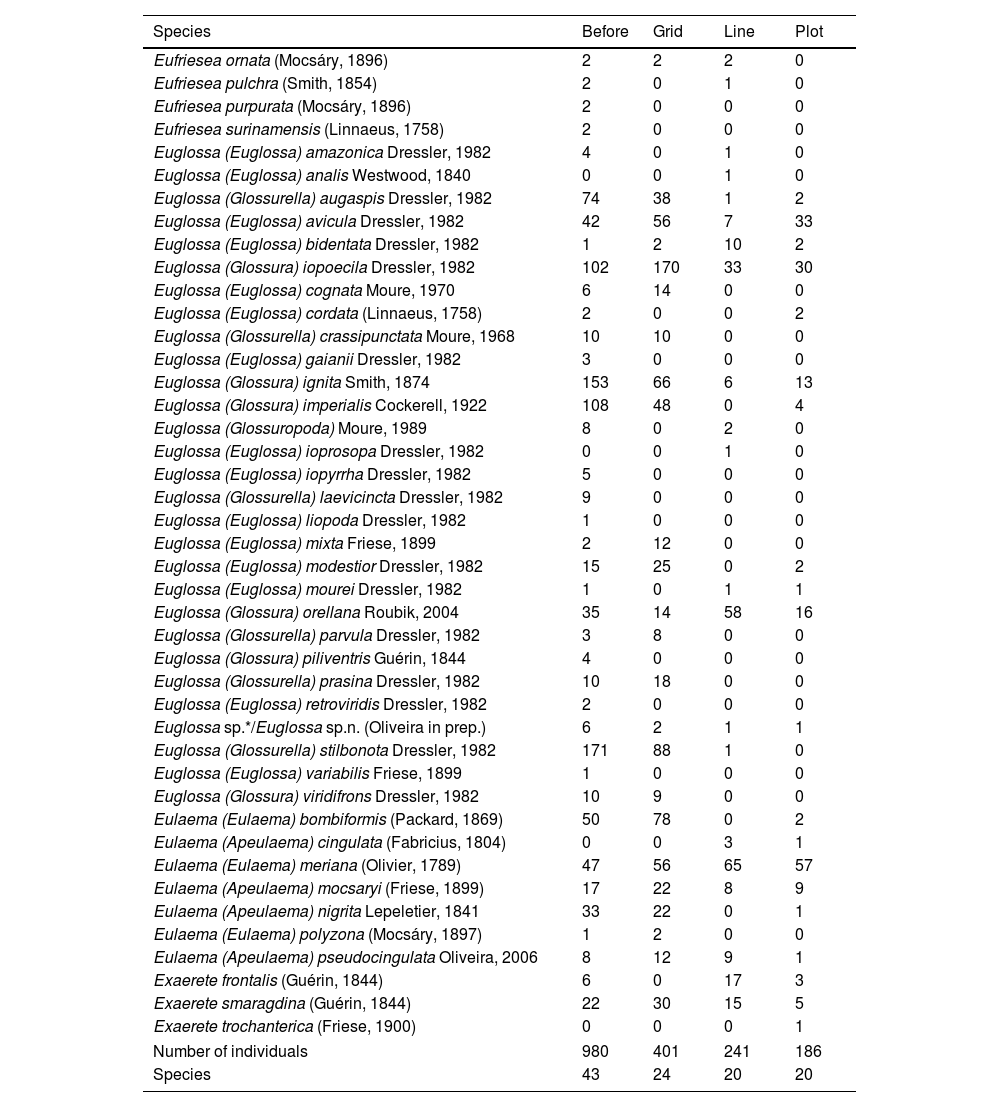
ResultsUsing the nested hierarchical design, we collected 828 individuals, which represents 84% of the individuals collected before the implementation of the Biodiversity Research Program (PPBio) site and deposited in the INPA Entomological collection (Table 1). The overall number of species sampled (34) was also high, representing 79% of the total number of species previously sampled and deposited in the INPA Entomological collection. Over the entire grid, we sampled a high number of individuals (401), but the number of species was similar on the grid, line, and plot (24, 20 and 20, respectively). However, some species were collected exclusively on the grid, line or plot (Table 1).
Species list sampled at Ducke Reserve before the implementation of the Biodiversity Research Program (PPBio) site and deposited in the INPA Entomological collection, and considering the nested hierarchical design: the entire grid, line and plot (from the largest to the smallest sample unit). Euglossa sp.*/Euglossa sp.n. (Oliveira in prep.) referred as Euglossa irisa, that was not described so far.
| Species | Before | Grid | Line | Plot |
|---|---|---|---|---|
| Eufriesea ornata (Mocsáry, 1896) | 2 | 2 | 2 | 0 |
| Eufriesea pulchra (Smith, 1854) | 2 | 0 | 1 | 0 |
| Eufriesea purpurata (Mocsáry, 1896) | 2 | 0 | 0 | 0 |
| Eufriesea surinamensis (Linnaeus, 1758) | 2 | 0 | 0 | 0 |
| Euglossa (Euglossa) amazonica Dressler, 1982 | 4 | 0 | 1 | 0 |
| Euglossa (Euglossa) analis Westwood, 1840 | 0 | 0 | 1 | 0 |
| Euglossa (Glossurella) augaspis Dressler, 1982 | 74 | 38 | 1 | 2 |
| Euglossa (Euglossa) avicula Dressler, 1982 | 42 | 56 | 7 | 33 |
| Euglossa (Euglossa) bidentata Dressler, 1982 | 1 | 2 | 10 | 2 |
| Euglossa (Glossura) iopoecila Dressler, 1982 | 102 | 170 | 33 | 30 |
| Euglossa (Euglossa) cognata Moure, 1970 | 6 | 14 | 0 | 0 |
| Euglossa (Euglossa) cordata (Linnaeus, 1758) | 2 | 0 | 0 | 2 |
| Euglossa (Glossurella) crassipunctata Moure, 1968 | 10 | 10 | 0 | 0 |
| Euglossa (Euglossa) gaianii Dressler, 1982 | 3 | 0 | 0 | 0 |
| Euglossa (Glossura) ignita Smith, 1874 | 153 | 66 | 6 | 13 |
| Euglossa (Glossura) imperialis Cockerell, 1922 | 108 | 48 | 0 | 4 |
| Euglossa (Glossuropoda) Moure, 1989 | 8 | 0 | 2 | 0 |
| Euglossa (Euglossa) ioprosopa Dressler, 1982 | 0 | 0 | 1 | 0 |
| Euglossa (Euglossa) iopyrrha Dressler, 1982 | 5 | 0 | 0 | 0 |
| Euglossa (Glossurella) laevicincta Dressler, 1982 | 9 | 0 | 0 | 0 |
| Euglossa (Euglossa) liopoda Dressler, 1982 | 1 | 0 | 0 | 0 |
| Euglossa (Euglossa) mixta Friese, 1899 | 2 | 12 | 0 | 0 |
| Euglossa (Euglossa) modestior Dressler, 1982 | 15 | 25 | 0 | 2 |
| Euglossa (Euglossa) mourei Dressler, 1982 | 1 | 0 | 1 | 1 |
| Euglossa (Glossura) orellana Roubik, 2004 | 35 | 14 | 58 | 16 |
| Euglossa (Glossurella) parvula Dressler, 1982 | 3 | 8 | 0 | 0 |
| Euglossa (Glossura) piliventris Guérin, 1844 | 4 | 0 | 0 | 0 |
| Euglossa (Glossurella) prasina Dressler, 1982 | 10 | 18 | 0 | 0 |
| Euglossa (Euglossa) retroviridis Dressler, 1982 | 2 | 0 | 0 | 0 |
| Euglossa sp.*/Euglossa sp.n. (Oliveira in prep.) | 6 | 2 | 1 | 1 |
| Euglossa (Glossurella) stilbonota Dressler, 1982 | 171 | 88 | 1 | 0 |
| Euglossa (Euglossa) variabilis Friese, 1899 | 1 | 0 | 0 | 0 |
| Euglossa (Glossura) viridifrons Dressler, 1982 | 10 | 9 | 0 | 0 |
| Eulaema (Eulaema) bombiformis (Packard, 1869) | 50 | 78 | 0 | 2 |
| Eulaema (Apeulaema) cingulata (Fabricius, 1804) | 0 | 0 | 3 | 1 |
| Eulaema (Eulaema) meriana (Olivier, 1789) | 47 | 56 | 65 | 57 |
| Eulaema (Apeulaema) mocsaryi (Friese, 1899) | 17 | 22 | 8 | 9 |
| Eulaema (Apeulaema) nigrita Lepeletier, 1841 | 33 | 22 | 0 | 1 |
| Eulaema (Eulaema) polyzona (Mocsáry, 1897) | 1 | 2 | 0 | 0 |
| Eulaema (Apeulaema) pseudocingulata Oliveira, 2006 | 8 | 12 | 9 | 1 |
| Exaerete frontalis (Guérin, 1844) | 6 | 0 | 17 | 3 |
| Exaerete smaragdina (Guérin, 1844) | 22 | 30 | 15 | 5 |
| Exaerete trochanterica (Friese, 1900) | 0 | 0 | 0 | 1 |
| Number of individuals | 980 | 401 | 241 | 186 |
| Species | 43 | 24 | 20 | 20 |
The shape of the species accumulation curves varied among the sampling areas. While the plot and line curves were steeply inclined, the species accumulation curve of the grid tended to asymptote (Fig. 2A). Despite the steeper species accumulation in the grid at the beginning (i.e., more species were sampled for the same number of individuals), the number of species sampled and expected between the three scales at maximum sampling effort showed high overlap (Fig. 2A). However, the sampling completeness was much better for the grid (0.96) than for line (0.87) and plot (0.86). Even after controlling the variation between the number of individuals sampled, the grid on average, sampled 10% more species than the other sampling schemes (Fig. 3B).
 Individual-based species accumulation curves and (B) Sample coverage for the three sampling scales, grid, line, and plot.")
 of bootstrap samples for the three sampling scales. The whisks represent 95% confidential intervals.")
The pattern was different at the sampling unit scale. The number of species and individuals per sampling unit on grid scale was higher than line and plot, which no difference among those last (Fig. 3). Interestingly, the variation in sampling grain did not affect the number of species and individuals sampled (plot and line comparison). In contrast, the sampling scale was important, with more individuals and species sampled at the grid scale.
Each sampling scheme (grid, line and plot) captured a different assemblage species composition, but the sampling heterogeneity was very similar between sampling areas (Fig. 4, Table 2). There is no clear evidence for male depletion, even for the plot scale. The number of sampled individuals varied between each sampling day, even for the grid, which was sampled at different plots every day (Fig. 5).

Pairwise summary statistic of Permutational Multivariate Analysis of Variance (PERMANOVA) and Multivariate Homogeneity of Groups Dispersions (BETADISPER) between the three sampling scales. Each analysis was based on 999 permutations and p-values were adjusted for multiple hypothesis testing.
| PERMANOVA | BETADISPER | |||
|---|---|---|---|---|
| pairs | F | p.adj | diff | p.adj |
| Grid vs Line | 11.440 | 0.006 | −0.071 | 0.434 |
| Grid vs. Plot | 6.585 | 0.006 | 0.008 | 0.988 |
| Line vs Plot | 2.977 | 0.007 | 0.079 | 0.357 |

Trees and palms species composition, estimated here as the NMDS ordination axis (Wald-value = 4.151; p = 0.544), and sum of bases (Wald-value = 4.438; p = 0.472) were not related with orchid bees composition. However, orchid bees species composition was related with soil phosphorus content (Wald-value = 7.088; p = 0.002). Most bee species were sampled along the phosphorus gradient, except for Eufrisea ornata, Euglossa parvula and Eulaema polyzona, which seem to be restricted to areas richer in phosphorus (Fig. 6). However, except for E. parvula, the other two species were sampled in only one plot and their association with areas with higher phosphorus content should be considered cautiously.
Discussion
Scent traps can be highly effective in collecting orchid bees, but the sample design must be as effective as possible without depleting organisms. As we observed in our study, we captured ∼80% of the orchid bee species deposited at the INPA Entomological collection using the grid sampling design, yet did not evidence a number of individuals captured during our sampling campaign. We noticed different assemblage compositions but similar composition heterogeneity between sample scheme. At mesoscale, orchid bee species composition was only related to soil phosphorus content, showing no pattern associated with palm and trees species composition. Those findings, especially the last, might shed some light on indirect effects of environmental variables on orchid bees species composition.
Euglossine bees are undoubtedly a relevant group for evaluating landscape effects, especially those related to monitoring conservation efforts or evaluating anthropic disturbances (Aguiar et al., 2014; Aguiar and Gaglianone, 2012; Brosi et al., 2007; Carneiro et al., 2021). The possibility to collect those male bees by standardized and efficient sampling made possible a substantial amount of data related to their distribution, diversity, and abundance. Very few works analyzed the sufficiency of a sample scale and the relation of orchid bees’ composition with the environment. Our results with a standardized protocol reveal that although the number of estimated species richness overlaps, the sampling coverage was higher for the grid compared with the other sampling schemes. The grid design was also more effective ignoring the species identity, suggesting that distributing the traps in larger areas collects more species and individuals per trap than concentrating the same number of traps on trails or plots. Thus, collecting along the grid was more efficient than focusing the collection effort on a trail or plot.
The males of orchid bees have a high detection ability being highly attracted to aromatic scents. Although it is not entirely clear the maximum distances at which those bees can detect bait essences, evidence was found that they can achieve flight distances from up to 50 km (Pokorny et al., 2015), yet, their ability to cross open areas is limited requiring conservated landscape areas instead of isolated patches (Powell and Powell, 1987). The high attractiveness of scent traps could lead us to think that leaving traps for many days or in places that do not favor the displacement of pollinators could decrease bee populations in an area. We did care about this data, yet fortunately, our results do not indicate this pattern. There is variation in the number of bees captured over the five consecutive days, but there is no clear decreasing trend. The number of sampled individuals was similar among sampling schemes, even for the grid, which was sampled at different plots every day. It is possible that the high dispersion ability acted to minimize the depletion effect. The high dispersion capacity of some species, associated with the high detection power, may maintain the number of individuals sampled daily. Thus, this seems to be an efficient method that may have limited effects on the population level during short periods (five days) of continuous sampling.
We also evidenced that correlations between bees and environmental variables are not always obvious and can be site-specific. Previous works correlated the orchid bee assemblages with different variables such as flowering plants or local physiognomies (Ackerman and Roubik, 2012; Aguiar and Gaglianone, 2012; dos Santos et al., 2020), temperature, altitude, precipitation, and elevation (Aguiar and Gaglianone, 2012; Armbruster and Berg, 1994; Armbruster and McCormick, 1990; dos Santos et al., 2020). Our study did not find an association between bee assemblage composition with trees and palm species composition. Instead, we found an association with the soil phosphorus content. At the Reserva Ducke, soil variables shape the local-scale distribution of many animals and plants communities and thus is a promissory site-specific variable (Aguiar et al., 2006; Costa et al., 2005; Guedes et al., 2021; Magnusson et al., 2005).
Other nutrients, including phosphorus, have already been investigated for other bee groups such as Bombus and Apis (Ceulemans et al., 2017; Nunes et al., 2015). Ceulemans et al. (2017) found that artificial nutrient enrichment was associated with altered nectar and pollen chemical composition, increasing larval mortality of Bombus. As far as we know, the relationship between soil phosphorus content and orchid bee composition was never related before. As phosphorus was the most relevant predictor, future works should try to understand the possible causality with the orchid bees and the mechanisms between them.
In our study area, phosphorus evidenced differences in some species’ occurrence patterns. E. ornata, E. polyzona, and E. parvula are restricted to richer phosphorus areas. However, the first two were sampled in one plot, and all three species had fewer sampled individuals. It is common for crop plants to use phosphorus application to increase productivity; however, its effects are far beyond soil and plant; bee visits are augmented by this relationship as nectar can be more attractant (Karunakaran et al., 2021; Vaudo et al., 2022). In native plants, we could expect the same relationship due to this high bee dependence on vegetation due to the use of resources (nectar, pollen) or microclimate conditions (temperature, humidity) (Polatto et al., 2014; Prado et al., 2021) the phosphorus variation may influence the foraging patterns of male orchid bees. Nevertheless, phosphorus availability is particularly low in central Amazonia (Quesada et al., 2010). Our results reinforce that slight changes in edaphic variation would result in disproportionately more significant indirect or direct effects on vegetation dynamics (Cunha et al., 2022).
The community structure of male orchid bees in the Neotropics follows the general pattern in which there are many individuals from a few species and a large number of species represented by only a few individuals (Janzen, 1971; Nemésio and Silveira, 2007; Sofia and Suzuki, 2004). Thus, optimizing the sampling effort is crucial for this group's preservation. It is also essential to consider that landscape can be perceived differently by the different species of orchid bees, as some species can act as bioindicators of environmental quality or degraded areas (Peruquetti et al., 1999). We still lack known orchid bees’ distribution in Central Amazon and how this group relates to landscape effects or environmental quality. Due to the growth of deforestation in the Amazon Forest, especially in the so-called “Arc of Deforestation,” these bees could provide quick and valuable information about landscape quality (Roubik and Hanson, 2004; Tonhasca et al., 2002). We thus need much more information regarding orchid bees to provide conservation efforts for this group. Our work highlighted the need to consider soil and nutrient variables other than vegetation and distribute scents traps in larger areas instead of in small plots.
We thank ML Oliveira for performing field work as well as bee identification. We thank the anonymous reviewers for their careful reading of our manuscript and their many insightful comments and suggestions. F. Baccaro and W. E. Magnusson have a productivity grant from CNPq.

