
Understanding the effects of habitat loss and fragmentation on species spatial distribution is challenging, mainly because knowledge of species occurrences is biased. Survey efforts are unevenly distributed causing spatial sampling biases that are normally neglected. Assessing sampling bias is particularly urgent for threatened ecoregions, such as the Atlantic Forest, a global biodiversity hotspot. Here, we assess spatial sampling biases of small rodents in the Atlantic Forest, using an integrative approach with accessibility and landscape metrics. We built a robust dataset of 11,495 primary records of the Atlantic Forest’s small rodent species, based on information from digitally accessible repositories. We expect that well-sampled sites are spatially aggregated and nearer roads, urban centers, on landscapes with larger forest fragments, and with higher percentage of forest cover. We also expect gaps of small rodents sampling in rare landscape conditions. Our results indicated that only less than 1% of the Atlantic Forest (at 1 km2 cell-size resolution) are well sampled. Following our expectations, the well-sampled sites were spatially aggregated biased toward roads, urban centers, larger forest fragments, and landscapes with higher percentage of forest cover. We also found a survey gap on common landscape conditions. Our findings suggest that the spatial distribution of small rodents at landscape level (1 km2) remains unknown across most of the Atlantic Forest spatial extension. Our findings also point to new priority sites for small mammals sampling on common landscape conditions, in smaller fragments and on remote areas improving spatial distribution knowledge and contributing to conservation policies at landscape level.

Human-induced activities have modified landscapes, directly affecting the spatial distribution of species worldwide (Ceballos and Ehrlich, 2002; Chase et al., 2020). Natural habitat modification may cause defaunation (Dirzo et al., 2014), and species population declines or extinctions (Dirzo and Raven, 2003; Hanski, 2011). Understanding how human-induced habitat changes drive biodiversity loss is still a challenge for science because of the several gaps in biodiversity knowledge that need to be better understood and quantified (Hortal et al., 2015).
Primary biodiversity data on species occurrences are still scarce or spatially biased (Girardello et al., 2018). The Wallacean Shortfall is characterized by uneven distribution of sampling effort over time and space, because some localities are temporally more sampled while many others remain unsampled, generating a spatially clustered pattern in biodiversity knowledge (Hortal et al., 2015; Almeida et al., 2021; Sobral-Souza et al., 2021a). Though, Wallacean Shortfall is dependent on the spatial scale and cell-size resolution of sampling effort assessment (Hortal et al., 2015; Bosco et al., 2022). Bias at local scale normally occurs because sampling tends to be performed close to access routes, whether in terrestrial or aquatic ecosystems (Sousa-Baena et al., 2014; Oliveira et al., 2016), and close to urban centers (Lessa et al., 2019; Almeida et al., 2021). Besides accessibility-related biases, landscape-based biases lead to greater sampling near large and connected forest fragments (Sobral-Souza et al., 2021a), or in protected areas (Almeida et al., 2021). These biases can be explained by the interest of researchers in sampling a greater number of species (Reddy and Dávalos, 2003; Sastre and Lobo, 2009) in a shorter temporal period, especially in intensively modified landscapes.
Global initiatives have emerged to address the problems of limited biodiversity data and their quality, such as making such data available on digitally accessible platforms (e.g., Global Biodiversity Information Facility - GBIF and speciesLink). Digital biodiversity knowledge has been important for understanding patterns of the spatial distribution of biodiversity; however, data gaps and biases can compromise the interpretation of large-scale biodiversity patterns (Hortal et al., 2007), thereby confounding conservation actions (Brooks et al., 2004; Sousa-Baena et al., 2014). Spatial bias can also distort estimated spatial patterns in biodiversity (Hortal et al., 2008; Boakes et al., 2010; Yang et al., 2013) and hinder the use of niche-based modeling techniques (Hortal et al., 2008), which also emerged as a technique to solve the problem of limited biodiversity data (Beck et al., 2014; Rocchini et al., 2011). Shortcomings of biodiversity data are most prominent for high impacted and biodiverse ecoregions, such as the global biodiversity hotspots.
The Atlantic Forest is one of the global biodiversity hotspots (Myers et al., 2000) yet, it still has limited biodiversity knowledge (Collen et al., 2008; Dirzo et al., 2014). The Atlantic Forest is the most studied Brazilian ecoregion due to its history of colonization, natural resources exploitation, its richness of endemic species, as well as the presence of large urban centers with several research institutions (Teixido et al., 2020; Candelária et al., 2021). Even so, biodiversity knowledge of the Atlantic Forest is biased for some regions (Sobral-Souza et al., 2021a). Testing the biases and gaps in biodiversity knowledge of the Atlantic Forest using well resolved taxonomic groups, with extensive information of species distributions and sampling inventories such as small rodents, can help improving conservation strategies for the taxonomic group and the ecoregion.
Small rodents are widely distributed (Wilson and Reeder, 2005) and considered a diverse taxon in the Atlantic Forest, with 94 described species (Bovendorp et al., 2017; Galindo-Leal and Câmara, 2003). Ordinarily, small rodent species are generalists and can occupy different habitat types (Bonvicino et al., 2008). They may also respond differently to local habitat changes (Bergallo et al., 2005; Rosa et al., 2018), because they are dependent on habitat quality (Delciellos et al., 2016). Even though the Atlantic Forest is the most surveyed ecoregion for small rodents in Brazil (Candelária et al., 2021), sampling bias and spatial gaps have not yet been assessed.
In fact, problems of biodiversity data quality and quantity occur in all domains of ecology (Hortal et al., 2015). Therefore, identifying gaps and biases in biodiversity data is important for indicating priority areas for sampling that can help better understand large-scale biodiversity patterns. Here, we assess spatial biases and gaps in Atlantic Forest’s small rodent species occurrence data. Specifically, we quantify biodiversity knowledge of small rodents to test the hypothesis that accessibility and landscape structure explain sampling biases and gaps. We expect that small rodent surveys are spatially biased towards more accessible regions close to urban centers and roads, a pattern found for other taxa (e.g., Oliveira et al., 2016 – for different taxa groups, Sobral-Souza et al., 2021a, for butterflies). Small rodents can respond relatively fast to landscape changes (e.g., Pardini, 2004; Püttker et al., 2008), therefore they are good models for testing hypotheses related to biodiversity and species loss. In macroecological perspectives, higher forest cover and more connected remnants are commonly more sampled than others (Sobral-Souza et al., 2021a). Thus, we expect to find more surveys in larger fragments (ha) and in landscapes with greater forest cover. Currently, Atlantic Forest's landscapes comprise mainly small fragments far from each other (Vancine et al., 2024), landscape heterogeneity is very common (Carvalho et al., 2021). Thus, we also expect gaps of smalls rodents’ sampling in common landscape conditions, i.e., landscapes with small fragments and smaller forest cover.
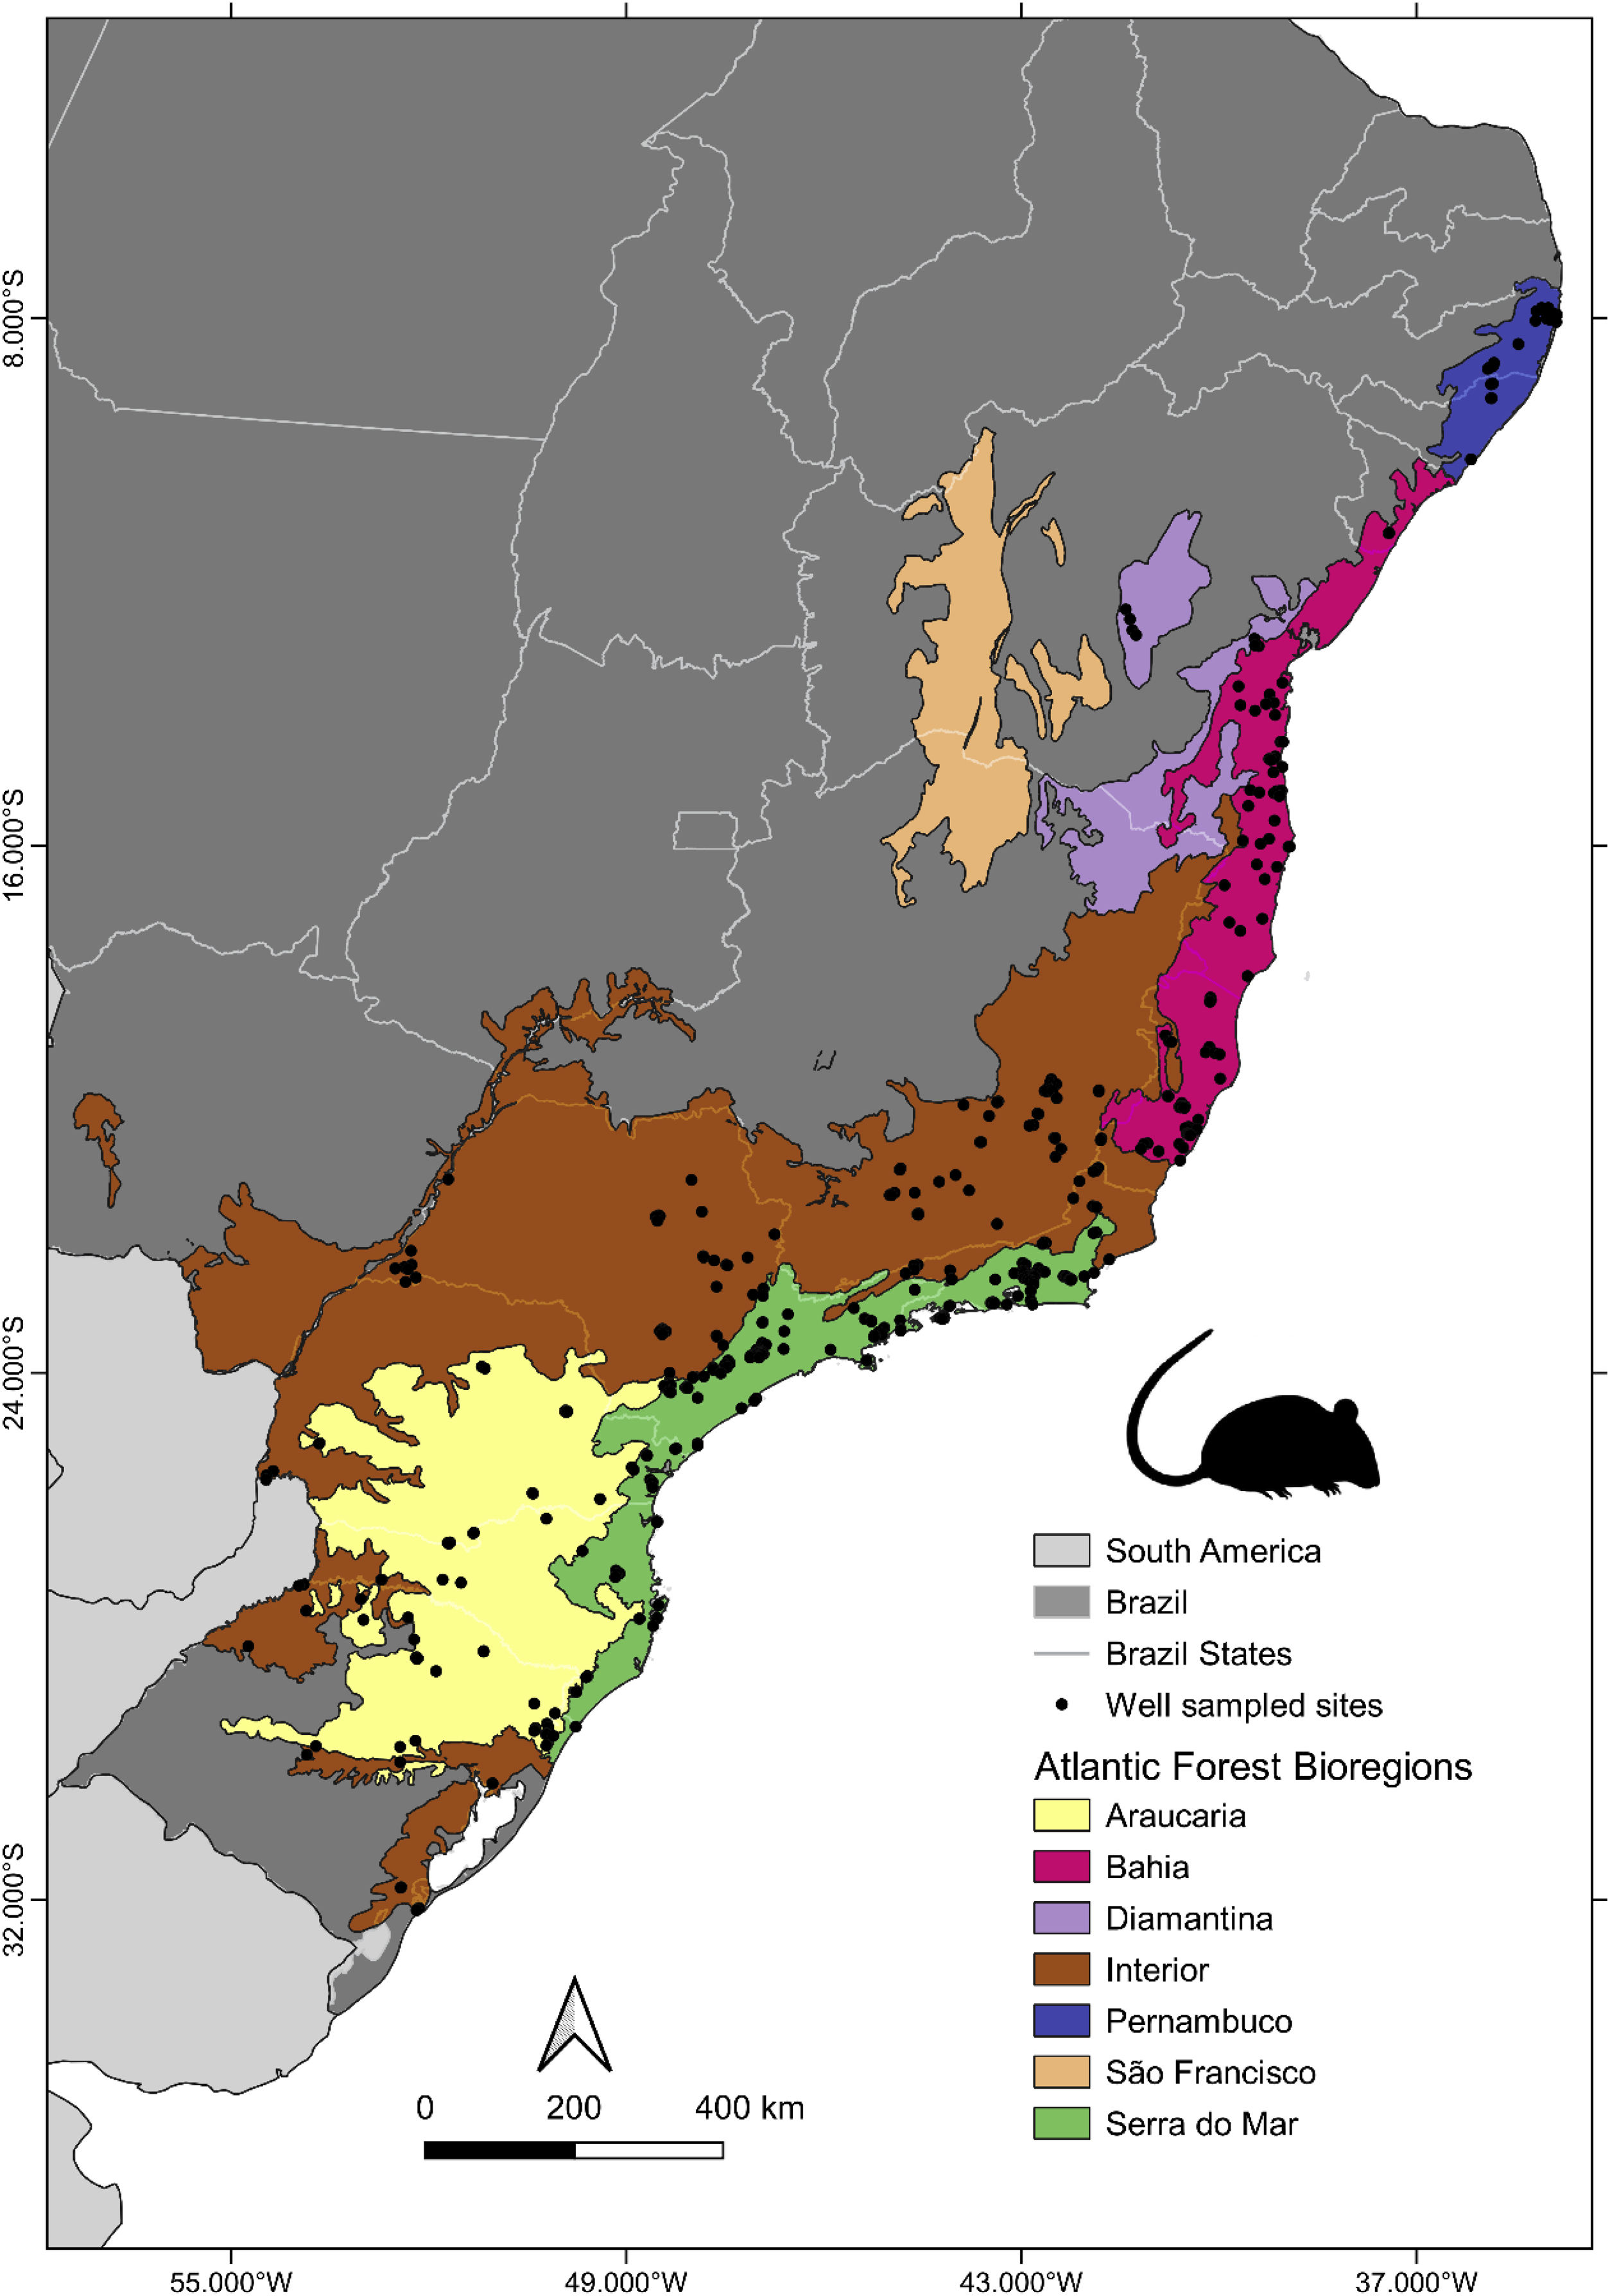
Material and methodsStudy areaThe Atlantic Forest extends along the Brazilian coast, from the northeast to south, and a small part of Paraguay and Argentina in the southwest (Ribeiro et al., 2009; Tabarelli et al., 2010). The historical and geological context of the Atlantic Forest explains its environmental heterogeneity, which has contributed to its high species richness and rates of endemism (Ribeiro et al., 2009). Silva and Casteleti (2003) proposed biogeographic subdivisions for the Atlantic Forest, namely: Serra do Mar, Pernambuco, Bahia, Northeastern Brejos, Diamantina, Interior Forests, Araucaria Forests and São Francisco. These subregions are characterized by the presence of two or more endemic species with overlapping spatial distributions or by the specificities of some habitats (Silva and Casteleti, 2003). Currently, 28 % of the Atlantic Forest is composed of small and isolated forest remnants (Rezende et al., 2018). The Serra do Mar is the most conserved biogeographic subregion (about 36.5% of remaining forest area), while the Interior and São Francisco subregions are the most deforested (<8% of forest area remaining; Ribeiro et al., 2009).
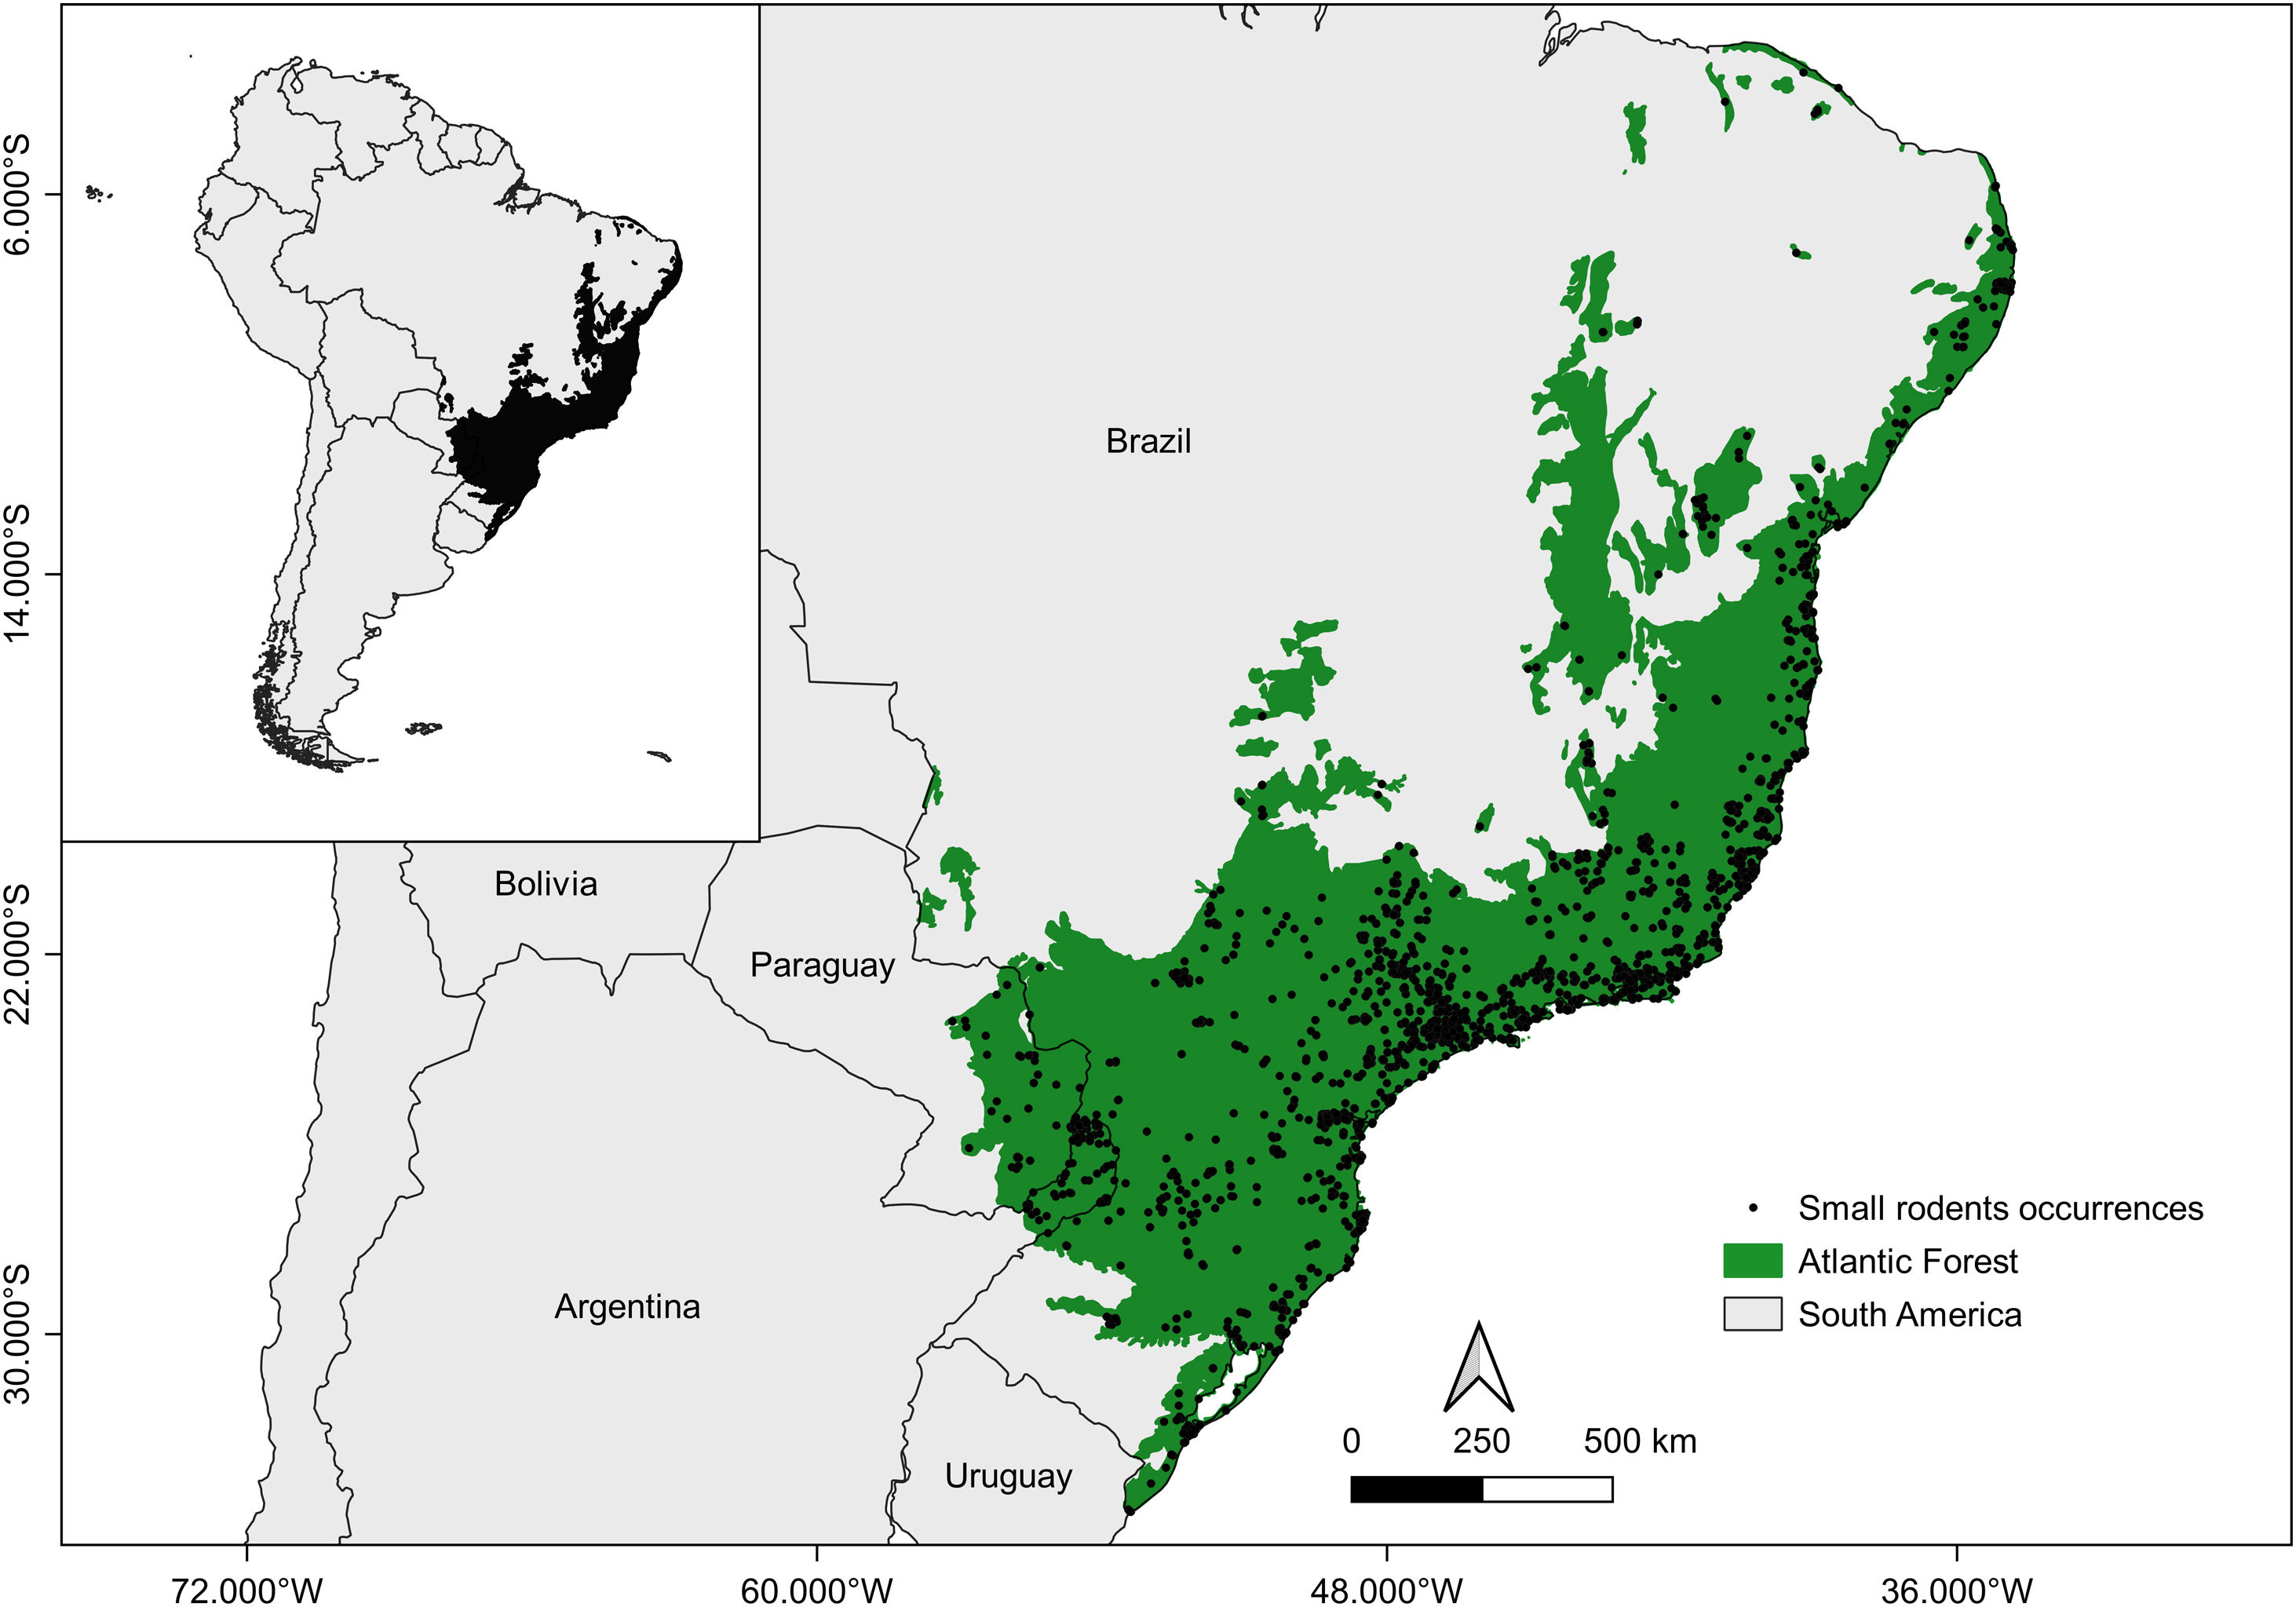
Species datasetWe built a dataset containing primary records of small rodent species of the families Caviidae, Cricetidae, Ctenomyidae, Echimyidae, Erethizontidae, Muridae and Sciuridae. The primary records were obtained from different digitally accessible databases Global Biodiversity Information Facility (GBIF 2021- DOI https://doi.org/10.15468/dl.bnbeqo), speciesLink (2021), Information System on Brazilian Biodiversity (Sistema de Informação sobre a Biodiversidade Brasileira - SiBBr 2021) and Biodiversity Portal (Portal da Biodiversidade - PortalBio 2021). We also used two published databases, Bovendorp et al. (2017) and Figueiredo et al. (2017), that compiled information on richness and abundance of non-flying small mammals from scientific articles, theses and unpublished data. Additionally, we included the primary records of six invasive small rodents' species from the Neotropical Invasive Mammals database (Rosa et al., 2020). After, we filtered the primary records based on: i) taxonomic accuracy, and removed all the records not identified to species level ; ii) spatial accuracy, and excluded sites outside the Atlantic Forest boundaries (Muylaert et al., 2018a), or lack of georeferenced information; iii) duplicate records, and removed occurrences with identical georeferenced sites, dates, voucher numbers, or included in two or more datasets accessed by us; and iv) primary data sampled after years 2000, and excluded data sampled before 2000, due to the low changes in land use and the stability of the road network after this period. We checked and corrected synonyms and current taxonomy using the ASM Mammals Diversity Database of the American Society of Mammalogists (ASM, https://www.mammaldiversity.org/), Wilson and Reeder’s Mammal Species of the World, 3rd edition (MSW3, http://www.departments.bucknell.edu/biology/resources/msw3/), and Patton et al. (2015). In total, our final dataset contained 11,495 primary records (Fig. 1).
. The thumbnail map depicts the Atlantic Forest (dark area) in South America.")
Spatial distribution of small rodents’ occurrences compiled for the Atlantic Forest (shapefile from Muylaert et al., 2018b). The thumbnail map depicts the Atlantic Forest (dark area) in South America.
To assess sampling biases and gaps we used survey completeness analysis, that helps identify well-sampled sites at a given spatial resolution and extension (Lobo et al., 2018). We calculated the completeness for cells with 1 km2 spatial resolution within the boundaries of the Atlantic Forest (Muylaert et al., 2018a). We chose this spatial resolution because landscape structure and configuration have been shaped by changes in land-use that occur and affect ecological processes at smaller spatial scales (Benítez-López et al., 2010; Sobral-Souza et al., 2021a).
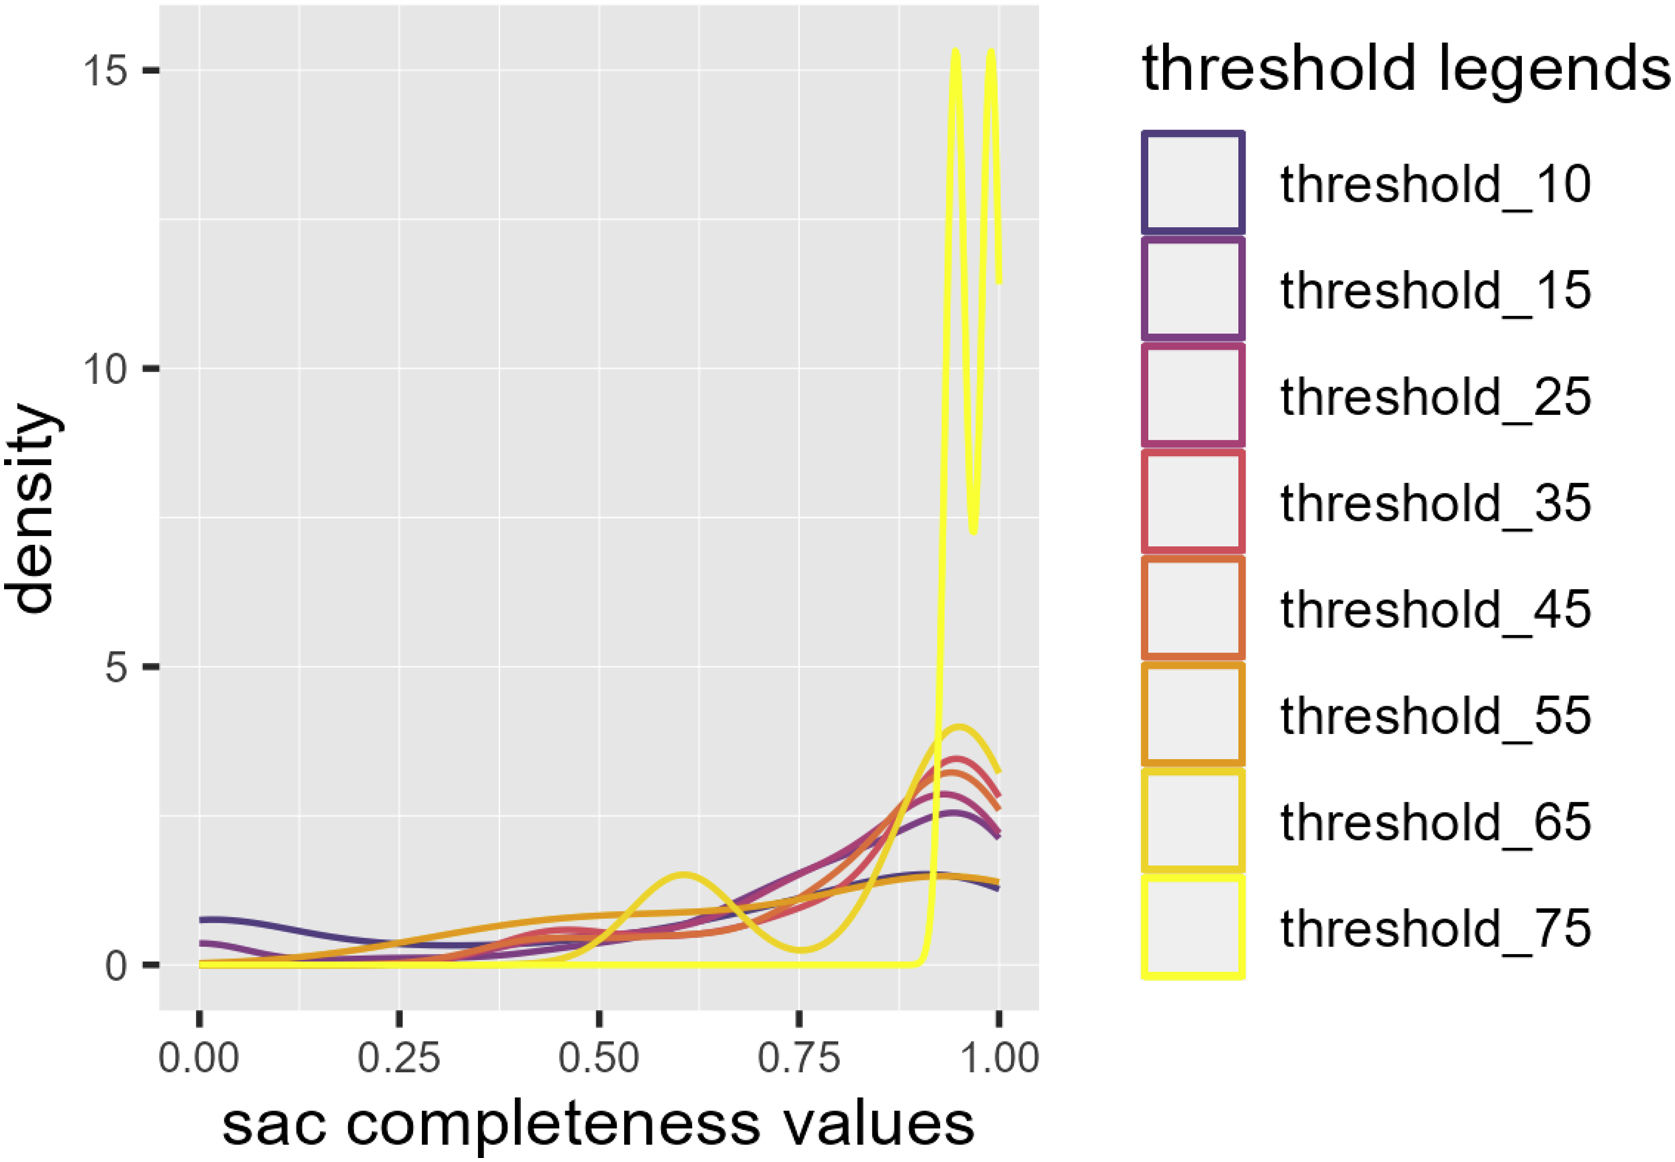
To account for the effect of the minimum number of records and cell-size resolution on survey completeness (Tessarolo et al., 2021; Bosco et al., 2022), we performed a sensitivity analysis with different thresholds (minimum number of records) for a cell to be considered well-sampled (see Fig. 2). We set the minimum threshold at 20 occurrences for survey completeness calculation, which represented a balance between the risk of high completeness due to low occurrences, and sufficient data representation (Fig. 2).

Then, for cells with more than 20 occurrences, we calculated survey completeness as the ratio between observed and predicted numbers of species. The predicted number of species for each 1 km2 cell was derived from a species accumulation curve generated using the Clench function of the KnowBr package (Lobo et al., 2018) implemented in R 4.3.1 (R Development Core Team, 2021). Survey completeness ranges from 0 to 1, with 0 being no survey and 1 being maximum survey completeness. We considered as well-sampled sites those with survey completeness equal to or greater than 0.7 (see Hortal and Lobo, 2005; Lobo et al., 2018; Sobral et al., 2021a; Bosco et al., 2022). We calculated how many individuals can be captured in a 1 km2 cell of the Atlantic Forest filtering the sampling effort for an area of 1 km2 and calculating the average number of individuals captured per locality in the Atlantic Forest database. We found that 20 records represent 10% of the number of individuals sampled in our dataset.
Spatial biasWe assessed spatial bias of the well-sampled sites based on accessibility and landscape metrics. For accessibility, we used the Euclidean distance of the sampling site to the nearest road (m) and to the nearest urban center (m). To obtain the distance to roads, we used the shapefile of federal and state paved roads of the National Department of Transport Infrastructure (Departamento Nacional de Infraestrutura de Transportes - DNIT). For urban centers, we used the shapefiles of urban areas of the Brazilian Foundation for Sustainable Development (Fundação Brasileira para o Desenvolvimento Sustentável - FBDS), the Brazilian Institute of Geography and Statistics (Instituto Brasileiro de Geografia e Estatística - IBGE), and the SOS Atlantic Forest Foundation (Fundação SOS Mata Atlântica).
We also used fragment size (ha) and percentage of forest cover (%) to assess how landscape configuration and composition can influence spatial biases and gaps in small rodent sampling. For this we used the shapefiles of landcover of the Fundação Brasileira para o Desenvolvimento Sustentável (FBDS), Fundação SOS Mata Atlântica, Instituto Nacional de Pesquisas Espaciais (INPE), and the University of Maryland (Global Forest Change Project, Hansen et al. 2013.) Fragment size was calculated as the sum of the forest area (in hectare) of each cell. To infer forest cover (%) for each cell, the proportion of forest within a square window of 30 m, centered in the focal cell, was calculated (=amount of vegetation cells/total number of cells in the window). Thus, forest cover (%) varied between 0 and 100%. All metrics were calculated at a resolution of 30 m × 30 m and adjusted for 1 km2. Detailed descriptions of landscape data can be found in Sobral-Souza et al. (2021a,2021b).
We built a landscape rarity map using the methods proposed by Sobral-Souza et al. (2021a). Briefly, we first performed a PCA analysis to synthetize forest percentage cover, fragment size and functional connectivity into a 2D multivariate environment axis. Then, we inferred the frequency of each PCA axis condition in an environmental space defined by 0.25 × 0.25 km grid-cells. We standardized the PCA axis (z score standardization) to vary between 0 and 1, where values near 1 represent rare landscape environmental conditions that occur in a unique or few grid cells or sites. In contrast, values close to zero indicate common landscape conditions that occur in many sites of the Atlantic Forest. To analyze whether well-sampled sites provided a representative subset of the overall landscape variation and encompassed regions of rare landscape conditions (Sobral-Souza et al., 2021b), we compared the frequencies of rarity landscape conditions of all Atlantic Forest and well-sampled cells using Komolgorov-Smirnov test. We also tested accessibility bias towards the well-sampled sites. We compared the frequency of the distance to the nearest road for the entire Atlantic Forest extension with the frequency of distance to nearest road for the well-sampled sites based on Komolgorov-Smirnov test. We used the same procedure to compare the frequency distribution of distance to nearest urban center for the entire Atlantic Forest with that of the well-sampled sites. For the landscape conditions we compared the frequency distribution of fragment size for the entire Atlantic Forest with the frequency distribution of fragment size of the well-sampled sites. We used the same procedure for forest cover (%), comparing the frequency distribution of forest percentage of the entire Atlantic Forest with that of the well-sampled sites.
Finally, we used Komolgorov-Smirnov test to infer the difference between the frequency of the entire Atlantic Forest landscape conditions and the landscape conditions of well-sampled sites, and then for each of Atlantic Forest biogeographic regions proposed by Silva and Casteleti (2003). All analyses were performed in R 4.3.1 (R Development Core Team, 2021).
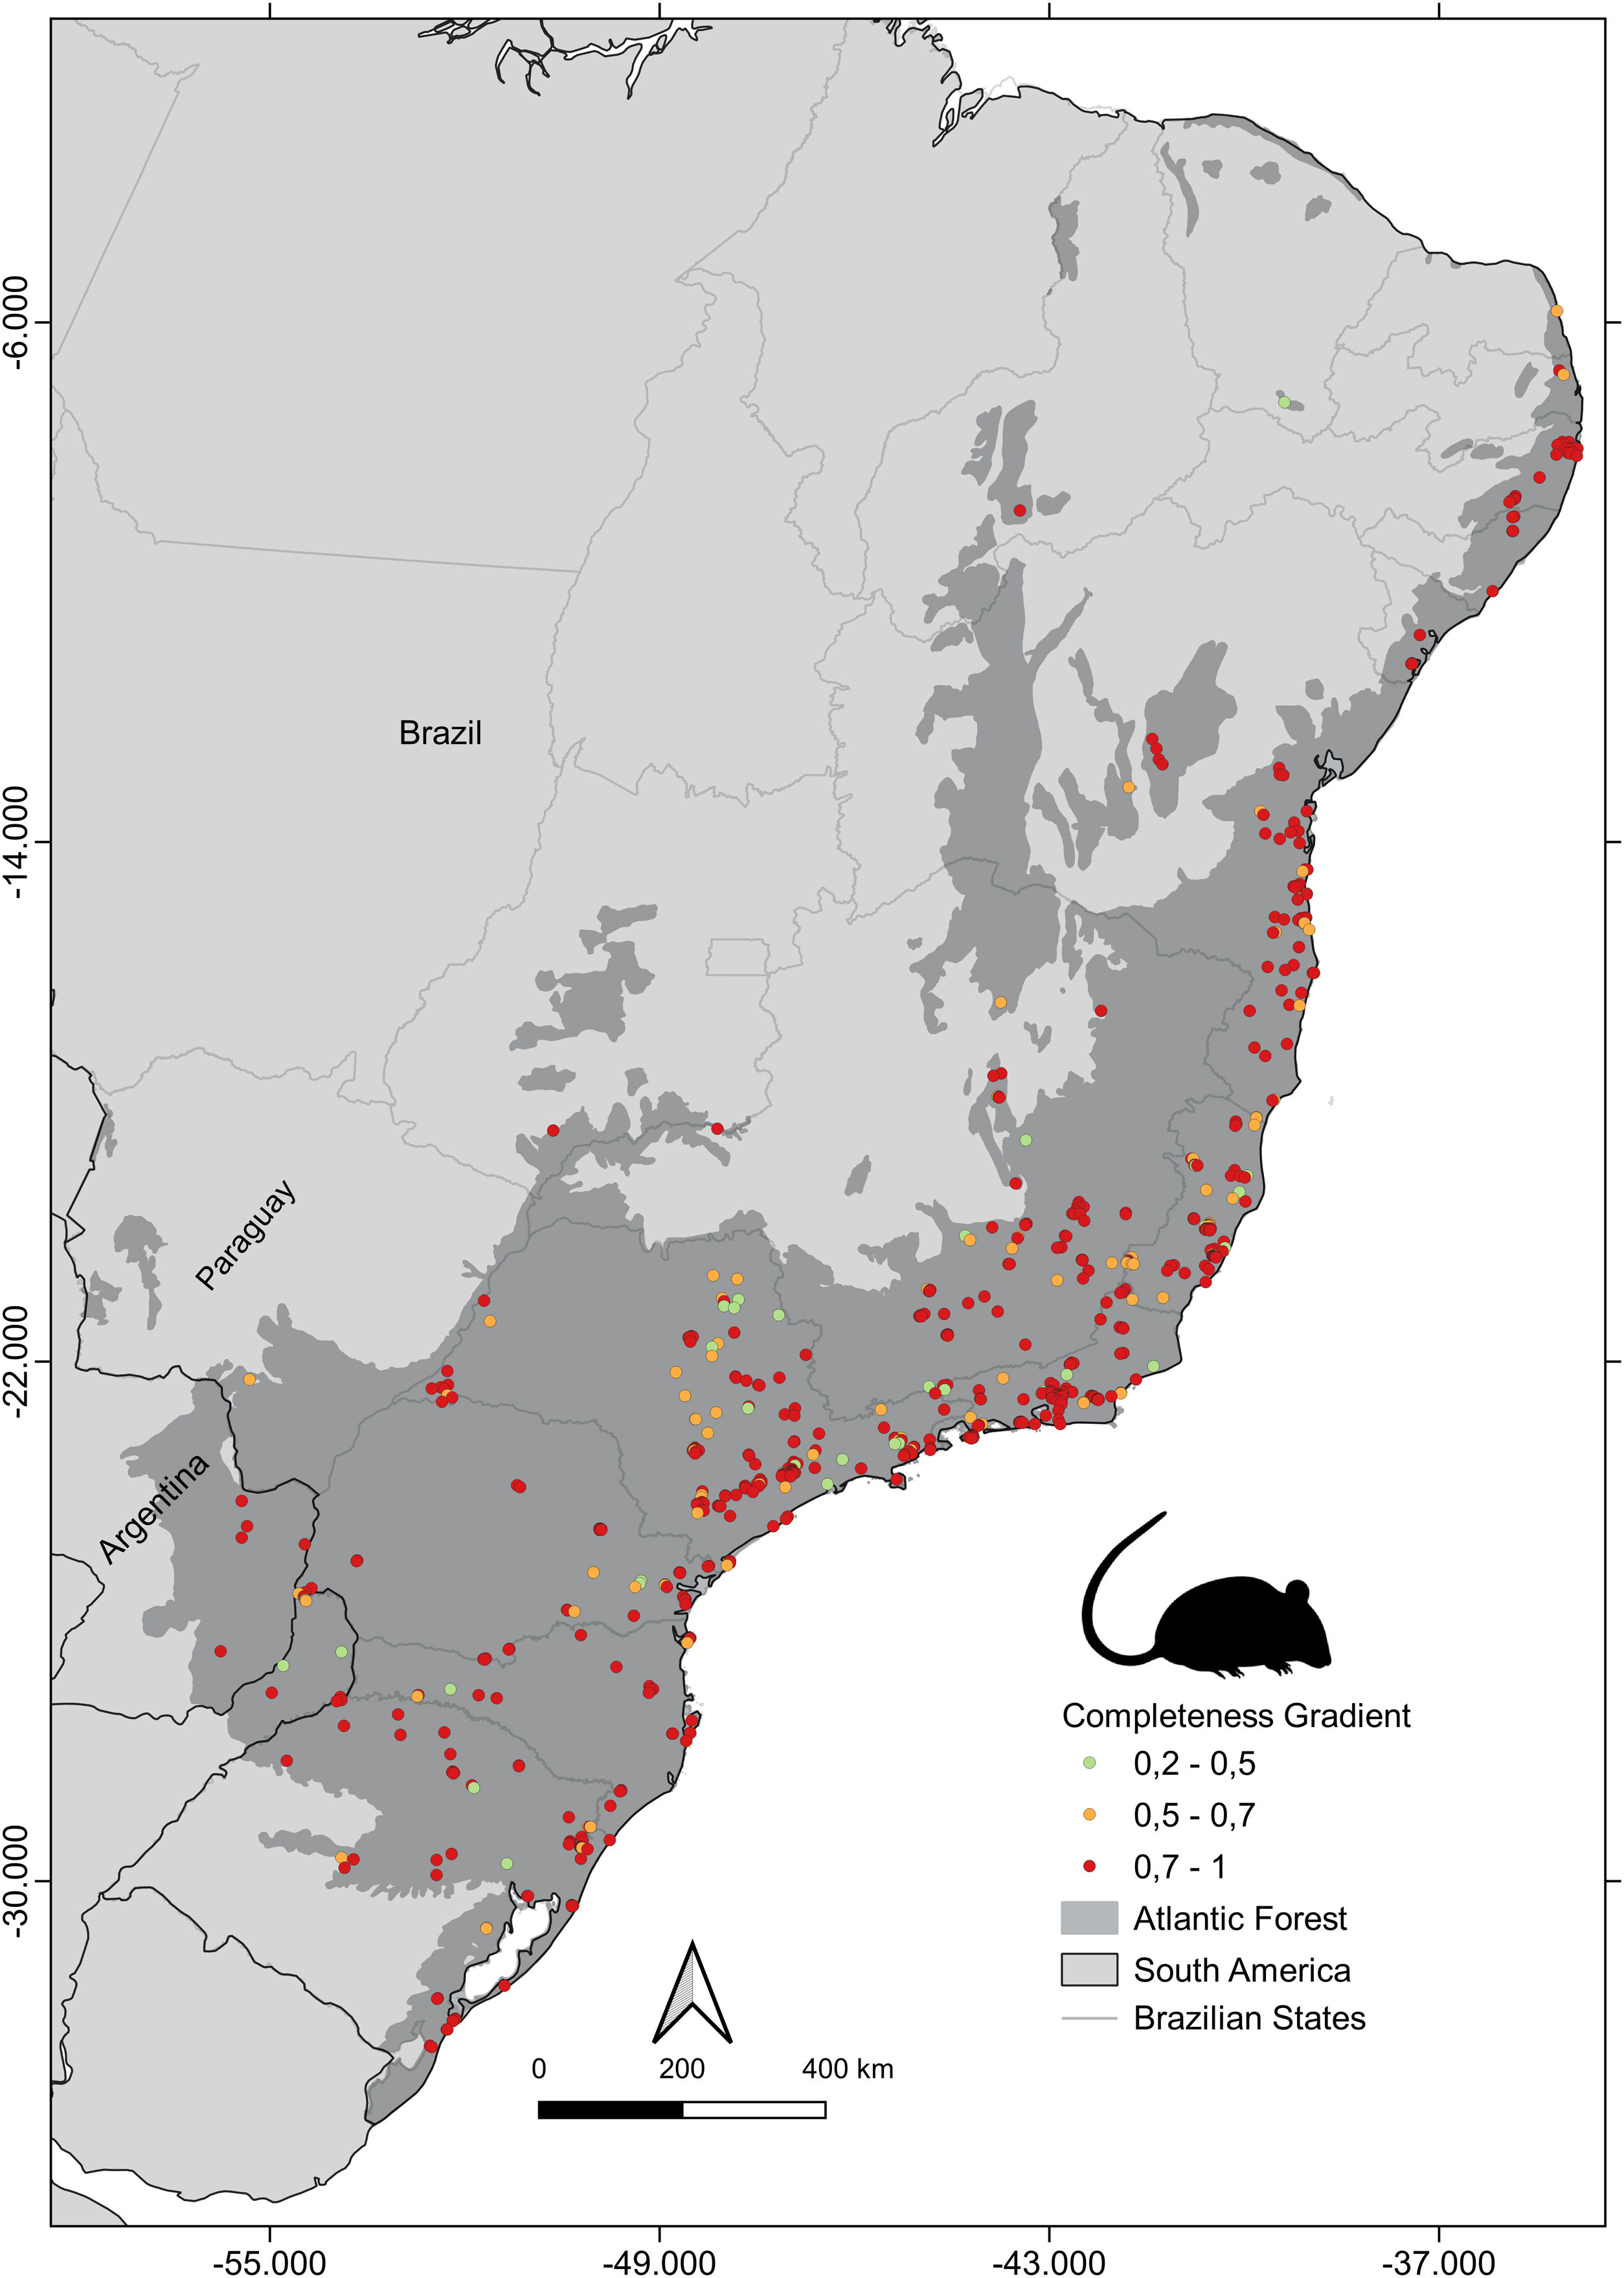
ResultOnly 507 cells (1 km2) of Atlantic Forest (out of 1,649,932 cells) were considered well-sampled. Thus, only 0.03% of the spatial surface of the Atlantic Forest is well-sampled for small rodents (Fig. 3). Serra do Mar was the best-known biogeographic subregion (Fig. 4) with 177 well-sampled sites (0.15% of the subregion area), followed by Pernambuco and Bahia subregions with between 0.07 and 0.09% of their areas well-sampled. Araucaria, Florestas do Interior and Diamantina subregions had less than 0.05% of their areas as well-sampled. São Francisco subregion had no sites with high completeness (Fig. 4).
 and poorly sampled sites (completeness < 0.7) of small rodent inventories in the Atlantic Forest (shapefile from Muylaert et al., 2018b). Red dots indicate well-sampled sites (n = 507). Green and yellow dots indicate sites where less than 69% of the biodiversity is known (n = 41 and 91, respectively).")
Well-sampled sites (completeness => 0.7) and poorly sampled sites (completeness < 0.7) of small rodent inventories in the Atlantic Forest (shapefile from Muylaert et al., 2018b). Red dots indicate well-sampled sites (n = 507). Green and yellow dots indicate sites where less than 69% of the biodiversity is known (n = 41 and 91, respectively).
.")
Small rodents well-sampled sites in the Brazilian Atlantic Forest biogeographic subregions proposed by Silva and Casteleti (2003).
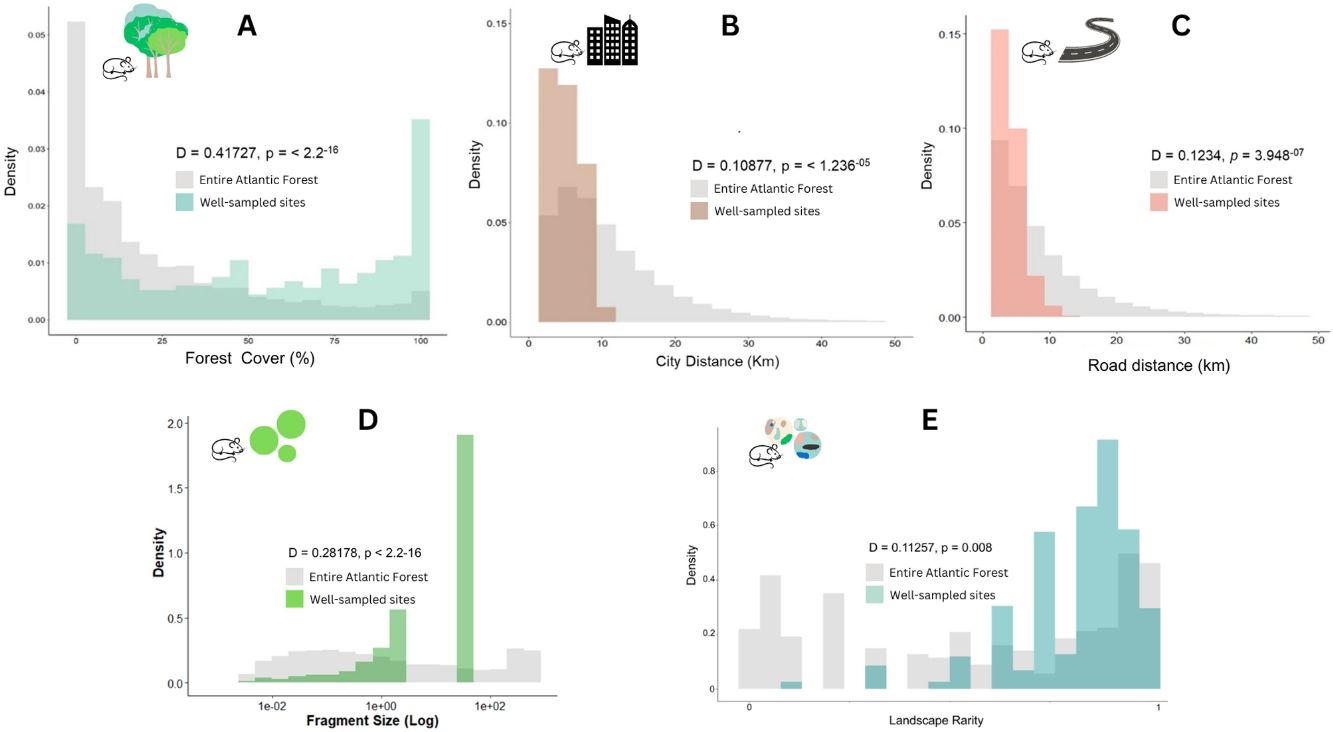
We found a sampling bias towards sites closer to paved roads (D = 0.1234, p = 3.948−07) and urban centers (D = 0.10877, p = 1.236−05). Well-sampled sites were mainly at distances lower than 15 km from cities and paved roads (Fig. 5). Following our predictions, landscape structure also influenced sampling bias (Fig. 5,) with well-sampled sites biased towards landscapes with larger fragments (D = 0.28178, p < 2.2−16), and with higher percentages of forest cover (D = 0.41727, p-value < 2.2−16). Although Atlantic Forest’s landscapes had less than 50% of forest cover, most well-sampled sites were at landscapes with >50% (Fig. 5). The well-sampled sites were also biased to rare landscape conditions (D = 0.11257; p = 0.008), showing gaps of sampling of smalls rodents in common landscape conditions (Fig. 5).
Discussion
Our findings suggest a spatial bias in the sampling sites of small rodents in the Atlantic Forest. Well-sampled sites were closer to urban centers and roads and involved larger fragments and landscapes with greater forest cover. Additionally, our results also highlight bias towards rare landscape conditions of Atlantic Forest. In turn, our findings also indicate a sampling gap for small fragments and landscapes with low forest cover, sites further from urban areas and roads, and in common landscape conditions, precluding broad scale inferences of the relationships between habitat fragmentation and forest loss and small rodents’ biodiversity. In addition, based on digitally accessible data, the spatial aggregation of sampling efforts generated a 99% of spatial gap in the knowledge of small rodents in the Atlantic Forest, with well-sampled sites covering only 0.03% of the Atlantic Forest's extension. Our results demonstrate that broad-scale knowledge of small rodents is spatially limited, which impairs inferences about the factors that drive and change their spatial distribution, a key factor for design sound conservation actions.
Although accessible digital platforms aim to provide more data on biodiversity to increase biodiversity knowledge (Devictor and Bensaude-Vincent, 2016), and to help fill knowledge gaps, the data currently available is still limited (Hortal et al., 2007). The limitations in biodiversity information are mainly due to the different methods used for data sampling, since the data are derived from different researchers and with different purposes (Wüest et al., 2020).
Our findings also suggest a spatial bias of well-sampled sites, which were associated with more accessible regions. Proximity to access routes and urban centers are well-known causes of bias in biodiversity knowledge for different taxonomic groups (Almeida et al., 2021; Correia et al., 2019; Oliveira et al., 2016). The historic exploitation of natural resources of the Atlantic Forest caused forest loss, remaining now only 28% of the original forest (Rezende et al., 2018). Changes in the Atlantic Forest landscape resulted in fragmented landscapes with high density of access routes and cities (Lapola et al., 2014; Oliveira et al., 2016), including protected areas that are easily accessible by roads. In the southeast r Atlantic Forest, the protected areas are spatially connected, comprising the largest and most conserved forest remnants, which are easily accessible. This spatial pattern may lead to a broad-scale spatial biases due to both accessibility and landscape structure. In addition, historically, funding of biological research in the Atlantic Forest has favored projects with long-term sampling and on local scale (e.g., Long-Term Ecological Projects, PELDs in Portuguese). These projects were able to clarify and describe diverse ecological and biodiversity patterns on a local scale, while failing, on the other hand, to clarify patterns on a broader scale, like as responses of biodiversity to landscape modification and fragmentation on a macroecological perspectives. Consequently, we found a sampling gap at distances greater than 15 km from urban centers and access routes, which should be priority sites for future sampling efforts. These spatial biases in survey sampling were also found for other taxonomic groups and ecoregions. For instance, in Brazilian Amazon, accessibility and proximity to research facilities explained sampling probability of an area for different taxa (Carvalho et al., 2023).
Sampling close to roads and cities may lead to biodiversity indices underestimation, mainly because these sites may not represent regional biodiversity (Benítez-López et al., 2010; Laurance, 2009) and may be affected by biological invasions (Hobbs et al., 2009). Access routes facilitate habitat degradation (Freitas et al., 2010), and change landscape configuration, which in turn alter small rodent species composition, due to edge effect (Rosa et al., 2018). On the other hand, sampling sites close to large cities and roads offer better infrastructure, more qualified human resources and reduced costs for researchers with little financial support (Lessa et al., 2019; Meyer et al., 2015).
We also found bias for larger fragments and landscapes with greater forest cover. These biases may be explained by the limited amount of time and funding for sampling, leading the researchers to choose more accessible larger fragments where the probability to record a greater number of species is higher (Reddy and Dávalos, 2003; Sastre and Lobo, 2009; Sobral-Souza et al., 2021a). Additionally, in the Atlantic Forest, larger fragments are temporally more stable and experience less effects from human-induced landscape modifications (Hansen et al., 2020). Human colonization and habitat fragmentation in Atlantic Forest resulted in a spatial configuration with the main forest remnants on sites close to high human density areas (Ribeiro et al., 2009). Thus, the largest forest fragments are spatially connected, which explains the spatial aggregation pattern of well-sampled sites. The main forest remnants of the Atlantic Forest are also in protected areas, which can foster long term habitat stability and provide sites for long-term temporal samplings with little human efforts. The same sampling biases towards larger forest fragments, closer to cities and roads was found for fruit-feeding butterfly in Atlantic Forest, (Sobral-Souza et al., 2021a) and for herptile, in global perspective (Nori et al., 2023), reassuring the gap knowledge for small and disconnected forest fragments.
The Serra do Mar range is the most conserved biogeographic region of the Atlantic Forest (Ribeiro et al., 2009) with 35% of the ecoregion’s well-sampled sites for small rodents (Fig. 4). It contains the largest protected forest remnants of Atlantic Forest, however, embedded in large urban centers, such as São Paulo city. Although the Floresta do Interior biogeographic region is six times larger than the Serra do Mar, our results revealed that knowledge of its biodiversity is smaller, with 0.02% of its surface well-sampled for small rodents. Sampling sites in the Floresta do Interior are spatially closer to the Serra do Mar region, probably due to the presence of large urban centers and research institutes in the former region (Almeida et al., 2021; Candelária et al., 2021; Lessa et al., 2019). The biogeographic regions at the northeast Atlantic Forest are practically unknown, especially São Francisco, which has no well-sampled sites. The northeast biogeographic regions were classified based on the endemism level, which usually attracts taxonomists to discover new species (Silva-Soares et al., 2021). Even so, areas with high endemism are poorly sampled, such as Diamantina, Bahia and Pernambuco. This can be explained by the low number of universities and protected areas in these regions. The northeast is also an ecotone between the Caatinga and the Cerrado ecoregions, which can hinder the sampling of Atlantic Forest’s taxa. The sampling gap at the biogeographic regions of the northeast Atlantic Forest may also explain the sampling gap at ecotone landscape conditions. São Francisco, Diamantina and Pernambuco, which showed no well-sampled sites occur in a semi-arid climate dominated by seasonally dry forests (Pennington et al., 2000). Thus, our findings point to the critical need to prioritize these regions in future inventories.
Biased biodiversity data also hamper the design of species distribution maps, because they will show the sampling bias and not the true species distribution (Rocchini et al., 2011; Ladle and Hortal, 2013). Landscape configuration also affects species dispersal (Fahrig, 2005); thus, landscape sampling bias may impair inferences about the effects of landscape modifications on local and regional biodiversity (Sobral-Souza et al., 2021b; Santos et al., 2020). The Wallacean Shortfall is dependent on the spatial scale on which it is assessed. At low spatial resolutions for broad spatial scales, biodiversity knowledge may be considered complete as all grid cells would have enough occurrences to reach a high level of completeness (Lobo et al., 2018). On the other hand, at high spatial resolutions, the spatial gaps in biodiversity knowledge can be found, such as those we found here for small rodents of the Atlantic Forest.
In conclusion, knowledge of biodiversity of small rodents in the Atlantic Forest is currently insufficient to understand how landscape modifications affect the spatial distributions of species at a large scale. The bias highlighted here showed biodiversity knowledge gaps for small fragments, and landscapes with small forest cover and far from roads and cities. Most Atlantic Forest remnants are small fragments, with small forest cover being common landscape conditions, as they are composed of secondary forests or forest restoration (Ribeiro et al., 2009). Therefore, to contribute to increasing survey completeness across the range of landscape configuration and conditions, samplings of small rodents should prioritize inaccessible sites, away from cities and roads, and landscapes with small fragments and with small forest cover, the most common landscape conditions in Atlantic Forest.
FundingNo funding to declare.
Author contributionsL.P.C; V.M.G.L T.S-S and D.J.R conceived the research.
N.S.B, T.S-S and R.G.C performed the analysis.
TS-S; L.P.C; N.S.B and R.G.C wrote the manuscript draft.
All authors contributed to the final version of the manuscript.
Competing interestsThe authors declare that they have no known competing financial interests or personal relationships that could have appeared to influence the work reported in this paper. There is no conflict of interest.
We thank Milton Cezar Ribeiro, Marcos Penhacek, Jessie Pereira Santos and Rodrigo Pirilo for their helpful comments on the manuscript, and the students of the MacrEco Lab for the helpful discussions. TSS thanks FAPEMAT (FAPEMAT-PRO.000274/2023 project) and IABS/CECAV (edital 01/2023 - TCCE Vale 01/2022). LPC and NSB received fellowships from CAPES. RGC was supported by a Visiting Research fellowship from São Paulo Research Foundation (FAPESP, no 2022/10760-1), and has continuously received productive grants from CNPq, which we gratefully acknowledge.
The following is Supplementary data to this article

