


Eight percent of all land surface has been designated as “Key Biodiversity Areas” (KBAs). Since these areas were established based on two percent of all terrestrial species estimated to exist, we ask what would happen if we used all species on Earth to identify additional KBAs. We explore this question at a global scale by using data from 64,110 species of animals and plants to identify how many areas could qualify as KBAs under current criteria. We find that between 26% and 68% of the world’s terrestrial areas can be classified as KBAs, depending on the spatial resolution. The total area from potential KBAs increases drastically as more species are assessed, suggesting that if all species were included, all land surface could eventually meet the biological requirements for becoming a KBA. KBAs are intended to be areas that are both of biological importance and manageable, but since they lack a data-driven ranking system, the current framework largely sidesteps the biological component. We, therefore, make an urgent call for stricter criteria in the KBA methodology or alternative methodologies that allow for biologically robust area prioritization, help secure evidence-based investments, and support progress toward the targets under the new Global Biodiversity Framework.
The upcoming Conference of the Parties (COP15) under the Convention on Biological Diversity is set to agree on new targets under the Post-2020 Global Biodiversity Framework. A core element will likely be the protection of 30% of the Earth’s land and sea area by 2030 (Dinerstein et al., 2020). Which areas should be prioritized for protection is therefore a critical and timely matter in conservation (Andam et al., 2008; Geldmann et al., 2013; Silvestro et al., 2022).
This pressure to increasingly delineate and formally protect more regions to meet internationally agreed targets could lead countries to protect the cheapest – rather than the most biologically valuable – land, including neglecting important species and ecosystems (Joppa and Pfaff, 2009; Margules and Pressey, 2000; Venter et al., 2014). Therefore, initiatives that have suboptimal thresholds in their intrinsic criteria to highlight important areas for conservation should be used with caution or revised, as they could inadvertently be used to justify the protection of less biologically relevant areas.
One of the most used tools selecting areas to protect is the Global Standards for the Identification of Key Biodiversity Areas (KBAs), hereafter the “KBA Standard”. It was first introduced in 2004 (Eken et al., 2004) and builds upon multiple earlier frameworks including the Important Bird Areas (Bird Life International, 2014), the Alliance for Zero Extinction (AZE) sites (Ricketts et al., 2005), B-Ranked sites (TNC, 2001) and Important Plant Areas (Darbyshire et al., 2017; Plantlife International, 2004).
The KBA Standard uses a system of criteria for identifying whether a site qualifies as a KBA, based on criteria such as the presence and proportional inclusion of threatened species and ecosystems, species’ distribution ranges, ecological integrity, and irreplaceability. Unlike most of the aforementioned programs, KBAs have been extended to apply to any species (Eken et al., 2004; IUCN, 2016; KBA Standards and Appeals Committee, 2020).
Since KBAs build on methodologies that were constrained either by taxonomic group (e.g. Important Bird Areas, Important Plant Areas), restricted distributions (e.g. Alliance for Zero Extinction), or only applied in some regions (e.g. B-Ranked sites), there are two potential pitfalls that could have been created through this aggregation and which have not yet been thoroughly investigated. Firstly, the fact that a single species is enough to trigger the KBA status of a site, and secondly, there is no upper limit to the size of KBAs (KBA Standards and Appeals Committee, 2020).
We will focus on the first issue here. Out of the 6.5 million or more terrestrial species that are expected to exist (Larsen et al., 2017; Mora et al., 2011), we have only described 2.1 million species and assessed the conservation status of around 160,000 species (IUCN, 2020). Out of all assessed species, a fraction of them – mainly tetrapods and plants – have been used for the identification of over 11,000 KBAs (BirdLife International, 2020b), covering over 8% of the planet’s land. With some 18,000 species being described as new to science each year (IISE, 2011), some of those will inevitably provide evidence for the creation of new KBAs. This urges the question: will there be any non-KBA areas left once we assess the conservation status of all species, and consider all their distributions across the world?
Beyond biodiversity data, the KBA methodology aims at being a bottom-up approach that also takes into consideration other aspects not readily integrated into analytical frameworks. After a candidate KBA has passed all the biological criteria, it needs also to be considered manageable. Manageability is a concept that is agreed between the KBA assessors based on features such as accessibility, geographical features, and socioeconomic or cultural values. This means that despite certain merits, deciding whether or not a KBA is ‘manageable’ may not constitute an objective, data-driven or reproducible decision.
Here we hypothesize that, as more species are considered when delineating KBAs, more territory meets the KBA biological requirements – a process that could continue to an extent where the biological features are no longer relevant, and manageability becomes the only factor determining whether an area should be a KBA. We focus on potential KBAs — i.e., grid cells that can in theory trigger KBA status for criteria A1a), b), e) or B1 (the biological criteria).
MethodsDatasetsWe downloaded global distribution ranges of 66,253 terrestrial and freshwater species from IUCN (2020), BirdLife International (2020a), and Roll et al. (2017). The dataset contains all species with mapped distributions in these datasets corresponding to a total of 34,014 tetrapods. 9622 fish, 10,089 arthropods, 2524 mollusks, and 10,004 plants.
Some species mapped in Roll et al. have not been assessed by IUCN so we treated them as Least Concern for all analyses.
We first calculated the size distribution of existing KBAs (BirdLife International, 2020b) to design the experimental set-up of our grid-cell analyses. Since KBAs may include both terrestrial and marine areas, and we only focus on terrestrial areas here, we first identified terrestrial KBAs which we defined as those having at least 90% of their range on land.
Using these range maps, we clipped the species range polygons to comprise only the areas included in terrestrial ecoregions in Olson et al. (2001). We did this to avoid triggering KBA status in sea cells, which otherwise could occur due to e.g. species with both marine and non-marine life stages, such as anadromous fish and seabirds. We removed all cells belonging to rock and ice biomes. These areas comprise glaciers and bare rock, which are generally covered by very limited, if any, vegetation cover. These clipping steps removed 3.2% of the species (2143 out of 66,253).
Gridded potential KBA mapsWe then produced grids of cells that fulfill the biological criteria for being designated a KBA (hereafter, potential KBA cells) using the R package WEGE (Farooq et al., 2020). We followed the approach described in Farooq et al. (2020), where species ranges and threat status are used against the sub-criteria within two of the five main KBA criteria (A1a, A1b, A1e and B1(IUCN, 2016; KBA Standards and Appeals Committee, 2020)) to assess whether it triggers KBA status of a grid cell. A1a are sites that have ≥0.5% of the global population size and ≥5 reproductive units of a Critically Endangered (CR) or Endangered (EN) species, A1b are sites that comprise ≥1% of the global population size and ≥10 reproductive units of a VU species, A1e are sites that have effectively the entire global population size of a CR or EN species, and B1 are sites that regularly hold ≥10% of the global population size and ≥10 reproductive units of a species (IUCN, 2016; KBA Standards and Appeals Committee, 2020). Since we only use a subset of the available criteria for defining KBAs, the actual number of cells that could trigger KBA status should be even higher than the numbers we estimate. We performed all analyses at the global extent in resolutions equivalent to 25 × 25 km (625 km2), 50 × 50 km (2500 km2) and 100 × 100 km (10,000 km2) grids in a Berhmann projection.
Number of species triggering potential KBAsTo analyze the sensitivity of KBA assignments concerning the overall species numbers, we randomly sampled a different number of species (from one to all species included in this study) 1000 times, each time identifying how many KBAs would be inferred. Our analyses comes with a risk of both over and underestimates of the number of potential KBA cells. Unlike the underestimation of potential KBA cells, an overestimation could influence our conclusions. To reduce this issue, we carried out three sets of supplementary analyses requiring a minimum of 1–5 species to be inferred in a cell for it to be a KBA. We assumed false positives (i.e., species being coded as present in a cell, although they do not occur in it) to be present in the dataset. Distributions are however generally much more carefully mapped for threatened or range-restricted species and since the KBA criteria used in this analysis focused on these, the probability of over-predicting the presence of species that can trigger KBA status should be small.
ResultsKBAs range from 0.0015 km2 to over 710,000 km2, with a median of 133.3 km2 and a mean of 1,270.2 km2. They cover approximately 8% of the terrestrial and 3% of the total surface area of the Earth. There are 11,879 terrestrial KBAs (Fig. 1A), of which 24.1 % are larger than 625 km2, 7.2 % are larger than 2,500 km2, 1.5 % are larger than 10,000 km2 (Fig. 1B).
 showing the fraction of cells currently designated as terrestrial Key Biodiversity Areas (KBAs; N = 11,879). On the left of the map is the proportion of each grouping used in the gridded map and on the right is a histogram of the distribution of the KBA proportion from 0 in the bottom to 1 on top. B. Histogram of all existing terrestrial KBAs distributed by log10 transformed area in square kilometres. Vertical lines show where the grid sizes used in this study (625 km2, 2500 km2 and 10,000 km2) fit in the overall distribution of KBA sizes. Due to the relatively coarse resolution of species distributions available globally, our analyses reflect sizes above 76% of terrestrial KBAs (smallest grid size 625 km2).")
A. Global map (in a 100 × 100 km grid) showing the fraction of cells currently designated as terrestrial Key Biodiversity Areas (KBAs; N = 11,879). On the left of the map is the proportion of each grouping used in the gridded map and on the right is a histogram of the distribution of the KBA proportion from 0 in the bottom to 1 on top. B. Histogram of all existing terrestrial KBAs distributed by log10 transformed area in square kilometres. Vertical lines show where the grid sizes used in this study (625 km2, 2500 km2 and 10,000 km2) fit in the overall distribution of KBA sizes. Due to the relatively coarse resolution of species distributions available globally, our analyses reflect sizes above 76% of terrestrial KBAs (smallest grid size 625 km2).
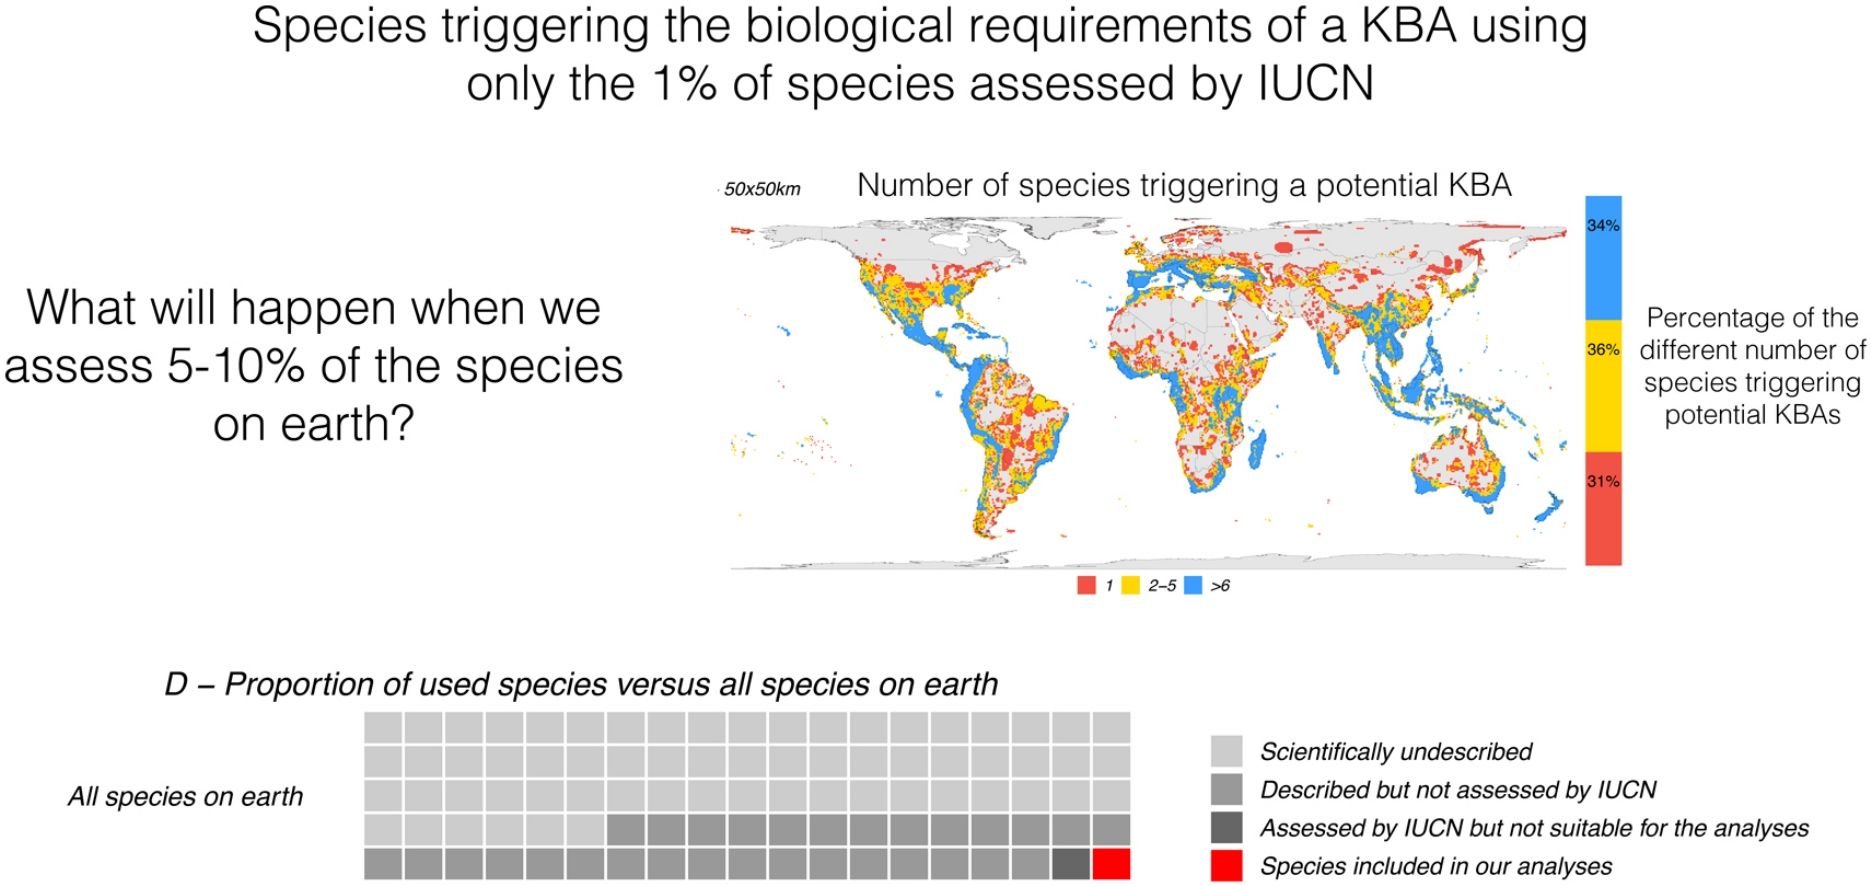
Depending on the grid size, between 26% and 68% of all terrestrial cells can be classified as KBAs. The percentage is 26% for grids of 625 km2, 45% for grids of 2500 km2, and 68% for grids of 10,000 km2 (Fig. 2). At the highest resolution (smaller grid size) 21% of the potential KBA cells are triggered by over 5 species and 39% are triggered by just one, while at the lowest resolution (greatest grid size), 52% of the potential KBAs are triggered by over 5 species and 17% are only triggered by one species. Crucially, the more species are included in the analyses, the more potential KBAs are generated (Fig. 3).
 25 × 25 km grid resolution, (B) 50 × 50 km grid resolution and (C) 100 × 100 km grid resolution. Fifty-five countries, including Italy, Greece, Malaysia, Haiti, Gabon, Madagascar and New Zealand, have at least 90% of their territory as potential KBAs even at the highest resolution (i.e., the smallest grid sizes of c. 25 × 25 km).")
Spatial distribution of all KBA-triggering cells for all species used in this study. (A) 25 × 25 km grid resolution, (B) 50 × 50 km grid resolution and (C) 100 × 100 km grid resolution. Fifty-five countries, including Italy, Greece, Malaysia, Haiti, Gabon, Madagascar and New Zealand, have at least 90% of their territory as potential KBAs even at the highest resolution (i.e., the smallest grid sizes of c. 25 × 25 km).
, described (2,115.985: IUCN, 2021), assessed (142,577: IUCN, 2021) and included in the analysis (64,110).")
Relation between the number of species included in the analysis and potential KBA grid cells, at 25 × 25 km, 50 × 50 km and 100 × 100 km resolution: The violin plots show the number of potential KBA cells identified based on 1000 randomized subsets of each number of species. In D, the proportion of used species versus all terrestrial species expected to occur on earth, suggesting that once we use all species for the KBA assessment, virtually everywhere can become a KBA if the site is manageable. Total species: (∼6,500.000: Mora et al., 2011), described (2,115.985: IUCN, 2021), assessed (142,577: IUCN, 2021) and included in the analysis (64,110).
As we added species the analysis, the number of potential KBAs increased steadily (Fig. 3). Given that our study was based on just 64,110 species, it is plausible that if all living species had been included in this exercise, effectively any area of the world could be a potential KBA at the resolutions examined. This is a result of a combination of no upper size limit and a low threshold of only one species to trigger KBA status.
As more species are described and their conservation status is assessed, more KBAs will invariably be identified under the current classification criteria. By continually adding species to the analysis and calculating which grid cells would trigger the biological requirements for a KBA, our results show that this process continues to the point where most terrestrial cells have at least one species to make the grid cell a potential KBA. Predictably, the coarsest resolutions show the beginnings of an asymptote due to the high proportion of required land. Importantly, the graphs at coarser resolutions (Fig. 3B, C) suggest a steep upward curve, showing that as more species are described (and assessed by IUCN), the percentage of remaining land that is not important for biodiversity will quickly diminish. The estimated number of undescribed species is over 100 times the number of species used in this study. A disproportionate number of these newly described species tend to be already under threat (Liu et al., 2022), implying that their probability of being used as the basis for the identification of KBAs is also higher than the currently described and assessed species.
We have previously shown that conclusions on biodiversity patterns are highly scale-dependent (Daru et al., 2020). Here we report a similar situation concerning grid cells that trigger the biological requirements for a KBA — the coarser the resolution of the analyses, the larger the fraction of cells. For the resolutions of 25 × 25 km and 50 × 50 km, 39 % and 31 % of the cells, respectively were triggered by the presence of just one species (Fig. 2). This may likely represent a limitation of the current methodology, whereby increasing the polygon of a potential KBA, one range-restricted or threatened species will eventually overlap with the selected area.
Large protected areas may be needed to protect viable populations of many species (Laurance et al., 2002; McKinney, 2005; Woodroffe and Ginsberg, 1998). If they are well implemented they will also contribute to gene flow among species in distant patches of habitats (Clergeau and Burel, 1997), facilitate species migrations (Ferreras, 2001) and contribute to climate change resilience by allowing species to seek their climatic optima and adjust their distributions (Opdam and Wascher, 2004). We are therefore not arguing against large areas but only stipulating that criteria A1, A1b, A1e and B1 are not realistically applicable in their current form for larger areas. By increasing the polygon of a potential KBA, a single range-restricted, or threatened species will nearly always overlap with the area and trigger a potential KBA status.
The biological component is only one part of the KBA selection process and most of the cells we identify could fail other aspects of KBA selection dealing with manageability. Even though we show that at 100 × 100 km resolutions, a disproportionate amount of land would trigger KBA status, few if any of such areas would be manageable in practice. This is because for a site to be considered manageable, they need to conform to both natural features and socioeconomic data such as mountains, rivers, threats or country borders (Eken et al., 2004). Crucially, if any area meets the biological requirements to become a KBA, then the KBA assessment process risks becoming solely based on site manageability — a term loosely defined as “The possibility of some type of effective management across the site” (KBA Standards and Appeals Committee, 2020). This situation could end up neglecting the most important areas from the perspective of biodiversity outcomes. The greater proportion of small-sized KBAs currently recognized suggests that most practitioners tend to favor smaller areas over proposing large KBAs, and therefore they are likely to already follow suggestions similar to what we propose here – stricter KBA criteria in terms of upper limit and the number of triggering species – but that consistency would be improved if they could be formalized.
Analytical limitationsBy using inferred species occurrences from IUCN range maps, our analysis will most likely fall victim to commission errors — when a species is erroneously assumed to be present in an area (Rodrigues et al., 2004). However, these will be more likely associated with species with wide ranges, which in turn are unlikely to be particularly relevant for conservation purposes, because few species are both wide-ranged and threatened (Farooq et al., 2020; Keith et al., 2018).
We acknowledge that our analyses were performed on relatively large units — only 24% of current KBAs are larger than our smallest analyzed resolution of 625 km2 (Fig. 1). Ideally, we would have used resolutions of 5 × 5 km or 10 × 10 km, but it has been suggested that coding for species presence/absence below 0.25 × 0.25 degrees (≈25 × 25 km) is often unreliable (Di Marco et al., 2017). It is therefore plausible that the trend we report may disappear at very fine resolutions and there is likely a size where the KBA Standard thresholds as currently defined would not inflate as a function of the number of species included in the analysis. We cannot identify this size based on currently available data, although if it exists, it is likely substantially smaller than the smallest size we analyzed here, and would require very high-resolution species occurrence datasets not available for the majority of regions and taxa at any point soon (Farooq et al., 2021).
Possible solutionsOne possibility to prevent the identification of so many areas as KBAs would be to impose additional restrictions for classifying an area as a KBA. This could be based, for instance, on approaches comparable to the ones used to identify biodiversity hotspots (Myers et al., 2000), requiring that a KBA needs to be important for a given number of species. Such approaches could be used in isolation, or several could be used in combination. However, such thresholds might become arbitrary and context-dependent, making the methodology differ between regions and biomes with different amounts of biodiversity.
A better solution may be to carry out hierarchization based on continuous metrics. One option is EDGE (Evolutionarily Distinct and Globally Endangered) which ranks species according to their evolutionary distinctiveness and threat status (Isaac et al., 2007). Another is WEGE (Weighted Endemism including Global Endangerment) (Farooq et al., 2020)., which weighs areas based on the conservation status and range size of the species found within them, allowing the ranking of top priorities for conservation in geographically constrained regions, such as individual countries or states.
Systematic conservation planning has also been proposed to prioritize between KBAs (Smith et al., 2019). This is done through the combination of biodiversity and implementation-relevant data to guide management actions based on variables such as funding, existing threat, or the percentage of management targets. Additional approaches are emerging that integrate various biological and socio-economic data sources within an artificial intelligence framework, such as e.g. Conservation Area Prioritization through Artificial INtelligence (CAPTAIN: Silvestro et al., 2022).
We acknowledge that policymakers consider a multitude of additional aspects that go beyond biodiversity metrics when making decisions, including the provision of ecosystem services and nature’s other contributions to people, the price of land, opportunity costs, accessibility, and conflicting interests. We are therefore by no means suggesting that real-world decisions should only consider the estimated biodiversity levels. Our key message is that biodiversity should be the central criterion and that the current KBA approach, in many cases, effectively removes the biodiversity component, making any large area a potential KBA.
ConclusionsThis study demonstrates that the current KBA Standards may not be scalable to all biodiversity and that stricter criteria, or alternative approaches, are required. Our results show that for larger terrestrial areas, there will be at least one species capable of triggering KBA status. This is problematic because almost any site can contain a high number of micro-organisms found nowhere else (Ramirez et al., 2014; Ritter et al., 2020). If everywhere can trigger the biological requirements for a Key Biodiversity Area, then nowhere can be truly regarded as ‘Key’.
Data availability statementThe data analyzed in this study was a re-analysis of existing data, which is openly available from the references cited.
We thank our colleague Allison Perrigo for proofreading this manuscript and Ruben Dario Palacio who provided various relevant comments to our preprint. S.F. and A.A. are supported by the Swedish Research Council (grants #2021- 04690 and #2019-05191, respectively) and A.A. is further supported by the Royal Botanical Gardens, Kew.

