


A recent study aimed to estimate the biodiversity conservation gaps of the Brazilian protected area network by analysing more than 880 thousand records of species presence from online databases. Although we agree with its general message that Protected Areas are poorly known, unevenly distributed, and not sufficient to safeguard the Brazilian biodiversity, we question its methodological approach and feel that its conclusions must not be received uncritically. A major concern is that their analyses are based on an arbitrary set of widespread, abundant, and non-threatened species and on a subset of the species widely recognized as conservation priorities, such as the red-listed species. Furthermore, they question the efficiency of the Brazilian protected area network based only on species data, missing other facets of biodiversity, such as habitat/community diversity, ecosystem processes, and services. We point out that the adequate way to estimate the Brazilian conservation gaps and to properly indicate where they are in space is through systematic conservation planning. Official data indicate that spatial conservation gaps correspond to 16.5% of the Brazilian territory, being conservation Priority Areas not under Protected Areas. This spatial gap, however, is much smaller in Amazon in comparison to all other biomes. For the Caatinga drylands, we estimated three facets of the conservation gap (i.e., qualitative gap, target gap, and spatial gap). We highlight that the Brazilian protected area network has been very successful to safeguard many facets of the Brazilian biodiversity and that future expansions, based on systematic conservation planning, can efficiently protect elected biodiversity traits.
Conservation decisions are made under serious constraints and trade-offs (Brooks et al., 2006). In the day-by-day conservation struggle, resources are limited, thus cheaper solutions are preferred over more expensive ones (Di Minin et al., 2017). In this sense, conservation goals, biodiversity traits, and quantitative targets should be clearly selected, otherwise resources can be spread too thinly to be effective anywhere. Therefore, decisions frequently need to be made on what, how much, and where to conserve. Recently, systematic conservation planning (SCP) emerged as a modern and objective tool to help the unpleasant and tough task of conservation prioritization (Margules and Pressey, 2000; Sarkar and Illoldi-Rangel, 2010).
Systematic conservation planning is performed to design cost-effective strategies to preserve a subset of the regional biodiversity, including threatened and highly endemic species, unique habitats, special landscape features, ecosystem processes, and services (Margules and Pressey, 2000). Any systematic conservation planning exercise need to determine its general conservation goals, carefully select biodiversity traits (i.e., threatened species, rare habitats), and define quantitative conservation targets. Then, objective methods determine a set of spatial sites, called Priority Areas (PI), where such quantitative conservation targets can be reached. The Priority Area map can be then used for decision actions, such as the creation of Protected Areas (PA) and habitat restoration. Under this framework, the effectiveness of a protected area network should be judged with respect to such previously defined goals and targets but not to other biodiversity trait.
Recently, Oliveira et al. (2017) aimed to estimate the biodiversity conservation gap of the Brazilian protected area network using a large set of species found in online databases (e.g., GBIF, Species Link, Birdlife International, Herpnet, Nature Serve, Orthoptera Species File) belonging to three groups of vertebrates (anurans, mammals, and birds), seven groups of arthropods (bees, spiders, millipedes, Orthoptera, dragonflies, moths, and Diptera), and eight families of angiosperms (Asteraceae, Bromeliaceae, Fabaceae, Melastomataceae, Myrtaceae, Orchidaceae, Poaceae, and Rubiaceae). To describe the sampling effort inside and outside Protected Areas they used the whole dataset but to test the efficiency of Protected Areas in representing species distributions they focused on 4344 species, those with more than 15 accurately geo-referenced occurrence points. Although we agree with its general message that Brazilian Protected Areas are poorly known, are unevenly distributed over the territory, and at this point are not sufficient to safeguard the Brazilian biodiversity, we feel that its analyses suffer from fundamental flaws and its conclusions must not be received uncritically.
In this short paper, we would like to share our concerns in relation to Oliveira et al. (2017) approach to estimate the efficiency of Brazilian protected area network. Furthermore, we would like to point out that the participatory systematic conservation planning exercise, organized by the Brazilian Ministry of Environment (MMA), can properly quantify and locate in space the Brazilian biodiversity conservation gap. In particular, SCP is used to estimate three complementary aspects of the Brazilian conservation gap: (i) Spatial gaps – regions that are considered conservation Priority Areas, because they contain relevant biodiversity traits, but are not part of the existing conservation area network, (ii) Qualitative gaps – number of selected biodiversity traits that are not represented inside the existing conservation area network, and (iii) Target gaps – proportion of pre-defined quantitative targets not achieved by the existing conservation area network.
The species selection concernOne major concern about Oliveira et al. (2017) analyses is the set of species chosen to test the efficiency of the Brazilian protected area network. First, their analyses miss hundreds of species that are of particular conservation concern (e.g., red-listed species). Second, in their data-set we can find thousands of species of no immediate interest for conservation, such as widespread species that have relatively larger geographic ranges, highly abundant species that are not threatened, and species that thrive in disturbed habitats. Therefore, by inflating the data-set with widespread species and by lacking species widely recognized as conservation priorities, their results can be seriously biased.
Oliveira et al. (2017) analyzed 11818 Angiosperm species while just 2118 are considered threatened by the Red Book of the Brazilian Flora (Martinelli and Moraes, 2013). Although they focused their analyses on plant species from eight highly-threatened families, they did not include existing information from additional 134 plant families included in the Red Book, missing a great deal of the phylogenetic diversity (Martinelli and Moraes, 2013). This, of course, jeopardize the results of their phylogenetic analyses. For vertebrates, they analyzed 757 amphibians, 1832 birds, and 697 mammals, many of them non-threatened widespread species, but missed 353 fish and 80 reptile species which are officially red-listed (MMA, 2014a,b). For the arthropods, 10611 species were analyzed but very few are nowadays considered a conservation priority. Furthermore, for their niche modelling analyses, due to methodological constraints, only species with more than 15 records were considered, given more weight to common than to scarce species.
We also believe that much care should be taken to interpret Oliveira et al. (2017) statement that “almost 55% of the Brazilian species and about 40% of the evolutionary lineages are not found in PAs [Protected Areas] while most species have less than 30% of their geographic distribution within PAs”. Although this can be superficially viewed as an indication of the inefficiency of the Brazilian conservation area network, the opposite is true. Since Oliveira et al. (2017) estimated that Protected Areas cover 25% of the Brazilian territory, they are protecting a disproportionally higher amount of biodiversity (45% of the species and 60% of the evolutionary lineages considered in their data-set). This is reinforced by the fact that indigenous lands, which they included in their analysis, despite its great importance for biodiversity conservation, especially in the Amazon, were not designed to maximize biodiversity protection, but culture, and their spatial locations respect the historical use of local communities.
Another important point is that, in Brazil, common non-threatened species, which are very important for ecosystem functioning and services, do not have necessarily to occur inside Protected Areas. Their long-term conservation is assisted by another important legal mechanism, the Brazilian Forest Code which requires rural private properties to set aside considerable natural vegetation areas of Legal Reserves and Areas of Permanent Preservation (New Forest Code, Law 12651, 25 May 2012, Brazil). Below, we point out that a good starting point to estimate the efficiency of the Brazilian protected area network is the set of species officially selected by the participatory systematic conservation planning exercises organized by Brazilian Ministry of Environment.
Brazil's systematic conservation planningThe Brazilian government established at the beginning of the 2000s one of the largest governmental participatory systematic conservation planning of the world, embracing all Brazilian biomes: Amazon (tropical rainforest), Atlantic Forest (coastal rainforest), Caatinga (semiarid dryland), Cerrado (savanna), Pampa (grassland), Pantanal (wetland), and the coastal area (MMA, 2004, 2007, 2016). This exercise was recently updated for the second time for three biomes: Caatinga, Cerrado, and Pantanal (Ministry of Environment, Law 223 of 21 June 2016). Nowadays, the Brazilian government recognizes 1530 Priority Areas (PI) for conservation, sustainable use, and shared benefits of the Brazilian biodiversity that covers 2,887,368km2 or 33.9% of the national territory (Fig. 1). By law, this exercise is updated every five years through a series of participatory workshops that typically receives representatives from federal and state environmental agencies, NGOs, and scientists, including taxonomists, ecologists, and conservation biologists. In those workshops, biodiversity traits are selected, goals and targets are established, distribution maps are compiled or generated, and a cost surface is created. Then, an optimization software (MARXAN; Ball and Possingham, 2000) is used to produce an objective spatially explicit solution which, after public scrutiny, is translated into a map of Priority Areas. Finally, for each area, specific conservation actions are suggested, including the creation of Protected Areas, sustainable forestry, restoration projects, management strategies, and biological surveys. Irreplaceability, urgency, richness of selected biodiversity traits, landscape metrics, and cost surface are some of the objective criteria used for selecting Priority Areas for the creation of Protected Areas. At the end of the process, Priority Areas are officially recognized (e.g., Ministry of Environment, Law 223 of 21 June 2016) and can be used for decision making.
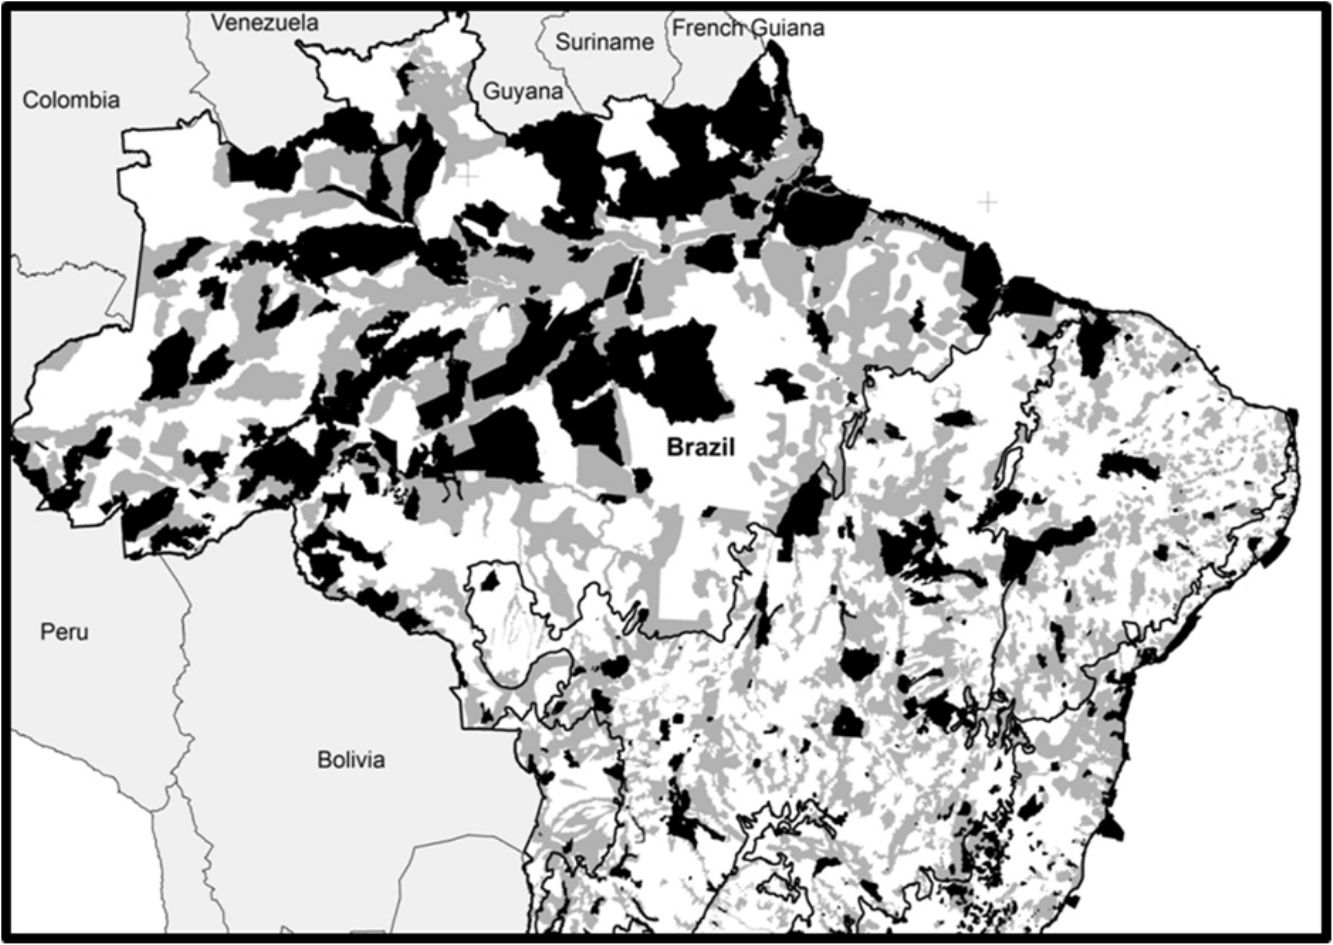
 correspond to Priority Areas, defined officially by participatory Systematic Conservation Planning exercises, which do not overlap with existing Conservation Units (black). In this optimistic scenario, conservation gaps correspond to 16.5% of the national territory. When APAs are excluded, the conservation gap rises to 21.2%. Priority Areas limits follow MMA (2007, 2016). Conservation Units limits follow CNUC (2017).")
Spatial conservation gaps (grey) correspond to Priority Areas, defined officially by participatory Systematic Conservation Planning exercises, which do not overlap with existing Conservation Units (black). In this optimistic scenario, conservation gaps correspond to 16.5% of the national territory. When APAs are excluded, the conservation gap rises to 21.2%. Priority Areas limits follow MMA (2007, 2016). Conservation Units limits follow CNUC (2017).
Based on the Brazilian Systematic Conservation Planning (MMA, 2007, 2016) and the National Register of Conservation Units (CNUC, 2017) it is possible to estimate the size of the Brazilian spatial conservation gap and where it is located (Fig. 1). In fact, 16.5% of the Brazilian territory is considered Priority Areas (PI) that do not overlap with Protected Areas (PA), therefore can be considered a spatial conservation gap. In fact, this estimate increases to 21.2% if one excludes APAs, the most permissive category in the National System of Conservation Units (SNUC, 2011). The spatial gap, however, is unevenly distributed among the biomes (Fig. 2). In Amazon, the spatial gap is relatively smaller (7.4%) since Protected Areas already occupy 23.4% of its territory. In contrast, the spatial gap is much greater in the Atlantic Forest (16.4%), Cerrado (26.5%), Caatinga (28.1%), Pantanal (43.6%), and Pampa (43.8%) due to a smaller coverage of Protected Areas in such biomes. In Brazil, we estimated that 36.8% of the territory defined as Priority Areas are under protection, however, this varies widely across biomes. In Amazon, 48.3% of the territory recognized as Priority Areas are nowadays under Protected Areas but the level of protection is substantially lower for Atlantic Forest (28.2%), Cerrado (19.6%), Caatinga (19.1%), Pantanal (6.5%), and Pampa (6.1%). Furthermore, these values drop substantially for most biomes when APAs are not taken into account.
, non-indigenous protected areas (black), and the remaining area (white) of each Brazilian vegetation domain and for the whole territory.")
The Brazilian systematic conservation planning advances not only on the location of the spatial conservation gaps, but also on suggestions of specific conservation actions. Of course, the creation of Protected Areas of Integral Protection (i.e., IUCN categories I–IV) and Protected Areas of Sustainable Use (i.e., IUCN categories V and VI) are two main proposed actions (MMA, 2004, 2007, 2016). However, other alternatives are proposed. For the Caatinga, landscape connectivity models were already incorporated to estipulate Priority Areas for restoration (Tambosi et al., 2014; Antongiovanni, 2017; Fonseca et al., 2017). In the existing conservation gaps, many other actions were suggested as sustainable forestry and fisheries on Amazon and sustainable cattle management on Pampa and Caatinga (MMA, 2007, 2016).
The Caatinga systematic conservation planningThe Caatinga systematic conservation planning, which we acted as scientific coordinators, had as its main goal to select Priority Areas for the long-term persistence of the threatened Caatinga biodiversity. Here, we used it as a case study to demonstrate how SCP can help to detect spatial, qualitative, and target gaps. A fuller description of the exercise can be find in Fonseca et al. (2017).
For the Caatinga biome, 691 biodiversity traits of great conservation interest were selected, including 350 red-listed plant species, 61 birds, 31 mammals, 30 reptiles, 22 amphibians, and 126 fishes, besides unique habitats (e.g., caves) and endangered ecosystems (e.g. arboreal Caatinga) (Fonseca et al., 2017). Such biodiversity trait list was selected through an innovative and participatory methodology which consisted in the establishment of several virtual working groups (e.g., birds, mammals, reptiles, amphibians, fishes, plants, coastal ecosystems) involving 99 voluntary researchers from 41 institutions of 18 Brazilian states. Each working group was responsible to define a list of biodiversity traits of conservation concern and make explicit the multiple criteria based on which they were selected, including red-listed species (i.e., IUCN and Brazilian red-books), highly endemic or rare species, species presently persecuted, habitat specialists, species overexploited by hunting, fishing, biopiracy, or illegal market, besides restricted habitats, endangered ecosystems, caves, and topographic features. Plant targets, with a few exceptions, were selected from the recently published Red Book of the Brazilian Flora, an impressive product produced by a network of more than 250 plant taxonomists (Martinelli and Moraes, 2013).
The virtual working groups were also responsible to generate distribution maps of each biodiversity trait (Fonseca et al., 2017). The methodology used to produce such maps varied according the specificity of each trait. Ecological niche modelling was used for several taxonomic groups (Elith and Leathwick, 2009), but respecting their particularities. For fishes, for instance, watersheds and potential water flow were used among the predicted variables while, for some forest birds, canopy structure proved to be important to improve the model fit. For some targets, their spatial distributions were defined by minimum convex polygons, watershed limits, or simply by a buffer zone. The source of primary information to generate such maps also varied among groups, including several virtual sources (e.g., species Link, GBIF, WikiAves, BirdLife) but also up-dated information available on regional museums, local collections, and recently collected data (e.g., Garda et al., 2017; Lima et al., 2017; Mesquita et al., 2017). All point data were validated by the specialists. After about six months of work, the products of such virtual working groups were then presented, modified, and ratified on a face-to-face workshop with 35 representatives from 26 Brazilian institutions.
In such workshop, the criteria were established to define a quantitative conservation target for each biodiversity trait (for more details see Fonseca et al., 2017). For extremely endemic species (<1000km2) the target was set up as 100% and for widespread species (>250,000km2) it was defined as 10%. For the remaining species, we follow the linearized equation (T=−37.53LogA+212.6) proposed by Rodrigues et al. (2004), where the species conservation target (T) is negatively related to its distribution area (A). For the remaining biodiversity traits, conservation targets were defined democratically by the well-informed workshop members. In particular, a political agreement was reached to include 10% of the Caatinga cover of every state as a conservation target.
In another workshop, described in more detail in Fonseca et al. (2017), a non-monetary cost surface was created based on 21 spatially-explicit primary variables representing social, economic, and environmental costs (e.g., population density, proximity to cities and roads, agricultural areas, mining, wood and oil extraction, fire incidence, and habitat loss). In high-cost areas, conflicts over land use are expected to be more intense and reactive conservation strategies are needed, while low-cost areas are more prone to pro-active conservation actions (Brooks et al., 2006).
Posteriorly, the data was compiled and analyzed in MARXAN (Ball and Possingham, 2000) for the determination of the Priority Areas for conservation, sustainable use, and shared benefits of the Caatinga biodiversity. One relevant aspect that should be highlighted is that all SCP selection algorithms are based on the complementary principle and not on algorithms that maximize species richness (Margules and Pressey, 2000). Complementarity is a measure on how much an area contributes to the conservation of underrepresented biodiversity traits. According this principle, a small area that contains 100% of the distribution of a single highly endemic species will be obligatorily selected as a Priority Area. In contrast, an area very rich in species but lacking relevant biodiversity traits would not be selected as a Priority Area and, consequently, as a Protected Area.
The Caatinga biodiversity conservation gapIn total, 282 Priority Areas were identified, occupying 36.7% of the Caatinga territory. This network fully meets the pre-defined quantitative conservation target of 97% of the 691 selected biodiversity traits. The overlap of the geographic distribution of the 274 biodiversity traits that had their targets defined as 100%, most of them highly endemic threatened species (e.g., plants, fishes), corresponds alone to 25.6% of the Caatinga. Such area has maximal irreplaceability and corresponds to 49.9% of the Priority Area. These results indicate that these biodiversity traits exhibit a low spatial correlation among them (no overlap would result in 32.9%). Also, one can conclude that the selection of more widespread biodiversity traits (e.g., birds, mammals) increases the final solution cost in 12.1% of the Caatinga territory (or 32.1% of the final solution).
The 282 Caatinga Priority Areas had from five to 309 of the 691 selected biodiversity traits, with a considerably high median of 56 biodiversity traits (first quartile=43, third quartile=71). Besides such biodiversity traits of high conservation concern, Priority Areas contain also an unknown number of non-target species, but their presence is incidental, not enforced by the systematic conservation planning methodology.
For the Caatinga Systematic Conservation Planning exercise it is possible to verify that the existing protected area network (excluding APAs) harbours 485 (70%) of the selected biodiversity traits. Therefore, 206 biodiversity traits (30%) occur entirely outside the protected area boundaries, this being the best estimate of the Caatinga qualitative gap. This figure is roughly half the species gap (56%) estimated by Oliveira et al. (2017). Caatinga Protected Areas harbour a median of 53 biodiversity traits (minimum=2, maximum=224). Furthermore, 87.5% of the existing Protected Areas harbour biodiversity traits with conservation target defined as 100% (e.g., plant and fish species). These results support the notion that the Caatinga protected area network is developing in tune with the conservation priorities defined by the Caatinga SCP.
Regarding the pre-established quantitative targets, however, the scenario is much less optimistic. Due to the restricted coverage of the existing protected area network in the Caatinga, the median target gap is 95.6% (min=0%, max=100%). However, target gaps varied widely across biodiversity trait type (Fig. 3). The median target gap was higher for fishes, caves, plants, reflecting their higher number of extremely endemic species, and lower for mammals, birds, coastal traits, and arboreal Caatinga, which have larger spatial distributions. This strongly reinforces the view that the Caatinga protected area network should be quickly expanded.
The efficiency of the Brazilian protected area network of 691 biodiversity traits defined by the systematic conservation planning exercise of the Brazilian Caatinga, classified by trait type. Target gap is defined as the percentage of the pre-defined target not achieved by the actual protected area network.")
The Brazilian protected area network expanded steadily in the last two decades (Jenkins and Joppa, 2009), due to the establishment of new Protected Areas of Integral Protection (i.e., IUCN categories I–IV) and Protected Areas of Sustainable Use (i.e., IUCN categories V and VI). This expansion occurred in great consonance with the planning exercises that occurred in Amazon which have put together the expertise of hundreds of participants, including representatives of traditional communities and indigenous people (MMA, 2007). Recently, the network expansion was financially supported by the Amazon Region Protected Areas Project (ARPA – Brazilian Ministry of Environment/BNDS, World Bank, German bank KfW, and WWF) which, by principle, did not support any conservation initiative outside Priority Areas. Indeed, just in its first phase (2003–2010), the ARPA project contributed to the creation of 46 Protected Areas in 24 million hectares; 13.2 of Integral Protection and 10.8 of Sustainable Use (http://programaarpa.gov.br). In its second phase, ARPA continued to exclusively support the creation and implementation of Protected Areas that were helping to reach the goals and targets defined by the Amazonian PSC. The expansion of the Protected Areas in the Amazon became acknowledged internationally as one of the best examples of pro-active conservation (Jenkins and Joppa, 2009).
The Amazonian conservation planning was only partially based on species records because sampling density is low and spatially biased, as pointed out by Oliveira et al. (2017). Although well-known taxa were used as targets in the Amazon exercise (e.g., monkeys), many biodiversity surrogates were used (MMA, 2007). Priority Areas were selected to represent, for instance, the spatial heterogeneity of habitats and vegetation types generated by differences in topography, geology, and water type (e.g., black water, white water and clean). Such differences were supported by the occurrence of well-known taxa and can be expected to be surrogates of thousands of endemic arthropods not included in available databases (Lewinsohn and Prado, 2005). The Protected Areas were designed to ensure large scale ecosystem processes (e.g. nutrient cycling and water cycle), and services such as food security for local populations by fishing and other sustainable resources. For instance, Sustainable Development Reserves (SDR) were created specifically for its sustainable use goals (Castello et al., 2009). Indigenous lands, of course, were primarily designed to sustain cultural diversity. Furthermore, the creation and implementation of Conservation Units and the homologation of indigenous lands in areas of high deforestation rates was an strategy explicitly adopted by the Plan to Combat Deforestation in the Amazon (GPTI, 2003, 2004, 2011, 2013) which helped to reduce deforestation rates 77.65% between 2004 and 2015 (GPTI, 2016). Therefore, Oliveira et al. (2017) statement that “the recent expansion in PAs in Brazil has not resulted in a comparable increase in biodiversity protection” is highly inaccurate. In fact, besides thousands of species, the Brazilian Protected Areas are protecting many levels of biodiversity not included in their data-set (i.e., communities, ecosystem processes, and services) and are playing a key role against biodiversity decline.
Concluding remarksBrazil is a megadiverse country with around 1.8 million species distributed in 8.5millionkm2 (Lewinsohn and Prado, 2005). Being primarily responsible for such huge biodiversity, the Brazilian government has been using, since 2007, one of the most powerful tools available to help their conservation decisions, the systematic conservation planning. By selecting justified biodiversity traits (e.g., threatened species), using up to date information on their distribution, and performing an objective analysis which explicitly minimize social and economic costs, the Brazilian systematic conservation planning has produced useful information that can be easily translated for the decision arena. First, what are the main biodiversity traits we should be primarily concerned. Second, where such traits can be properly protected at the lowest cost. Third, which actions should be implemented. Furthermore, as we demonstrated, systematic conservation planning results can be contrasted with information on the protected area network to estimate several aspects of the Brazilian biodiversity conservation gap (i.e., spatial, qualitative, and target).
The recent advance of the Brazilian protected area network, even though it was strongly driven by the creation of Protected Areas in Amazon, is good news for the world struggle for biodiversity conservation (Jenkins and Joppa, 2009). We strongly disagree with the way the efficiency of the Brazilian Protected Areas was accessed by Oliveira et al. (2017). To question the huge benefits brought about by the establishment of large conservation areas in Brazil based on an arbitrary set of species is highly questionable. Their analyses also overlooked the effectiveness of the Brazilian Protected Areas for other biodiversity dimensions, such as habitat or community assemblages, ecosystem processes, and services, not to mention their role to reduce deforestation rates.
Biodiversity conservation occurs in a very sensitive political arena, full of different actors and interests. We fear Oliveira et al. (2017) results can be misused politically, increasing the fragility of the Brazilian green agenda which has been recently under attack (e.g., Mascia et al., 2014; Bernard et al., 2014; Brancalion et al., 2016; Fearnside, 2016). The established Protected Areas serve to the goals they were initially designed for. Now that Brazil has a well-designed national systematic conservation planning, new Protected Areas can be positioned efficiently to protect elected biodiversity traits and achieve their pre-defined conservation targets.
CRF and EMV received support from CNPq (305304/2013-5 and 309458/2013-7).

