


Scattered trees are frequently considered “keystone structures” due to their disproportionate contribution in facilitating movement across the landscape. However, which landscape structure scattered trees best facilitate animal movement in the most effective manner remains poorly understood in the literature. Here, we tested three hypotheses examining how scattered trees influenced natural bird movement across an open matrix. We used three bird sampling methods: line transect, point count, and focal tree sampling. Our results showed that the efficacy of scattering trees as stepping stones and/or as a source of resources is mainly conditioned by three factors: predation risk, tree size, and landscape context in which the trees are inserted in an open matrix. In general, movement between habitat patches (gap-crossings) were more frequent in shorter distances (mean=10.9m). For larger gaps, the addition of scattered trees as stepping stones in the movement path is essential in reaching the neighboring habitat patches. The functional drivers of scattered trees are mainly related to perching, eating, and reproducing. Their functions increase with tree size and distance to the nearest patch. In relation to landscape context, birds prefer scattered trees surrounded by higher amounts of forest cover or with a network of higher aggregation trees. All these decision-making outcomes suggest antipredatory strategies during bird movement across landscapes including: (1) reducing the distance required to reach safer shelter; (2) choosing larger scattered trees as stepping stones, which improves a birds’ ability to detect predators, before deciding on the next movement; (3) choosing the movement path in the landscape context that most reduces the ability of predators to detect them or that increases the probability of escape from a predator. Land managers who wish to facilitate bird movements in open matrices should ensure gaps between landscape elements are less than 40m; preserve and actively plant arboreal individuals of tree species (height>15m) in open matrices; increase spatial aggregation of scattered trees or use them in landscapes with higher amounts of forest cover.
Scattered trees are common elements both in natural landscapes, such as savannas and the Brazilian Cerrados, and human-modified landscapes around the world (Manning et al., 2006). They often represent the last remaining arborescent relicts following natural or anthropogenic disturbance (Prevedello et al., 2018). Several researchers have considered these trees to be “keystone structures”, due to their disproportionate contribution to ecosystem functioning, especially when the small area they occupy is considered (Fischer et al., 2010; Stagoll et al., 2012). Among their functions, such trees increase the matrix quality (structural complexity, resource availability, and structural connectivity), which can improve the spillover of animals from natural to anthropogenic habitats, or vice versa (Gibbons et al., 2008; Doerr et al., 2014; Tscharntke et al., 2012). Spillover to anthropogenic habitats has been frequently associated with enhancing the provision of ecosystem services, such as crop pollination, biological control and functioning as nuclei for plant regeneration (Corbin and Holl, 2012; Lander et al., 2010; Pizo and dos Santos, 2011). Despite their ecological relevance, few studies have determined in which landscape structure scattered trees would improve this spillover or even, facilitate animal movement between habitat patches (as stepping stones, Lasky and Keitt, 2012; Uezu et al., 2008). These issues are crucial to the development of effective conservation strategies that help mitigate the impacts of habitat loss and fragmentation (Chisholm and Gonzalez, 2011).
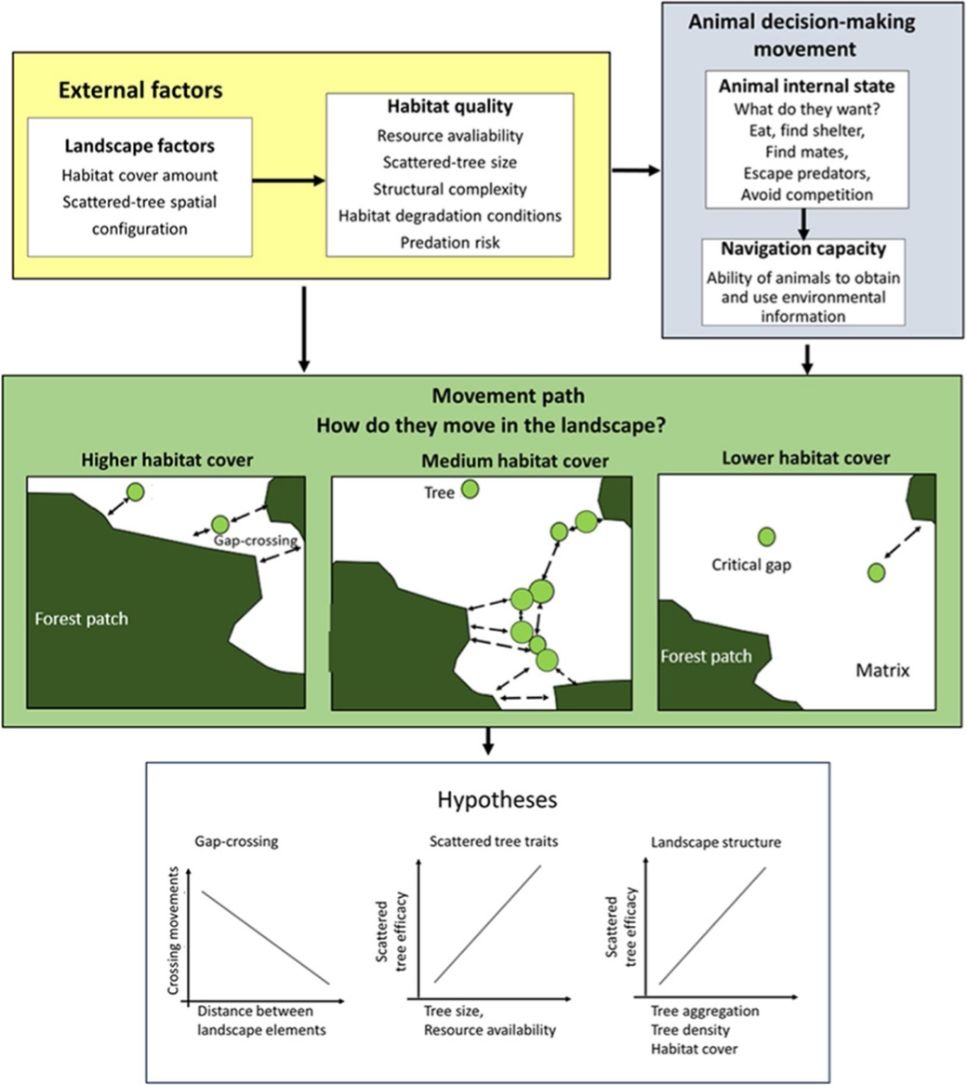
Any decision-making movement across the landscape involves trade-offs between the energy intake and predation risk (Fig. 1). For example, an animal might be attracted to leave a patch due to the benefits of the additional or alternative resources (or other intrinsic animal desires, such as mates and shelters; Dunning et al., 1992; Boesing et al., 2018). Otherwise, this is implicated in costs related to mortality during movement that changes with predation pressure, travel distance, and time required to reach safe shelter (Awade et al., 2017; Chisholm and Gonzalez, 2011). Then, what would be the best strategy for moving across the landscape? Should the animal move as quickly as possible in a single flight between habitat patches to reduce their risk of predation? Or, would it be safer to choose a movement path with a network of scattered trees to reduce the ability of predators to detect them during movement across an open matrix?
 applied to movement across an open matrix, showing the decision-making using scattered trees. The blue background components are related to animal decision-making (internal state, navigation capacity). The yellow background components refer to external factors affecting decision-making (landscape factors, habitat quality). The movement path and the decision to use the scattered trees depend on how animals perceive and use environmental information. Thus, we predicted that a bird")
The movement ecology framework (Nathan et al., 2008; Fahrig, 2007) applied to movement across an open matrix, showing the decision-making using scattered trees. The blue background components are related to animal decision-making (internal state, navigation capacity). The yellow background components refer to external factors affecting decision-making (landscape factors, habitat quality). The movement path and the decision to use the scattered trees depend on how animals perceive and use environmental information. Thus, we predicted that a bird's decision to (1) cross swaths of inhospitable habitat in a single flight (gap-crossing), or to use scattered trees as stepping stones will depend on the distance to the nearest habitat patch (gap size). In large gaps, the use of scattered trees in movement path will be essential to reach the neighboring habitat patches; (2) use some specific scattered trees will depend on plant species trait (tree size is a proxy for perching spot, resources: presence of fruits, flowers, and nests); (3) use of scattered trees depends on landscape structure (particularly, the amount of habitat cover, habitat patchiness, and matrix quality). All these decisions need to be made by weighing trade-offs between the costs of predation risk and benefits of additional or alternative resources elsewhere than the current patch.
The answer should vary according to the landscape structure (particularly, the amount of habitat cover, habitat patchiness and matrix quality), because different cover types present different levels of risk and benefit in the landscape (Fahrig, 2007). For example, habitat loss can increase animal pressure to spillover from natural to a matrix to find additional or alternative resources. However, at the same time, animal mortality risk can be higher due to both higher predator density and exposure to predators (Biz et al., 2017; Dunning et al., 1992). Fragmentation can increase an animal's perceptual range (its ability to detect from a distance the habitat patch, Zollner and Lima, 1996), because perception increases with decreasing structural complexity (Prevedello et al., 2011). However, fragmentation associated with habitat loss also reduces movement probability, because the distance between neighboring patches increases during these processes (Fahrig, 2003). The matrix quality (resource availability, predation risk, structural complexity) interferes with movement paths. When animals move throughout high quality areas of a matrix (for example, areas with high resource availability, high aggregation of scattered trees or low mortality risk), the movements are usually more tortuous, with short gaps (swath of inhospitable habitat) and, where the trees are clustered, Edwards et al., 1994; Grubb and Doherty, 1999). In contrast, movement paths in risky matrices tend to be straight, which minimizes the travel time in the matrix (Haynes and Cronin, 2006). In addition, matrix permeability can influence scattered tree efficacy as stepping stones. They be more useful in intermediate conditions of matrix resistance, where the matrix is not so resistant as to prevent movement outside of a current habitat patch, and neither is it so permeable as to allow unrestricted movement throughout the matrix (Uezu et al., 2008).
In the current study, we examined natural bird movements in open matrices, within different landscape structures (scattered tree configuration and habitat amount) and at patch-matrix edge, to test the following hypotheses (Fig. 1):
1. Gap-crossing. Deciding to cross swaths of inhospitable habitat in a single flight (gap-crossing), or to use scattered trees as stepping stones will depend on the distance to the nearest habitat patch (gap size). In large gaps, the use of scattered trees in a movement path will be essential to reach the neighboring habitat patches (Awade et al., 2017; Dale et al., 2006; Edwards et al., 1994; Uezu et al., 2008). In addition, we expected reductions in tree use with the distance to the nearest forest patch because this distance is proportional to time spent and energy expenditure in environmental conditions with high mortality risks (Awade et al., 2017).
2. Scattered tree traits. Decision-making to use some specific scattered tree will depend on plant species traits (tree size is a proxy for perching spots and resources such as presence of fruits, flowers, and breeding sites). We predicted that tree size would be the most important trait in any spatial context, because larger scattered trees offer a broader view of the landscape, and consequently, wider perceptual range. So, a resident animal can use landmarks to better define strategies for movements across the landscape. In contrast, the benefits of resources or breeding sites should offset just close to the current patch habitat (Fahrig, 2007; Fischer and Lindenmayer, 2002; Uezu et al., 2008).
3. Landscape factors. To reduce predation risks, we predicted that birds will choose movement paths that provide the safest travel via the landscape context with higher forest cover and/or with higher tree aggregation in the matrix (Arthur et al., 2005). We predicted such preferences because the increment in forest cover or scattered tree aggregation will reduce the gap size (Doerr et al., 2011a,b; Fahrig, 2003). This landscape context should favor the gap-crossing and the use of scattered trees as stepping stones and/or as a source of resources. However, these movement responses should vary according to animal sensitivity to anthropogenic landscape change (Fahrig, 2007; Henle et al., 2004).
Materials and methodsStudy areaWe conducted the study in human-modified landscapes in southern Minas Gerais, Brazil (Fig. 2). Originally these landscapes were covered by semideciduous seasonal forest and sparse savannah woodlands (Cerrado Biome). However, these have been converted into small and highly fragmented forest patches (3.5%), pastures and crops (68.9%) and the other non-vegetative structure (27.6%) (MapBiomas v.3.1, 2019). Local climatic conditions are CWA (i.e. subtropical, humid climate with warm, humid summers, and mild to cool winters; Köppen, 1948), with a mean annual temperature of 23°C and mean annual rainfall of 1500mm (Costa, 1998).
, where we selected eight landscapes. In each large landscape, we selected 10 sampling scattered trees, where we measured landscape metrics at finer scale (B, considering 100m buffers around the scattered trees), except for 1 landscape that sampled 9 trees.")
Study area in human-modified landscapes in Atlantic Forest, Brazil. We used a stratified random strategy considering two spatial scales to define the sampling units. At larger scale (A, considering 1.5km buffers around the centroid of the focal forest patch), where we selected eight landscapes. In each large landscape, we selected 10 sampling scattered trees, where we measured landscape metrics at finer scale (B, considering 100m buffers around the scattered trees), except for 1 landscape that sampled 9 trees.
In our sample design, we used a stratified random strategy (Fortin and Dale, 2005) with two spatial scales to define the sampling units (Fig. 2). For the larger scale (using 1.5km buffers around the centroid of the focal forest patch) we selected eight landscape sites using the following criteria: (1) presence of second-growth semideciduous forest fragments larger than 10ha, and surrounded by open matrices (where an open matrix was defined as pastures or annual monocultures of corn and sugarcane harvested at the time of sampling data); (2) presence of at least 10 scattered trees distributed along a distance gradient to the focal sampling forest patch (mean=85.0±90.2.2; ranging from 0 to 371); short variation forest cover amount among selected landscapes (mean=15.1±5.4%; range from 5.7 to 22.7%).
At a finer scale, using <200-m buffers around the scattered trees, we selected for sampling 10 scattered trees in each landscape site (except for one site where 9 sampleable trees were present), using the following criteria: (1) tree size gradient (mean=9.1±5.1m; range from 3 to 30m); (2) at least 100m far from another sampling trees (based on empirical data of bird perceptual range, Ibarra-Macias et al., 2011).
Landscape analysisWe made a visual supervision classification of the eight landscape sites considering 1.5km buffers around the centroid of the focal forest fragment, using Bing Maps images. We defined three landscape classes: forest (forest patches≥0.5ha), open matrix (pastures and annual crops) and scattered trees (isolated trees or forest patches<0.5ha, and surrounded by open matrices). Then, we used a multiscale approach to calculate fine landscape scale metrics, considering the sampled trees as individual centers of fine landscape scale landscape analysis and defining concentric buffers of varying spatial scales: 25, 50, 100, 200m radius (based on empirical gap-crossing studies, Awade et al., 2017; Fischer and Lindenmayer, 2002). We also calculated the tree aggregation index to express the configuration of scattered trees at a spatial scale of 100-m radius (Appendix Bsupplementary information, Tables S1 and S2). We did all classifications and metric calculations using the program FRAGSTATS 4.2 (McGarigal et al., 2012) and ArcGis 10.5 (ESRI, 2011).
Bird species dataWe used adaptations of three bird sampling methods, including line transect, point count, focal tree sampling (Develey, 2003; Sutherland, 2006). We used line transects to evaluate the gap size that birds must traverse from a focal forest patch (located in the center of the landscape) to any other landscape element (forest patch or scattered trees). Typically, these kinds of studies involve experimental translocation of individual birds across gaps and observing their post-release movements. However, we wished to measure gap size under natural conditions, so we used the line transect method. Accordingly, we walked along a 1000m line transect (500m and 500m back) along the edge of the focal forest patch at a speed of 10m/min. We recorded all birds entering and leaving from forest patch, then we described for each bird moving across patches the bird species, number of individuals, landscape elements (forest patch or scattered trees) that birds used as origin or destination, and the visually estimated the gap size. In cases where the gap size was in question, we checked it later on Google Earth Map, considering the linear distance between bird's origin and destination. Although, we took care to register only one movement path (flight out or arrival at focal forest patch) to avoid double counting, the line transect method has limitations because the individuals were not marked or tagged. So, it is possible to have sample bias due to double counting the same individual at another time or location.
We used focal tree sampling to record the abundance of species that perched on each sampled scattered tree to construct bird activity profiles in such trees. We made observations in 20min blocks, recording the abundance and identifying species that perched in target trees (Le Roux et al., 2018). In addition, we recorded bird behaviors in the trees (perching, feeding, resource defense and reproduction) and any specific traits (tree size being used as a proxy for perching spot) or resource (presence of fruits, flowers, and nests) that could increase their choice of trees. We excluded raptors and vultures from focal tree dataset, due to their inadequate trophic position to test our hypotheses.
To evaluate the potential predation risk, we recorded bird predator abundance (seen or heard) using point counts at the same time we did the focal tree sampling. We defined sampling area as a zone of a 50-m radius around the sampling tree. We classified the bird species as predators according to descriptions in the literature (Santos and dos Rosado, 2009; Sick, 1997; Travaini et al., 2001; Vargas et al., 2007). We classified all sampled species based on forest dependence (high, medium and low) according to the description in del Hoyo and Collar (2014, 2016) (Appendix Bsupplementary information, Table S3). In this classification, we included non-forest species in low forest dependence group. We made the entire suit of observations twice in each landscape site, in consecutive days from October 2012 to August 2013, from the onset of sunrise to 9:30 AM.
Statistical analysesWe tested all hypotheses using generalized mixed-effect models (GLMM, functions lmer and glmer, package lme4; Bates et al., 2011) with Poisson distribution (log link, for counting data) and Normal distribution (for continuum data). We fitted these models using as random effects the “landscape identity” on a larger scale (buffer 1500m) and the “time” of sampling data. We did this to account for the repeat times (twice) that we sampled each landscape. For the second and third hypotheses, we also included “scattered tree identity” as random effect due to the nested sampling design of the dataset.
In Gap-crossing hypothesis we used the “number of crossing events” as the dependent variable and the “landscape element” as fixed effect. We compared this model with the null model (without predictive variable). For the “frequency of gap size”, we also used the “landscape element” as fixed effect and compared it with the null model.
For the Scattered tree traits hypothesis, we used the “number of bird visits” in scattered trees as dependent variables and as fixed effects the “bird behavior” (perching, feeding, resource defense and reproduction), plant species trait (tree size, presence of fruits, flowers, and nests) and the “scattered tree distance” from the nearest forest patch. All models contained “bird behavior”, but for the other predictive variables, we made several combinations, including and excluding them.
In the landscape factors hypothesis, we used the “number of bird visits” in scattered trees as response variable and as fixed effect and landscape metrics and number of predators as fixed effects. For these models, we also included the tree size as random effects, due to their higher importance as predictive variables shown in the second hypothesis analysis (scattered tree traits). We fitted simple, additive models, combining these predictive variables (Appendix Bsupplementary information, Tables S1 and S2). We constructed these models considering “all bird species” and by groups of forest dependence (high, medium and low dependence) to examine the variation animal response with landscape change.
Next, we ranked these models and estimated which one of them best described observed bird abundance on scattered trees, using the Akaike information criterion (AIC, Akaike, 1974; Symonds and Moussalli, 2011). In our analyses, the best model had the lowest AIC value. However, if the difference between the AIC value of the best model and the AIC value for each of the other models was lower than 2 (ΔAIC≤2.0), we also considered these as good as the best one. Additionally, we measured the Akaike weight (wi), which ranges from 0 to 1, and can be considered analogous to the probability that a given model is the best approximating model. Thus, higher values of wi can be interpreted a high probability that a model is the best one. We calculated all these indices using AICctab function, of “bbmle” package (Bolker, 2017). Due to risk in only comparing models with low capacity of representing the reality, we also compared these models with the null model and evaluated the residual assumptions of the best model. We conducted all analysis in the R environment, version 3.3.1 (R Development Core Team, 2016).
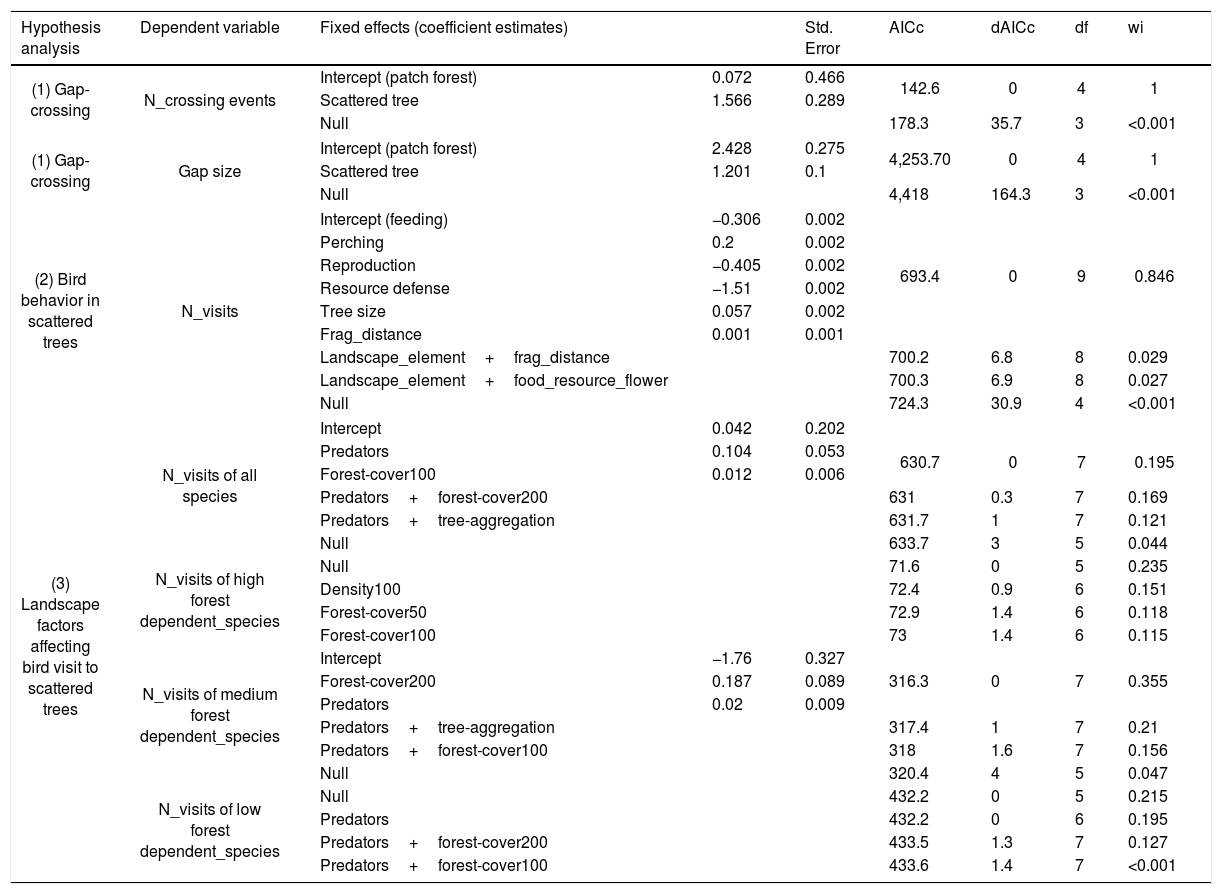
ResultsWe recorded 70 bird species (N=322 individuals) moving across open matrices and perching in scattered trees (Appendix Bsupplementary information, Table S3). From all species, 13% had high, 46% medium, and 41% low forest dependence. Considering all crossing movements, the most plausible models showed that the “number of crossing events” and the “gap size” varied with “landscape elements” (Table 1). The crossing movements to scattered trees were more frequent and in larger gaps than the between habitat patches (Fig. 3(1A)). The mean gap size to scattered trees was four times larger than between habitat patches (mean±SDstepping stones=40.4±57.0m; mean±SDbetween patches=10.9±11.6m, Fig. 3(1B)).
The best three generalized linear mixed-effect models (GLMM), ranked according to ΔAICc values, showing fixed effects used in the models. We also showed the null model for model performance evaluations. Formula for hypothesis (1) dependent variable∼fixed effect+(1|ID_large_landscape)+(1|time); formula for hypotheses (2 and 3) dependent variable∼fixed effect+(1|tree_size)+(1|ID_large_landscape/ID_fine_landscape)+(1|time). “+” corresponds to additive effects between variables, “|” represents the ID_large_landscape and time random effects in the model, / represents nested sampling design of ID_fine_landscape.
| Hypothesis analysis | Dependent variable | Fixed effects (coefficient estimates) | Std. Error | AICc | dAICc | df | wi | |
|---|---|---|---|---|---|---|---|---|
| (1) Gap-crossing | N_crossing events | Intercept (patch forest) | 0.072 | 0.466 | 142.6 | 0 | 4 | 1 |
| Scattered tree | 1.566 | 0.289 | ||||||
| Null | 178.3 | 35.7 | 3 | <0.001 | ||||
| (1) Gap-crossing | Gap size | Intercept (patch forest) | 2.428 | 0.275 | 4,253.70 | 0 | 4 | 1 |
| Scattered tree | 1.201 | 0.1 | ||||||
| Null | 4,418 | 164.3 | 3 | <0.001 | ||||
| (2) Bird behavior in scattered trees | N_visits | Intercept (feeding) | −0.306 | 0.002 | ||||
| Perching | 0.2 | 0.002 | ||||||
| Reproduction | −0.405 | 0.002 | 693.4 | 0 | 9 | 0.846 | ||
| Resource defense | −1.51 | 0.002 | ||||||
| Tree size | 0.057 | 0.002 | ||||||
| Frag_distance | 0.001 | 0.001 | ||||||
| Landscape_element+frag_distance | 700.2 | 6.8 | 8 | 0.029 | ||||
| Landscape_element+food_resource_flower | 700.3 | 6.9 | 8 | 0.027 | ||||
| Null | 724.3 | 30.9 | 4 | <0.001 | ||||
| (3) Landscape factors affecting bird visit to scattered trees | N_visits of all species | Intercept | 0.042 | 0.202 | ||||
| Predators | 0.104 | 0.053 | 630.7 | 0 | 7 | 0.195 | ||
| Forest-cover100 | 0.012 | 0.006 | ||||||
| Predators+forest-cover200 | 631 | 0.3 | 7 | 0.169 | ||||
| Predators+tree-aggregation | 631.7 | 1 | 7 | 0.121 | ||||
| Null | 633.7 | 3 | 5 | 0.044 | ||||
| N_visits of high forest dependent_species | Null | 71.6 | 0 | 5 | 0.235 | |||
| Density100 | 72.4 | 0.9 | 6 | 0.151 | ||||
| Forest-cover50 | 72.9 | 1.4 | 6 | 0.118 | ||||
| Forest-cover100 | 73 | 1.4 | 6 | 0.115 | ||||
| N_visits of medium forest dependent_species | Intercept | −1.76 | 0.327 | |||||
| Forest-cover200 | 0.187 | 0.089 | 316.3 | 0 | 7 | 0.355 | ||
| Predators | 0.02 | 0.009 | ||||||
| Predators+tree-aggregation | 317.4 | 1 | 7 | 0.21 | ||||
| Predators+forest-cover100 | 318 | 1.6 | 7 | 0.156 | ||||
| Null | 320.4 | 4 | 5 | 0.047 | ||||
| N_visits of low forest dependent_species | Null | 432.2 | 0 | 5 | 0.215 | |||
| Predators | 432.2 | 0 | 6 | 0.195 | ||||
| Predators+forest-cover200 | 433.5 | 1.3 | 7 | 0.127 | ||||
| Predators+forest-cover100 | 433.6 | 1.4 | 7 | <0.001 | ||||
Note: The criteria for acceptable ΔAIC values were less than 2.0 and wi higher than 0.1. N_crossing events=number of gap-crossing events, gap size=gap distance from the edge of focal patch forest to landscape element (scattered trees or any other patch forest), N_visits=number of bird visits considered all species and grouped by forest species dependence (high, medium and low); tree_size=height of sampling scattered tree (m); tree_aggregation=scattered tree aggregation index (clumpy, considering circular buffer radium=100m around sampling scattered tree); density100=Kernel density of scattered trees (n/ha) in a neighborhood around the sampling scattered tree, considering circular buffer radium=100m around sampling scattered tree; forest_cover=percent of forest amount in surrounding the sampling scattered tree (considering circular buffer radium=100m (forest_cover_100) and 200m (forest_cover_200) around sampling scattered tree); predators=number of potential predators close to the scattered tree; Null=Null Model.
: 1. Gap-crossing: (A) Boxplots of number of crossing events by birds between habitat patches and using scattered trees as stepping stones. (B) Histogram of density of gap sizes between habitat patches and using scattered trees as stepping stones; 2. Scattered trees traits: Fit of best GLMM additive model considering the number of visits of all bird species in scattered trees. We fitted this model using the number of bird visits in scattered trees as dependent variable and as fixed effects on bird behavior (perching, feeding, resource defense, and reproduction), tree size and the scattered tree distance from the nearest forest patch (frag_distance). For frag_distance, the values are chosen as grouping levels in the plots, which are the mean-value and ±1 standard deviation; and 3. Landscape factors: Fit of best GLMM additive model considering the number of visits of all bird species in scattered trees. We fitted this model using as predictive variables the forest cover (%), considering circular buffers radium=100m around sampling scattered tree, the tree size and number of predators. The 95% confidence intervals are given as shading (Table 1).")
Graphical representation of three hypotheses related with natural bird movements in open matrices, within different landscape structures (scattered tree configuration and habitat amount): 1. Gap-crossing: (A) Boxplots of number of crossing events by birds between habitat patches and using scattered trees as stepping stones. (B) Histogram of density of gap sizes between habitat patches and using scattered trees as stepping stones; 2. Scattered trees traits: Fit of best GLMM additive model considering the number of visits of all bird species in scattered trees. We fitted this model using the number of bird visits in scattered trees as dependent variable and as fixed effects on bird behavior (perching, feeding, resource defense, and reproduction), tree size and the scattered tree distance from the nearest forest patch (frag_distance). For frag_distance, the values are chosen as grouping levels in the plots, which are the mean-value and ±1 standard deviation; and 3. Landscape factors: Fit of best GLMM additive model considering the number of visits of all bird species in scattered trees. We fitted this model using as predictive variables the forest cover (%), considering circular buffers radium=100m around sampling scattered tree, the tree size and number of predators. The 95% confidence intervals are given as shading (Table 1).
Considering all individuals visiting the scattered trees, the most plausible model explaining the scattered tree visits included “bird behavior”, “tree size”, and “scattered tree distance” to the nearest patch (Table 1). The tree visits were principally for perching, feeding and reproducing and these behaviors increased non-linearly with the tree size and distance of tree to the nearest patch (Fig. 3(2) and Table 1).
The main landscape factors that positively influenced the scattered tree visits of all bird species are forest cover amount (spatial scales: 100 and 200m radius) and tree aggregation that present in the first three plausible models (Table 1). However, it is important to highlight that all these models have the additive effect of the number of predators (mean=0.6±1.2.2; range from 0 to 8), suggesting the decision-making movements should combine the landscape factors and predation risk (Fig. 3(3)). This result primarily reflects the response of bird species with medium dependence, which showed similar results in model selection. For high and low forest dependent species, none of our predictive variables adequately explained their variation in tree visits (Table 1).
DiscussionWe tested three hypotheses examining how scattered trees influenced natural bird movement throughout the open matrix. Our results reinforce the idea that scattered trees efficacy as stepping stones and/or as a source of resources is mainly conditioned by the following three factors: predation risk, tree size, and the landscape context in which the trees are inserted in the open matrix (Fig. 1). When birds move outside forest patches, they fly to patches and scattered trees. However, the movement between habitat patches was more frequent in shorter gaps (mean distance=10.9m). For larger gap size (mean distance>40.4m) the addition of scattered trees as stepping stones is essential in reaching the neighboring habitat patches. The functional drivers of scattered trees are mainly related to perching, eating, and reproducing, and their functions increase with the tree size and distance to the nearest patch. In relation to landscape context, they prefer scattered trees surrounded by higher amounts of forest cover or with a network of higher aggregation of scattered trees. All these decision-making outcomes suggest antipredatory strategies during the movement across the landscape, including: (1) reducing the distance required to reach safer shelter; (2) choosing larger scattered trees as stepping stones, which improve a bird's ability to detect predators, before deciding on the next movement; (3) choosing the movement path in the landscape context which most reduces the ability of predators to detect them or increases the probability of escape from a predator. These results vary according to animal sensitivity to anthropogenic landscape change.
1. Gap-crossing hypothesis. A variety of studies have shown a large number of bird species prefer to travel under forest cover and often hesitate to cross an open matrix (Bélisle and Desrochers, 2002; Dale et al., 2006). When they traverse such areas, our results showed that they preferred a movement path with scattered trees in short gap size (i.e., mean 40m). This result is consistent with experimental gap-crossing studies of birds and arboreal mammals in fragmented landscapes (range from 25 to 85m; Bélisle and Desrochers, 2002; Boscolo et al., 2008; Doerr et al., 2011a,b; Ibarra-Macias et al., 2011; Ree et al., 2003; Robertson and Radford, 2009). Physiological/morphological limitations have been proposed as an explanation for such constrained movement (Ree et al., 2003; Stratford and Robinson, 2005). Another explanation, however, may be related to a trade-off between the costs of predation risk which increases with gap size and the benefit to gap-crossing (e.g., to eat, find shelter or mates; Duggan et al., 2012; Robertson and Radford, 2009).
2. Scattered tree traits hypotheses. We found that scattered tree visits were mainly for perching, feeding and reproducing and these behaviors increased non-linearly with the tree size. A preference for larger trees as a source of resources (e.g. flowers, fruits, and nest sites) and to reduce predation risk has already been demonstrated by other researchers (Götmark and Post, 1996; Rodriguez et al., 2001; Le Roux et al., 2018; Stagoll et al., 2012). These studies suggest that larger trees support complex canopies with higher resource availability and safer sightlines, allowing birds to have a clear view of the surroundings while remaining concealed. Such vantage points would help in predator vigilance while deciding the next movement (Dale et al., 2006; Le Roux et al., 2018). Thus, a bird can increase the amount of time spent in vigilant observation of clearly visible surroundings by perching in larger trees (Morrison, 2011).
Another explanation for the larger tree preference is that larger trees provide better view of the landscape than smaller ones. When a bird perches in larger trees it has greater access to landscape information, helping it in its decision-making process. A bird exploring an unknown landscape (like young dispersers) can use larger trees to better see potential habitats and safer paths (Yoder et al., 2004). A resident species, otherwise, can use these trees to better see the landmarks, which in turn, increase its orientation during the movement across the matrix (Able, 1991). Landmark use could reduce the time and energy birds spend moving from one place to another (Biro et al., 2002; Biro et al., 2007). Although this explanation is directly unrelated to an anti-predatory strategy, reducing time and energy moving across a matrix, and also viewing and choosing a safer path, could reduce predation risk, and could complement the vigilance hypothesis.
Even with a secondary effect, it is impossible to discard the tree distance to the nearest forest patch as also determinant in modulating bird behavior. However, contrary to our initial predictions, tree visits were positively affected by the tree distance. This result was unexpected given the tree distance is proportional to time spent and energy expenditure in environmental conditions with high mortality risks (Awade et al., 2017). We therefore expected a decrease in the number of tree visits for feeding and reproduction with the distance to the nearest forest patch (see Hypothesis 2, Introduction), as in previous studies (Estrada et al., 2000; Uezu et al., 2008). An explanation for this finding might be that the distance effect can be compensated by the spatial arrangement of the structural connectivity in the matrix. Structural connectivity refers to the presence of habitat elements too small for settlement, but which might nonetheless facilitate movement, such as scattered trees and corridors (Doerr et al., 2011a,b). Thus, while larger tree distances to a habitat patch may impose limits on accessibility by birds, the use of the network of scattered trees may reduce the distances covered in a single flight and offer shelter opportunities while traveling to reproduce or eat (Fig. 1).
3. Landscape factors hypotheses. There is empirical evidence that animals use multiple environmental cues to choose antipredatory strategies in their movement path (Duggan et al., 2012), to increase the probability of escape if attacked, or to reduce their chance of detection (Cristescu et al., 2013; Lima and Dill, 1990; Thorson et al., 1998). Among such decision-making, our results show that birds prefer to visit scattered trees surrounded by higher amounts of forest cover or with a network of higher aggregation of scattered trees, mainly during periods with a higher abundance of predators. The increase in forest cover directly decreases the gap size (Fahrig, 2003), and hence increases the likelihood of the forest patches occurring within the animal's perceptual range. Thus, an animal in a scattered tree is able to detect the forest patch from a distance. This perception is important reducing time spent looking for a safe shelter (in preferred habitat), in the event that it will be attacked (Safety distance, Lima and Dill, 1990; Fahrig, 2007). In addition, the rate of movements outside of the patch will increase in shorter gaps, because the influence of physiological limitations to sustain flight across the matrix should be lower in this landscape context (Ibarra-Macias et al., 2011).
The spatial aggregation of scattered trees is likely to influence tree visits for at least three reasons. First, tree aggregation tends to decrease the gap size between landscape elements (forest patches and scattered trees), which should favor the frequency of movements in the matrix and eventually the tree visits (Kallimanis et al., 2006). Second, tree visits also increase because the higher tree aggregation may be more attractive (resource availability) and easier to detect in the landscape. Finally, the networks of aggregated trees increase the complexity of linkages (Graph-theoretic connectivity, Urban and Keitt, 2001) and thus, it offers different routes to move or more opportunities for animals to visit the neighboring trees (Goodwin and Fahrig, 2002).
Our results should be considered in the light of some sample limitations. Firstly, our findings cannot be extrapolated to all bird species, because they are mainly based on movement of medium forest-dependent bird species. We had insufficient sample size for high forest dependent species in order to conclude valid results. Future studies should intensify the sample effort to increase the number of crossing events for these species. The second potential limitation was related to the gap size between patch habitats. Our analysis showed a large standard deviation and the non-normal distribution for this result. It is probably a consequence of selection bias of our landscapes, because we selected landscapes with low forest cover (mean=15.1±5.4%; ranging from 5.7 to 22.7%) and high fragmentation. With this landscape structure, most of the gap sizes are larger than the bird gap-crossing ability that we previously predicted. Thus, future studies should increase the forest cover gradient to collect more appropriate distribution of gap-crossing.
General implications for conservation and management recommendationsAlthough scattered trees receive little attention in land use and conservation planning, our results highlight the use of scattered trees as a feasible and effective way of increasing landscape connectivity and resources for bird species. This is feasible given the small areas they might occupy, and essential due to fragmentation condition of the tropical forests (Taubert et al., 2018). For example, the mean gap size in Atlantic Forest is 1441m (Ribeiro et al., 2009); this gap is larger than the bird gap-crossing ability registered in our study (mean±SD=10.9±11.6m). Thus, if the spatial distribution of the scattered trees will be appropriately designed and managed, the functional connectivity of these tropical forests is able to be restored, without much reduction in farm productivity or complication of farm management. An important caveat regarding the scattered trees spatial distribution is that they should be located no more than 40m from another landscape element (forest patches or scattered trees). At larger gaps, we predicted an abrupt decline in the likelihood of movement and consequently scattered tree efficacy as stepping stones (critical spatial threshold, Sauria et al., 2014). Previous studies recommended greater gap size to achieve functional connectivity restoration (ranging from 50 to 100m, Doerr et al., 2011a,b; Ibarra-Macias et al., 2011; Kay et al., 2016; Ree et al., 2003). However, we suggested the gap limit could be revised down to 40m, mainly based on natural bird movement across open matrices.
Another conservation strategy should be to preserve and actively plant high floristic diversity among these scattered trees, preferably different architecture with species that provide fruits and flowers to higher animal diversity yearlong. If it will be implemented in some less productive parts of the farm, this strategy is able to restore the farm forest cover (applied nucleation, Corbin and Holl, 2012). The restoration via applied nucleation involves establishing clusters of very fast-growing trees throughout an open area that currently lack cover. These clusters will naturally expand via subsequent recruitment of new seedling dispersed by birds or other animals. However, it is important to consider the landscape context in which these clusters will be planted. Our results suggest that birds prefer to visit the larger nuclei (higher aggregation of scattered trees) and are surrounded by higher forest cover.
Our last concern is related to the movement modeling. Although animal movement modeling has provided a powerful tool for exploring alternative management strategies for species conservation in fragmented landscapes, our results reinforce the necessity of incorporating into these models of movement behavior that are shaped at the finer scale (Lechner et al., 2015; Prevedello et al., 2018; Vuilleumier and Metzger, 2006). Typically, modeling studies occur at larger scales - regional to global scales (i.e., a resolution>30m; Hatfield et al., 2018; Pelletier et al., 2014), and are limited in their capacity to incorporate appropriately fine scale features like scattered trees (Doerr et al., 2011a,b). We observed that the use of scattered trees as stepping stones were more frequent and in larger gaps than the gap-crossing between habitat patches. Due to their numerical relevance in fragmented landscapes, scattered trees allow birds to use multiple pathways (diverse routes) and to reach different patches, decreasing the gap that they have to cross in a single passage across an open matrix. Thus, we believe that these modeling approaches could more realistically simulate animal movements, if they were to consider scattered trees as stepping stones in fragmented landscapes (Saura et al., 2014).
FundingThis study was funded by the Foundation for Research Support of the State of Minas Gerais (FAPEMIG) and Vale S.A. (Process #RDP-00104-10).
Conflicts of interestAuthor Cristina Magalhães Siva has received research grants (Master's scholarship) from Foundation for the Research Support of the State of Minas Gerais (FAPEMIG).
The corresponding authors ensure that none of the financiers of the project took part in any part of the project's development, such as data gathering, analysis, results interpretation, writing, or any decision to submit this paper for publication.
Uncited references
Barros et al. (2019), Kotler et al. (1991), Lloyd and Marsden (2011), Orrock et al. (2004), Prevedello et al. (2010), Projeto MapBiomas (2019), Ridgely and Tudor (1994, 1997), Simberloff et al. (1992) and Stotz et al. (1996).
AcknowledgmentsWe thank the Foundation for Research Support of the State of Minas Gerais (FAPEMIG) and Vale Sociedade Anônima for financial support, provision of equipment, and a Master's degree scholarship (Process #RDP-00104-10). We are grateful to Pedro Herman Soares Vilela for helping us with the maps and figures. We also thank the researchers of the Laboratory of Ecology and Forestry Fragments (ECOFRAG) and two anonymous reviewers for valuable comments on the manuscript. Jim Hesson revised the manuscript (https://www.academicenglishsolutions.com).
The following are the supplementary data to this article:

