


Integrated assessments of multiple natural capital and ecosystem services and disservices (ESD) are needed to guide research and management in South America. Unfortunately, a poor understanding of the drivers of ESD and a scarcity of data undermine these efforts. Here, we combine expert knowledge and network analyses to create conceptual system maps to support the research and management of multiple ESD. Using the example of the Lules River watershed (northwestern Argentina), we integrated the biotic, abiotic, socio-economic, and policy drivers of five ESD selected due to their relevance to human well-being and biodiversity conservation in the area: (i) aboveground carbon stock; (ii) water quality; (iii) water quantity; (iv) dengue transmission; and (v) leishmaniasis transmission. Through facilitated activities, we encoded expert knowledge into networks representing drivers and causal interactions between those drivers. We recorded 43 drivers, of which 18 were identified as key drivers based on network metrics. The majority of key drivers were abiotic and socio-economic drivers (38.9% and 33.3% of 18, respectively), and we found potential information sources for all of these key drivers. Conceptual system maps provided significant benefits for guiding ESD research and ecosystem-based management. First, they formalised our current understanding of the system and provided a model that can be updated with new information. Second, they can be analysed through established network metrics to uncover relationships critical to effective system-level management and identify key drivers for data-gathering efforts. These maps offer a rapid and interdisciplinary tool to overcome existing barriers to integrated assessments in data-poor areas and are a powerful method to support system-based approaches to environmental management.

The interplay between natural and social facets of socio-ecological systems yields services essential to human well-being and cultural identities, and increasing pressures imperil access to these services (Bateman and Mace, 2020). The natural capital and ecosystem services framework represents a promising, yet challenging and complex approach to attain sustainability (Bateman and Mace, 2020; Mandle et al., 2021; Van Wensem et al., 2017). This approach focusses on managing natural capital, the stocks of natural (biotic and abiotic) components of ecosystems, and the services derived from them (the flows that benefit humans) to formulate policies to foster sustainability and equity (Bateman and Mace, 2020; Boerema et al., 2017; Mandle et al., 2019; Potschin and Haines-Young, 2016). Due to direct and indirect interactions between them, boosting certain ecosystem services can lead to the simultaneous provision of additional services (Bennett et al., 2009; Lee and Lautenbach, 2016; Ruiz-Agudelo et al., 2020). Alternatively, trade-offs can arise when managing one ecosystem service results in declines in the delivery of other ecosystem services (Ruiz-Agudelo et al., 2020; Bennett et al., 2009). Relatedly, certain ecosystem processes can also adversely affect human well-being, resulting in ecosystem disservices, which occur concurrently with ecosystem services (Campagne et al., 2018; Saunders, 2020; Shackleton et al., 2016). Examples include increases in vector-borne diseases associated with water bodies supplying water to human populations. All these aspects are compounded by the varied perspectives and views of ecosystem services and disservices that different societal sectors hold (Alberti et al., 2024). These complexities translate into a challenging scenario for researchers and managers interested in applying the natural capital and ecosystem services framework (Bateman and Mace, 2020; Mandle et al., 2021; Villarreal-Rosas et al., 2020).
While ecosystem services and disservices and natural capital (ESD, hereafter) are crucial to humankind everywhere, they play an even more prominent role in heavily resource-dependent economies exemplified by those in South America (Fanelli, 2018; Laterra et al., 2019). In these countries, balancing the sustainable and equitable delivery of multiple ecosystem services while mitigating disservices is a pressing but complicated task in the face of continuous erosion of natural capital (Bennett et al., 2009; Fanelli, 2018; Laterra et al., 2019). Effectively navigating the challenges of ESD research and management requires two elements: 1) adequate conceptual and quantitative models accounting for the direct and indirect environmental, social, and economic drivers of multiple ESD (Chaplin-Kramer et al., 2024; Ruiz-Agudelo et al., 2020; Sang, 2020; Villarreal-Rosas et al., 2020); and, 2) accurate and representative information on those drivers and the associated ESD (Boerema et al., 2017; Ruiz-Agudelo et al., 2020; Willcock et al., 2023). Unfortunately, limited data availability (Andrew et al., 2015; Willcock et al., 2023), a patchy understanding of ESD dynamics (Aragón and Baldi, 2024; Boerema et al., 2017), and a tendency for an overreliance on easily accessible ecosystem services modelling tools (Andrew et al., 2015; Ruiz-Agudelo et al., 2020), results in ESD research and management being frequently driven by data and model accessibility rather than by the needs of ESD researchers and managers.
System maps have emerged as a useful approach to model the interactions between the environmental, social, and economic components of a system and their influence on ESD delivery (Landuyt et al., 2013; Ruiz-Agudelo et al., 2020; Smith et al., 2018). Conceptual system maps formalise relationships between multiple types of variables, linking ESD and their drivers (e.g., social and environmental features), and uncovering potential emergent effects, trade-offs, and synergies (Barbrook-Johnson and Penn, 2022). Recent applications rely on expert knowledge, often coupled with quantitative data to produce system maps such as Bayesian Belief Networks to understand and analyse models of ESD dynamics (Landuyt et al., 2013; Smith et al., 2018). An underexplored, yet promising alternative for modelling and supporting ESD research and management is the combination of expert-based conceptual system maps and network analyses to investigate them (Ruiz-Agudelo et al., 2020; Zango-Palau et al., 2024). Networks have been used often to model interacting components (e.g., species) of ecosystems (Geary et al., 2020). Their analysis can illuminate the role of drivers and ESD in any mapped system in which the links represent causal relationships, even in the absence of quantitative information.
Here, we build and analyse a comprehensive expert-based conceptual map of the socio-ecological system driving five ESD in the Lules River watershed, a sub-tropical area in northwestern Argentina (Province of Tucumán; Fig. 1). The diversity of environments, the extensive sugarcane and citrus plantations and their associated industries, and the anthropogenic influence exerted by the metropolitan area of Gran San Miguel de Tucumán (population c. 1 million) have resulted in varied pressures to the environment and the use of the natural resources of the watershed to meet the needs of the population (Fernández and Barber, 2011; Jimenez et al., 2021). In addition, dengue and leishmaniasis constitute significant public health issues in the area (Madariaga and Simoni, 2023). To hollistically address these challenges, we focussed on five vital ESD that shape human well-being and ecosystem processes in the watershed and are undergoing sharp alterations due to land cover changes, the expansion of urban areas, the increase in human population, and the spread of invasive forests (Fernández and Barber, 2011; Jimenez et al., 2021). These ESD are: (i) aboveground carbon stock; (ii) water quality; (iii) water quantity; (iv) dengue transmission; and (v) leishmaniasis transmission. These five ESD afforded us an excellent opportunity to evaluate the usefulness of combining systems mapping and network analysis to tackle complex research and policy scenarios while keeping the system and analyses tractable.
 Location within South America and Argentina; (B) Boundaries of the watershed showing the city of San Miguel de Tucumán (middle right), and the different land uses and land cover (two alien tree forests are highlighted: Ligustrum lucidum: glossy privet; Gleditsia triacanthos: honey locust); (C) Hillshade topography of the Lules River watershed showcasing the variation in the ruggedness of the watershed. Maps were generated using QGIS, OpenStreet layers, NASA’s SRTM Digital Elevation map (Farr et al., 2007) accessed through Google Earth Engine, and land use maps from Jimenez et al. (2021).")
Geographical location and topography of the Lules River watershed (A) Location within South America and Argentina; (B) Boundaries of the watershed showing the city of San Miguel de Tucumán (middle right), and the different land uses and land cover (two alien tree forests are highlighted: Ligustrum lucidum: glossy privet; Gleditsia triacanthos: honey locust); (C) Hillshade topography of the Lules River watershed showcasing the variation in the ruggedness of the watershed. Maps were generated using QGIS, OpenStreet layers, NASA’s SRTM Digital Elevation map (Farr et al., 2007) accessed through Google Earth Engine, and land use maps from Jimenez et al. (2021).
Our ultimate goal was to describe direct and indirect relationships between ESD and their drivers to identify key system components that can be leveraged for targeted data collection and to support ESD management. Our case-study is part of the ROSA initiative (the Spanish acronym for Andean Network of Socio-Ecological Observatories), a collaborative South America-wide network of monitoring schemes implementing participatory monitoring of socio-ecological systems to inform sustainable land management (Carilla et al., 2024). Therefore, our work showcases the use of systems-based tools to guide research with the potential for uptake across mountainous areas in South America.
MethodsStudy areaThe River Lules watershed belongs to the Salí-Dulce River basin and is located in the Province of Tucumán (northwestern Argentina; centre at approximately −26.77º, −65.49° EPSG:4326; Fig. 1). The watershed covers 1119 km2, ranging from 362 to 4735 masl, and encompasses a rich diversity of environments (Fernández and Barber, 2011; Jimenez et al., 2021). These span from urban and peri-urban areas mixed with sugarcane and citrus plantations in the lower reaches, Yungas and Chaco native forests in the mid-reaches, to high-mountain ecosystems in the westernmost areas (Fig. 1). The climate is humid with a marked monsoonal season resulting in a mean annual precipitation of 1200 mm concentrated during the summer (Fernández and Barber, 2011). Mean annual temperatures range between 18° and 20 °C, reaching a maximum of over 40 °C during the summer and a mean temperature of 12 °C in the winter (Fernández and Barber, 2011). The metropolitan area of Gran San Miguel de Tucumán (population c. 1 million) lies partly inside the northeastern boundaries of the Lules River watershed (Fig. 1). These environmental and socio-economic conditions have led to high rates of deforestation in the lower reaches of the watershed, a marked seasonal availability of water, the pollution of waterbodies, and the emergence of dengue and leishmaniasis.
Encoding expert knowledge into a conceptual system map of causal relationshipsWe conducted a facilitated and collaborative mapping activity between November 2023 and March 2024 in which groups of experts developed consensus sub-maps for each of the five ESD. These sub-maps were integrated into a single conceptual system map incorporating the five ESD, which was revised and approved by all experts following a multi-stage procedure aimed at achieving consensus among experts (Box 1).
Building conceptual system maps of ecosystem services and disservices from expert knowledge.
Expert knowledge is widely used in the fields of conservation, ecosystem modelling, and the management of ecosystem services to acquire information and conceptualise systems (García-Díaz et al., 2022; Groves and Game, 2016; Hemming et al., 2018). It is particularly useful when context-specific data are scarce (Hemming et al., 2018). However, the reliability of expert-based knowledge depends on the inclusion of experts with diverse backgrounds and the use of systematic and standardised approaches to reduce biases and collect accurate information (Groves and Game, 2016; Hemming et al., 2018). We adapted existing protocols for gathering and collating expert knowledge (e.g., García-Díaz et al., 2022; Groves and Game, 2016; Hemming et al., 2018) to accommodate our research questions and our logistical and funding constraints. This resulted in a 7-stage procedure aimed at producing a single conceptual map including all recognised drivers of five target natural capital and ecosystem services and disservices (ESD).
Research objectives, logistical limitations, and the availability of experts determine the format of the activities and the timeframes for acquiring expert-based knowledge. In our case, we aggregated our five ESD into three broad groups based on their similarity to ensure that each group had at least four participants with diverse backgrounds and a minimum of two years of experience working on the assigned ESD group. Sixteen participants from diverse backgrounds were assigned to each of those three groups. The groups of ESD were: 1) aboveground carbon stock (six participants); 2) water quality and quantity (six participants); and 3) vector-borne diseases (dengue and leishmaniasis; four participants). Our structured and systematic procedures combined individual and group activities, facilitated workshops, visualisations to create a shared understanding across groups, frequent discussions between and within groups, and regular engagement with a coordinator.

Fig. B1 Description and key elements of the seven stages of our procedures for encoding expert knowledge into a joint conceptual system map of the drivers of five ESD (aboveground carbon stock; water quality; water quantity; dengue transmission; and leishmaniasis transmission). These five ESD were aggregated into three groups.
Our core data collection instrument was a standardised spreadsheet that participants had to complete with information on drivers relevant to their assigned ESD (see example and instructions in the Appendix A). Sixteen participants were assigned to three groups aggregating our five ESD into bundles of similar ESD: 1) aboveground carbon stock (six participants); 2) water quality and quantity (six participants); and 3) vector-borne diseases (dengue and leishmaniasis; four participants). An additional participant worked across all three groups, providing feedback and critical insights throughout the activities. Another person acted as facilitator of the activity and integrated all sub-maps.
Fourteen of the 17 participants were instructed to list all biotic, abiotic, social, and economic drivers that might influence their respective ESD groups, and to complete their spreadsheets individually (Box 1). The other three participants were brought in during our facilitated workshops and subsequent group activities to provide an external perspective (García-Díaz et al., 2022). In addition, for each listed variable, experts were asked to include information on: i) what measure of the variable influences the ESD (categories: mean/median, variance, and accumulated); ii) the spatial scale at which the variable is commonly measured (population, site/locality, landscape, regional, and global); (iii) the spatial scale at which the variable influences the ESD (population, site/locality, landscape, regional, and global); (iv) the temporal scale at which the variable is commonly measured (event, years, decades, centuries, and millenia); (v) the temporal scale at which the variable commonly influences the ESD (event, years, decades, centuries, and millenia); (vi) whether the effect of the variable on the ESD is simultaneous or lagged; (vii) the primary type of variable (socio-economic, policies, biotic, and abiotic); and (viii) any other comments. The temporal and spatial scales were based on the classification of Woodmansee et al. (2021) to standardise the responses. An example spreadsheet and the instructions provided to the participants are available in the Appendix A.
After the 14 experts completed their individual spreadsheets, the group of 17 experts participated in a facilitated workshop on 18 December 2023, where they discussed their results and engaged with other participants. Afterwards, the three groups of ESD experts revised their spreadsheets, created unique lists for each of the five ESD, and drafted initial conceptual system sub-maps. These initial lists and sub-maps were presented and discussed during a second workshop with all 17 participants on 15 February 2024. After this workshop, each group produced a final consensus list and a consensus conceptual system sub-map (Box 1). In a final step, all lists and conceptual system sub-maps were integrated into a single joint conceptual system map that was approved by all participants. This final version was analysed to identify key drivers. The final consensus list of drivers and their definitions is available in Appendix A.
Network analyses to identify key drivers in the joint conceptual system mapThe final consensus map was represented as a network with the five ESD and their drivers as vertices, and the relationships between them as directed links using the igraph package in the R statistical environment (Csardi and Nepusz, 2006; R Development Core Team, 2019). Networks were visualised and analysed using packages ggplot2 and igraph (Csardi and Nepusz, 2006; Wickham, 2009). To characterise the network, we used two metrics measuring centrality and a metric of the connectivity between vertices, which represent drivers and ESD in our case (Box 2). We compared the importance of each driver in the system according to these three network metrics through pairwise scatterplots and by estimating Spearman’s rank correlations (ρ) to explore the relationships between different chracteristics of the vertices.
Network analyses to characterise conceptual system maps.
Networks can be studied using a diverse array of metrics. We evaluated the centrality of vertices in the network representing the drivers, the number of simple paths (i.e. sequences of links joining two vertices in the network, including indirectly via other vertices) between drivers and ESD, and a measure of direct connectivity between drivers. Therefore, we used the following metrics:
- i)
Betweenness centrality: the number of existing simple paths in the network that cross through a specific vertex (driver). It is a measure of how often a vertex lies on the simple paths between pairs of vertices in the network. A high value indicates high importance of the vertex for the structure of the network, behaving as a hub for connections between pairs of vertices.
- ii)
Number of simple paths: the total number of direct and indirect simple paths between that vertex and the ESD of interest - the higher the number, the higher the connections between that vertex and the ESD. We calculated this metric for both each ESD separately and for the five groups together.
- iii)
Out-degree: the number of outgoing links from the vertex to other vertices in the network - the higher the value, the higher the number of other variables influenced by this variable.

Fig. B2 Conceptual system map of the drivers of five ESD in the River Lules watershed. ESD are highlighted in green, and the size of the circles is proportional to the log-transformed total number of simple paths between each driver and the five ESD. A larger circle indicates a higher number of paths. Compare with Fig. 2 in the main text, which depicts an unscaled network.
To identify key drivers in our conceptual system map, we ranked the drivers according to their out-degree and the total number of simple paths from those variables to the five ESD (see Box 2 for definitions). We selected the top 15 drivers with the highest score from each ranking, and compared the rankings of each driver according to the two metrics. We merged the two independent lists of top 15 drivers according to both rankings as our priority drivers for guiding data acquisition efforts. The R script for conducting the network analyses is available from GitHub: https://gist.github.com/pablogarciadiaz/aa2c9b0eea7933c739f1eb4b22d04353, and the files containing the list of drivers and their links for building the network are available at the Appendix A.
ResultsOverall, we identified 43 drivers of our five ESD. We further identified 214 links including relationships among drivers and direct links with the five ESD (Fig. 1). Of the 43 drivers, 14 (32.6%) were socio-economic (e.g., agriculture and human population), 12 (27.9%) were primarily abiotic (e.g., elevation and temperature), 10 were biotic (23.3%; e.g., invasions and vegetation composition), and seven (16.3%) were policies that influence the system (e.g., telecoupling and sanitation; Table 1). Note that the variable ‘autodepuration’ (also termed self-purification) combines abiotic and biotic components, but we assigned it to the biotic category for simplicity. Direct links between ESD (i.e., not mediated by other variables) were relatively scarce (Fig. 2 and Table 1), except for water quality and water quantity influencing the ecosystem disservices dengue and leishmaniasis transmission. Water quantity also influenced water quality. A full list of drivers and their definitions is available in the Appendix A.
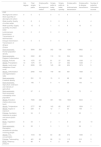
Natural capital, ecosystem services and disservices (ESD) considered here, and their top 18 drivers based on their number of outgoing links representing the number of direct connections with other variables in the network (out-degree) and total number of direct and indirect simple paths between the driver and the five groups of ESD. Note that some of the ESD do not have any outgoing links with other variables. The 18 drivers are ranked and ordered by their out-degree. Metrics for each ESD and drivers, and number of potential information sources are provided. Note that sources may provide information on multiple drivers and ESD. Paths to aboveground carbon, leishmaniasis, dengue, water quality, and water quantity: total number of simple paths between that ESD or driver and the respective ESD. Detailed information sources are provided in the Appendix A.
| Out-degree | Total simple paths | Simple paths to aboveground carbon | Simple paths to water quality | Simple paths to water quantity | Simple paths to leishmaniasis transmission | Simple paths to dengue transmission | Number of potential information sources | |
|---|---|---|---|---|---|---|---|---|
| ESD | ||||||||
| Aboveground carbon: Stock (quantity) of aboveground carbon | 0 | 0 | 0 | 0 | 0 | 0 | 0 | 8 |
| Water quality: Quality of surface water | 3 | 8 | 0 | 0 | 0 | 2 | 6 | 4 |
| Water quantity: Supply (quantity) of surface water | 4 | 15 | 0 | 1 | 0 | 4 | 10 | 6 |
| Leishmaniasis transmission: Transmission of leishmaniasis | 0 | 0 | 0 | 0 | 0 | 0 | 0 | 2 |
| Dengue transmission: Transmission of dengue | 0 | 0 | 0 | 0 | 0 | 0 | 0 | 4 |
| Drivers | ||||||||
| Socio-economic. Human population density | 19 | 5844 | 205 | 302 | 136 | 1340 | 3862 | 2 |
| Socio-economic. Degree of urbanisation | 14 | 2302 | 80 | 119 | 53 | 524 | 1526 | 3 |
| Policies. Policies | 14 | 1575 | 57 | 81 | 37 | 362 | 1038 | 3 |
| Abiotic. Precipitation | 10 | 1575 | 57 | 81 | 37 | 362 | 1038 | 7 |
| Abiotic. Land cover: categories of land cover | 8 | 2839 | 100 | 145 | 66 | 654 | 1874 | 5 |
| Abiotic. Deforestation and fragmentation rates | 7 | 2940 | 104 | 149 | 68 | 681 | 1938 | 9 |
| Socio-economic. Livestock density | 7 | 291 | 12 | 15 | 8 | 68 | 188 | 3 |
| Socio-economic. Agriculture: extension and intensity of agriculture | 7 | 156 | 7 | 9 | 4 | 36 | 100 | 4 |
| Socio-economic. Socio-economic vulnerability of the population | 7 | 97 | 0 | 5 | 1 | 19 | 72 | 4 |
| Abiotic. Elevation (metres above sea level) | 6 | 7006 | 248 | 361 | 165 | 1608 | 4624 | 1 |
| Abiotic. Temperature | 6 | 2777 | 98 | 143 | 65 | 637 | 1834 | 7 |
| Abiotic. Aspect or exposure | 6 | 229 | 8 | 12 | 7 | 54 | 148 | 1 |
| Policies. Sanitation: measures to protect and ensure public health. | 6 | 34 | 0 | 2 | 0 | 7 | 25 | 1 |
| Biotic. Vegetation cover | 6 | 34 | 1 | 2 | 1 | 8 | 22 | 10 |
| Socio-economic: Recreation: recreational activities involving people | 6 | 52 | 1 | 3 | 1 | 11 | 36 | 1 |
| Abiotic: CO2 concentration | 3 | 1618 | 59 | 83 | 38 | 372 | 1066 | 3 |
| Policies: Telecoupling | 3 | 481 | 20 | 26 | 13 | 112 | 310 | 3 |
| Biotic: Herbivory pressure | 3 | 86 | 4 | 4 | 2 | 20 | 56 | 1 |
 and disservices (dengue and leishmaniasis transmission) (green squares) in the Lules River watershed. Arrows show causal links between drivers (vertices). Vertices are not scaled, except for ESD, which are larger for visualisation purposes. Drivers are classified according to their primary type or category (abiotic, biotic, policies, and socio-economic). Compare with the figure in Box 2, which depicts a network scaled according to the number of simple paths. Scaled maps for each of the five ESD are available in the Appendix A.")
Conceptual system map of the drivers of five natural capital and ecosystem services (aboveground carbon, water quality, and water quantity) and disservices (dengue and leishmaniasis transmission) (green squares) in the Lules River watershed. Arrows show causal links between drivers (vertices). Vertices are not scaled, except for ESD, which are larger for visualisation purposes. Drivers are classified according to their primary type or category (abiotic, biotic, policies, and socio-economic). Compare with the figure in Box 2, which depicts a network scaled according to the number of simple paths. Scaled maps for each of the five ESD are available in the Appendix A.
Simple paths and out-degree scores were highly correlated (ρ = 0.71; Fig. 3), whereas the relationships between simple paths and out-degree and betweenness were weaker and showed important outliers (ρ = 0.11 and ρ = 0.40, respectively; Fig. 3). These outliers were drivers with either high simple paths or out-degree values and low betweenness, or low simple paths or out-degree and high betweenness (Fig. 3). Among these outliers, noteworthy cases included human population (betweenness: 0; out-degree: 19, simple paths: 5844), deforestation and fragmentation (betweennes: 0; out-degree: 7; simple paths: 2940), elevation (betweenness: 0; out-degree: 6; simple paths: 7006), vegetation cover (betweenness: 69.37; out-degree: 6; simple paths: 34), and temperature (betweenness: 69.23; out-degree: 6; simple paths: 2777). Drivers with zero or low betweenness values were not influenced by other drivers (no incoming links), but only affected other drivers in the network.
![Pairwise relationships between the out-degree, number of simple paths (log[x+1] transformed), and betweenness scores of our 43 drivers and the five natural capital, ecosystem services and disservices (ESD; green points) groups. A) Out-degree and betweenness; B) Log-transformed number of simple paths and betweenness; C) Log-transformed number of simple paths and out-degree. Drivers are classified according to the primary type (abiotic, biotic, policies, and socio-economic) and major outliers are labelled (see text for additional details).](https://static.elsevier.es/multimedia/25300644/0000002300000002/v1_202506091114/S2530064425000197/v1_202506091114/en/main.assets/gr3.jpeg?xkr=ue/ImdikoIMrsJoerZ+w988y0mNZd/sWcEakL5FQCEtADAdUQkaAPjNO7GBaXKAbFi3a+S+po5uPhXKPhEaQ214IgYw05qtkz9w858pipXeSfWrg9XrUHBxqYmiFGEInO59D+O/08DheNuTt8o/0EeSRyBRjcTGk7McSOygfOvRLr+K7Q/1oNrR7DCYYHDGztZIC4/v3/N36MNArtEQzWDciDJymshD0McaXWrsItTGmOkzsixCC8xnwANdfRwr3D1+ELGRv16rbt7JhQfm/ywO+8144I06jDspe+jXyVLn3j4CXnna+Lood7CZ4+YprYASQrJfojGwVUzbRxxJ3yg== "Pairwise relationships between the out-degree, number of simple paths (log[x+1] transformed), and betweenness scores of our 43 drivers and the five natural capital, ecosystem services and disservices (ESD; green points) groups. A) Out-degree and betweenness; B) Log-transformed number of simple paths and betweenness; C) Log-transformed number of simple paths and out-degree. Drivers are classified according to the primary type (abiotic, biotic, policies, and socio-economic) and major outliers are labelled (see text for additional details).")
Pairwise relationships between the out-degree, number of simple paths (log[x+1] transformed), and betweenness scores of our 43 drivers and the five natural capital, ecosystem services and disservices (ESD; green points) groups. A) Out-degree and betweenness; B) Log-transformed number of simple paths and betweenness; C) Log-transformed number of simple paths and out-degree. Drivers are classified according to the primary type (abiotic, biotic, policies, and socio-economic) and major outliers are labelled (see text for additional details).
The ranking of drivers was highly consistent between the two metrics used to rank them. Of the top 15 drivers identified according to the total number of simple paths to our five ESD, 12 were also in the top 15 of drivers identified by their out-degree ranking (80%). The remaining three drivers were CO2 concentration (abiotic), herbivory (biotic), and telecoupling (policies). Telecoupling refers to interactions over long distances, including the effects of policies implemented overseas that might influence local dynamics. Therefore, we identified a total of 18 drivers to direct our data gathering efforts (Table 1). Of these top 18 variables, seven were abiotic (38.9%), six were socio-economic (33.3%), three were related to policies (16.7%), and two were biotic (11.1%). Drivers related to human population, living conditions, and the associated pressures on the watershed topped the list (Table 1). These were complemented by large-scale climatic and geographical and geological drivers including elevation and precipitation (Table 1). We were able to find potential data sources for all 18 variables, and some information sources provided information on more than one EDS (Table 1; full list of information sources in the Appendix A).
DiscussionWe have demonstrated the feasibility of developing conceptual system maps encompassing the interactions and drivers of diverse ESD in the span of a few months. Our conceptual system map serves two main purposes: 1) to provide a snapshot of our current understanding of the system and a platform to articulate further research and integrate knowledge from various sources; and 2) as an analytical tool to rank the importance of drivers in shaping the dynamics of the system. Effective management of ESD requires an accurate understanding of their drivers and the interactions between them (Bateman and Mace, 2020; Bennett et al., 2009; Neyret et al., 2023; Saunders, 2020). However, achieving such integrated views of ESD is hindered by the practicalities of obtaining adequate data and the intricacies of the socio-ecological processes underlying ESD dynamics (Chaplin-Kramer et al., 2024; Cusens et al., 2023; Mandle et al., 2021; Ruiz-Agudelo et al., 2020; Villarreal-Rosas et al., 2020). Therefore, our approach to encoding expert knowledge is an important step to guide research and data collection efforts aimed at delivering integrated ESD assessments.
Our results underscore the importance of looking beyond bio-physical conditions and exemplify the critical role of socio-economic drivers and policies in shaping ESD (Chaplin-Kramer et al., 2024; Ruiz-Agudelo et al., 2020). Integrated assessments of multiple ESD, their trade-offs, synergies, and the socio-ecological processes behind their emergence require local knowledge and combining information from multiple disciplines, which can prove difficult (Ruiz-Agudelo et al., 2020; Smith et al., 2018; Villarreal-Rosas et al., 2020). More specifically, a common understanding of the dynamics of the system that incorporates multiple experts with different backgrounds is paramount (Barbrook-Johnson and Penn, 2022; Smith et al., 2018). Our facilitated activities, the opportunities for debating across disciplines, and the shared goal of developing a single conceptual system map incorporating all five ESD were essential for integrating multiple discipline-specific understandings into our final conceptual system map.
Our procedures revealed relationships that experts had not considered for their ESD of interest before getting involved in this work. In turn, this highlights the importance of considering multiple ESD and the possibility that our conceptual system map is missing some elements such as interactions and drivers. While a caveat, it is also a key feature of conceptual system maps, since the conceptual system map represents our current understanding of the system derived from established approaches to knowledge encoding. This highlights the role of conceptual system maps as dynamic models that should be revised as new information on their component ESD and drivers arises.
Two important challenges that arose while developing our conceptual system map were the resolution of the variables to include (e.g., land cover as a single variable vs disaggregated land cover categories) and resolving potential redundancies (Huntington-Klein, 2021). We opted for balancing detail, representativeness, and easiness of interpretation by first creating detailed lists and then assessing redundancies to reduce the number of drivers to the essential ones, unless disaggregated variables were considered to be more accurate. For example, vector abundance is represented by a single variable affecting both dengue and leishmaniasis even though the vectors are different. This was done to facilitate the interpretation of interactions and causal drivers in the system. Likewise, the variable ‘policies’ contain a variety of instruments and regulations (e.g., Fanelli, 2018; Fernandez and Alvarez, 2023; Mandle et al., 2019; Nuñez Godoy and Pienaar, 2023), but was kept as a single variable to aid in interpretation. On the other hand, the degree of urbanisation was kept separated from land cover, even though it can be argued that urbanisation is contained within land cover. This is because the degree of urbanisation was considered to be a key driver, and emerged as such in our analyses. In any case, trade-offs between detail, interpretability, and representativeness should be navigated with caution.
We have shown how to prioritise drivers for data gathering efforts in the absence of quantitative information. We used network analysis metrics to define key vertices in our conceptual system map, which we used to rank drivers according to their hypothesised importance in shaping ESD dynamics. While there was a good agreement in the importance of drivers according to our three metrics, there were mismatches between simple paths and out-degree and betweenness scores for some drivers. These discrepancies were generally due to low betweenness but high connectivity scores caused by a low number of incoming links. This implies that these drivers affect many other drivers directly but play a negligible or no role in mediating indirect relationships in our conceptual system map. Therefore, exploring different aspects of the conceptual system map is critical to uncover both direct and indirect drivers. Nevertheless, since data availability is usually a major constraint for developing quantitative ESD models (Andrew et al., 2015; Ruiz-Agudelo et al., 2020; Willcock et al., 2023), our prioritisation is a major advantage for supporting further in-depth research. For example, we identified human population density as our top variable, yet high-quality and high-resolution information is lacking since population censuses are only conducted once per decade (see https://www.indec.gob.ar/indec/web/Nivel3-Tema-2-41).
In addition to helping prioritise drivers, our conceptual system map revealed the importance of managing multiple ESD simultaneously and generated new hypotheses. In particular, managers should be aware of trade-offs and synergies between ESD when managing systems. More specifically, our approach suggests that managers should examine the paths involving the target driver or ESD to assess the likelihood of direct and indirect effects upon other ESD. These assessments can help avoid unintended consequences (e.g., increasing ecosystem disservices) or predict potential gains of co-benefits by managing shared drivers. For example, the connections between water quantity, water quality, dengue transmission, and leishmaniasis transmission speak of the need for concerted interventions for these ESD. Potential research questions emerged organically from our conceptual system map. While these research questions will be context-dependent, two examples illustrate the role of conceptual system maps in generating hypotheses. First, evaluating the impacts of policies – a key driver in our conceptual system map - upon ESD is an area ripe for in-depth research to promote evidence-informed ESD management (e.g., Nuñez Godoy and Pienaar, 2023). Second, vegetation dynamics, captured by ‘vegetation cover’, ‘deforestation’, ‘vegetation_composition’, ‘invasions’, and ‘successional stage’ emerged as key drivers in our system (Table 1). Future research should seek to clarify how vegetation dynamics determines multiple ESD across spatial and temporal scales in the watershed, extending our ongoing work on the effects of vegetation dynamics on single ESD in the watershed (Jimenez and Aráoz, 2024).
We have already mentioned the limitations and caveats imposed by data availability and potentially missing links on our approach, but three additional aspects are worth elaborating on. Our conceptual system map is qualitative and agnostic about the effects of causal drivers (e.g., whether it is a positive or negative relationship). Incorporating multiple quantitative models for causal links will complement our ranking of variables by estimating quantitative scores (e.g., effect sizes, partial correlations, or sensitivity scores) of the importance of drivers. Structural Equation Models and mechanistic models adjusted using data assimilation methods are promising candidates for fitting our conceptual system map to the available data (Luo and Smith, 2022; Zango-Palau et al., 2024). Moreover, structural equation approaches include tests to evaluate potential missing links between variables, helping to fine-tune our conceptual system map. Second, links in our conceptual system map are unidirectional and, as such, do not include feedback loops. Feedbacks are essential to system dynamics (Chaplin-Kramer et al., 2024; Ruiz-Agudelo et al., 2020), and including a temporal dimension to the conceptual system map will address this shortcoming although at the cost of increased complexity. Lastly, it would be highly desirable to include equity facets and factors mediating access to ESD more explicitly (Chaplin-Kramer et al., 2024; Laterra et al., 2019; Mandle et al., 2021). In this sense, our conceptual system map could be expanded to fit within existing ESD-equity frameworks developed for Latin America (Laterra et al., 2019).
ConclusionsIntegrated assessments of multiple ESD are necessary to move forward natural capital, ecosystem services, and ecosystem disservices research and management. However, the complexity of socio-ecological systems, the need for integrating local interdisciplinary knowledge, the availability of suitable data, and the paucity of adequate modelling tools hamper progress. We have shown that it is feasible to combine expert knowledge and network analytical tools to move integrated ESD assessments forward by: 1) building a consensus conceptual map that can be updated as necessary; 2) uncover direct and indirect relationships between ESD and drivers to facilitate the effective management of multiple ESD; 3) prioritise drivers for data gathering efforts; and 4) generate new hypotheses to guide future research. This can be achieved in a timely manner through facilitated activities and constitutes a valuable tool to formalise our current understanding of the system. Conceptual maps thus provide a framework to describe and explore the dynamics of multiple ESD, communicate with end-users and stakeholders transparently, and guide efforts to deepen our ability to predict and manage ESD dynamics. They should be viewed as living models to be revised as new information emerges to refine our understanding of the system iteratively. In conclusion, conceptual system maps are powerful tools to foster integrated ESD research and management and should be considered alongside quantitative models of ESD.
CRediT authorship contribution statementPablo García-Díaz (Conceptualization, Writing – Original draft, Writing – review and editing, Data curation, Formal analysis, Investigation, Methodology, Visualization).
Yohana G. Jimenez (Writing – original draft, Writing – review and editing, Investigation, Funding Acquisition)
Carlos Molineri (Writing – original draft, Writing – review and editing, Investigation, Funding acquisition)
María G. Quintana (Writing – original draft, Writing – review and editing, Investigation, Funding Acquisition)
Ezequiel Aráoz (Writing – original draft, Writing – review and editing, Investigation, Methodology, Funding Acquisition, Project Administration)
Agustina Malizia (Writing – original draft, Writing – review and editing, Investigation, Methodology, Funding Acquisition, Project Administration),
Oriana Osinaga (Writing – original draft, Writing – review and editing, Investigation, Funding Acquisition)
Priscila A. Powell (Writing – original draft, Writing – review and editing, Investigation)
Cecilia Blundo (Writing – review and editing, Investigation, Funding Acquisition)
Sergio Ceballos (Writing – review and editing, Investigation, Funding Acquisition)
Ana D. Fuenzalida (Writing – review and editing, Investigation, Funding Acquisition)
Lourdes Gultemirian (Writing – review and editing, Investigation, Funding Acquisition)
Guillermo Hankel (Writing – review and editing, Investigation, Funding Acquisition)
Giselle A. Rodríguez (Writing – review and editing, Investigation, Funding Acquisition)
Sebastián Albanesi (Writing – review and editing, Investigation)
Ignacio Gasparri (Writing – review and editing, Investigation)
Alfredo Grau (Writing – review and editing, Investigation)
Miguel Lurgi (Writing – original draft, Writing – review and editing, Investigation, Methodology),
Julieta Carilla (Conceptualization, Writing – original draft, Writing, review and editing, Investigation, Methodology, Funding Acquisition, Project Administration).
FundingThis work was funded by PICT 2020 SERIEA 03355 (FONCyT; Argentina).
Declarations of interestsThe authors declare no competing interests.
Data statementThe data, R script to conduct the analyses, and the outputs of the analyses are available from the Appendix. All these materials are publicly available at https://ri.conicet.gov.ar/handle/11336/260022 (Repositorio Institucional CONICET Digital). The R script to conduct the analyses is also available from GitHub: https://gist.github.com/pablogarciadiaz/aa2c9b0eea7933c739f1eb4b22d04353.
Thanks to H. Ricardo Grau (IER, UNT-CONICET) for participating in the facilitated activities.
The following are Supplementary data to this article:


