


Mining and associated infrastructure have been driving land use changes, affecting important biodiversity values and ecosystems services. To balance these impacts, some mining companies implement biodiversity offsets and conservation actions. By simulating a counterfactual land use scenario, this study quantifies the cumulative impacts on biodiversity and ecosystem services resulting from land use and land cover change in a biodiverse region in the Atlantic Forest after implementation of a new mine and its offsets. Our results show that conservation actions at the project scale should be planned considering the regional context, which may influence impacts on areas with high conservation priority as well as the ecosystem services budget. The comparison among scenarios reveals that raw materials and carbon storage are the least affected budgets, while fresh water, pollination, and local climate and air quality regulation are most impacted. Areas with high conservation priority could be benefited with increased forest cover in future, whilst the demand for some ecosystem services can be affected. Counterfactual baselines could support conservation targets by prioritizing protection and restoration measures – especially offset planning – for halting pressures on biodiversity and balancing ecosystem services supply and demand.
Land use and land cover (LULC) changes in biodiverse landscapes lead to extensive impacts on intact ecosystems (Raiter et al., 2014). These changes are mainly driven by developing actions that cumulatively clear habitats, affecting landscape composition and structure (Mokany et al., 2019; Raiter et al., 2014; Whitehead et al., 2017) as well as the ecosystem services it provides (Nijhum et al., 2021; Wang et al., 2020). In mining regions, where impacts from mining and associated infrastructure interact with impacts from other activities, cumulative effects on biodiversity and ecosystem services (B&ES) may be significant (Boldy et al., 2021; Sonter et al., 2018).
Impact assessment and respective mitigation measures are the primary tool to support project decisions for avoiding and compensating biodiversity impacts. Biodiversity offsets are actions to compensate unavoidable losses after the consideration of mitigation hierarchy (Kiesecker et al., 2013) aiming at counterbalancing biodiversity and habitat loss by implementing conservation actions. However, the traditional project-by-project compensation approach fails into considering landscape-wide pressure over ecosystems (Kiesecker et al., 2013; Whitehead et al., 2017). Biodiversity offsets at project level are usually not designed to address the indirect and cumulative impacts on B&ES (Brownlie et al., 2013). Despite lack of evidence (zu Ermgassen et al., 2019) and capacity to address cumulative impacts at a regional scale (Whitehead et al., 2017), biodiversity offsets are increasingly used internationally.
To support conservation decisions to thoroughly address impacts of project development, it is necessary to comprehensively analyze the biodiversity losses and gains resulted from projects and their offsets (Nicholson et al., 2019) using robust baselines for comparison (Maron et al., 2015). In dynamic landscapes, with different pressures for development on already fragmented habitats, the investigations about the interaction between impacts driven by LULC changes is fundamental to inform conservation strategies. Scenarios and modelling approaches (IPBES, 2016; Nicholson et al., 2019; Rosa et al., 2020) play a prominent role by analyzing trade-offs and setting priorities for future conservation actions (Metzger et al., 2017; Teixeira et al., 2009).
In this context, this study quantifies the cumulative impacts on B&ES resulting from LULC changes in a biodiverse region in the Atlantic Forest with a mining project and its offsets. By analyzing historic changes and modelling scenarios for 2030, this research aims at deriving perspectives for conservation planning in mining regions. We innovate by investigating the impacts of mining and the outcomes of offsets on B&ES, including trade-offs, in support for understanding the implications of project-level initiatives and regional conservation actions. We firstly present the methodology used for developing the spatially explicit cellular automata model to simulate the scenario without the project development and analysis of B&ES. Finally, we present the impact evaluation and the implications for future conservation actions.
Materials and methodsStudy regionThe study region is part of the Serra do Espinhaço Biosphere Reserve (Fig. 1), a mountainous region in the Atlantic forest of Eastern Brazil, including the highly biodiverse rupestrian grasslands (Fernandes et al., 2020). In this biome, historically under threat due to the expansion of human occupation, recent restoration efforts have changed the dynamic of forest cover (Rezende et al., 2018; Ribeiro et al., 2009; Rosa et al., 2021). The study region (323,642 ha) encompasses two main watersheds where the mine and biodiversity offsets are located. Project implementation (2008) was divided into three steps, including the construction of infrastructure required for ore processing and transportation (Souza et al., 2021). Operation started in 2014. Implementation of biodiversity offsets was also phased, beginning in 2014. In addition to biodiversity offsets, the region shelters 11 protected areas (Fig. 1), seven ensuring full protection (categories I–IV of IUCN), and four providing for sustainable use (categories V and VI, Table S1).
Modelling impacts
Counterfactual scenarios serve to simulate conditions without a project development and investigate the impacts of conservation strategies and their effectiveness (Nicholson et al., 2019). To quantify the cumulative impacts on B&ES resulting from LULC changes in a biodiverse region in the Atlantic Forest with a mining project and its offsets, we compared the LULC changes observed after project construction with a counterfactual condition without the project (Fig. 2). We developed, calibrated and validated a cellular automata model to simulate LULC changes in the counterfactual situation, using Dinamica EGO software (Soares-Filho et al., 2002) with historic LULC from MapBiomas 5 (Souza et al., 2020) with 30 m of spatial resolution (Table S2–S6).

Our assumptions for calibrating the model are based on spatial information about the historic trends in the forest cover in the study area. Therefore, the conditions without the mining project are related to spatial changes that would occur considering an historic baseline of forest cover. We used the historic forest cover in the region to identify periods with similar rates of change for modelling (Fig. 1), resulting in the period 1986–1993 for calibrating and 1993–1999 for validating the model (Table S7). The spatial probabilities of change were analyzed according to the weights of evidence method using different explanatory variables (Table S8), such as distance to roads, rivers, and urban areas and existing pastureland and silviculture. These variables aim at explaining the spatial distribution of changes in the landscape and are used as reference in the model to allocate probabilities. Although these variables are broadly used for simulating LULC changes, there are limitations to determine spatial changes, as they do not comprise other exogenous, time-variant factors, such as policy changes.
The mechanism to verify the model accuracy is based on the comparison with the null model. The null model considers all weights of evidence as null, therefore, it allocates randomly the changes in the landscape. We compare, at multiple spatial resolutions of windows size, the performance of both models, the calibrated and the null, to predict all transitions. The simulated model reached 50% of similarity with a 25 ha window while the null model reached the same similarity with 60 ha, evidencing that the calibrated model is predicting better than the random allocation model (Fig. S2).
Vegetation extent and the importance of their habitats are proxies broadly used to analyze biodiversity outcomes (Biodiversity Indicators Partnership, 2011; Sonter et al., 2017). To investigate impacts on areas of high priority for conservation, we analyzed the quantity of LULC changes with Dinamica EGO and clipped the information about ichthyofauna conservation areas defined by Vieira (2006). These are priority areas for conserving threatened biota in the catchment, considering the existence of three endangered fish species, including one endemic species. These areas served to guide local conservation actions to mitigate impacts on aquatic ecosystems in the regional context of Biosphere Reserve.
For evaluating how LULC changes affected ecosystem services, we used a matrix model to analyze the spatial distribution of ecosystems services supply and demand (Campagne et al., 2020; Metzger et al., 2021). We firstly evaluated the importance of each LULC class in relation to their capacity of supplying and their potential demand of ecosystem services (Burkhard et al., 2012) by using the ecosystem services categories based on TEEB (Sukhdev et al., 2010) (Table S9–S11). We surveyed four experts on the topic of ecosystem services, familiar with the Atlantic Forest biome and mining regions in July 2021 to evaluate the importance of each LULC class on the supply and demand of ecosystem services. The median value of the survey responses is presented in Table S10 and Table S11 and the standard deviation in Table S12.
The analysis of the budget is given by the difference between the median value of supply and demand of each LULC class (1). The scale ranges from −5 (where demand exceeds supply) to 5 (where supply exceeds demand). This range was categorized into three classes (supply exceeds demand, demand exceeds supply, and neutral balance) and the analysis was mainly focused on provisioning and regulating ecosystem services. Future research can be done using other indicators to evaluate cultural services.

To investigate the impacts in terms of the total area responsible for the supply, demand and budget of each category of ecosystem service in the study region, we compare LULC under observed landscape and counterfactual projection (2).
where X: (i) for the biodiversity analysis, is the total area (ha) of forest cover and forest cover within priority areas for conservation; and (ii) for the ecosystem services analysis, is the total area (ha) responsible for the ecosystem services supply, demand, and budget.
To simulate future changes for 2030, projections were based on LULC observed in 2019 (period 2008–2019 corresponding to the mining development) and counterfactual rates (1986–1999). The potential impacts were calculated in terms of biodiversity loss and ecosystem services to reveal possible trade-offs involved in future decisions for the region.
LimitationsThere are potential biases of extrapolating pre-intervention trends into the future. The calibrated spatially explicit model focused on extrapolate historic LULC for simulating a counterfactual scenario. We used as reference the forest cover before 2000s for avoiding modelling the abrupt forest cover loss (period 2002–2007) (Fig. S4) and calibrate and validate the model with similar fores cover trends. Therefore, our model is not capturing changes just before the project construction starts (2008) and, consequently, the impacts of mining on forest may be overestimated (Fig. S4) in the counterfactual simulation. Other possible exogenous factors and policy change effects are not captured by our model and the comparison with observed and counterfactual scenarios consider only changes in LULC. The projected trends are considered constant in each year until 2030, an assumption that may be not realistic in case new interventions are implemented in the watershed after 2019.
ResultsImpacts of the project and its offsetsThe LULC changes observed in the study area between 2008 and 2019 entailed the loss of forest to pastureland and to silviculture, affecting differently portions in the watershed. Forest loss for pastureland expansion reached 5815 ha while silviculture was responsible for clearing 1898 ha of forests in the same period (Fig. S3). In contrast, the counterfactual changes would result in 3.5 times more forest clearing for pastureland expansion (20,235 ha) and 2.6 time less (733 ha) for silviculture expansion. A total of 14,932 ha of pastureland was converted to forests in the observed landscape, while, in the counterfactual, we estimate such conversion as 1.4 times larger (20,176 ha). Similar trends of change were identified for the entire Atlantic Forest biome (Rosa et al., 2021), raising concerns about the threats to species and habitats resulting from replacing old growth forests with new, young forest.
The distribution of changes across the landscape varied both in the observed and in the counterfactual landscapes according to historic trends and the spatially explicit explanatory variables used in the model (Fig. 2). The observed landscape showed increased pastureland cover in the easternmost part of the watershed and larger silviculture areas in relation to the counterfactual simulated landscape. The gain of forest cover between 2008 and 2019 was 7157 ha, with 2068 ha (28%) within areas of high priority for conservation (Fig. 3). In the observed landscape in 2009, the high priority areas experienced greater LULC change than in the counterfactual.

The observed and the simulated LULC changes for 2019 affect differently the potential supply of ecosystem services, revealing trade-offs among impacts on ecosystem services, i.e., the changes affect more some services than others. The difference between the ecosystem services budget (Eq. (2)) considering observed and counterfactual landscapes (Eq. (1)) is shown in Fig. 4. Larger bars indicate a greater difference in the ecosystem services budget between observed and counterfactual values. Their positive values reveal larger areas in the observed landscape compared to areas in the counterfactual landscape (positive impacts) and negative values where counterfactual is larger than the observed (negative impacts). The comparison between both scenarios reveals that ecosystem services related to raw materials and carbon storage are the least affected (smaller bars), while fresh water, pollination, and local climate and air quality regulation are most impacted (larger bars).

Considering provisioning services, the area providing a net supply of medicinal resources, raw materials and food is smaller in the observed than in the counterfactual landscape (green bars in Fig. 4), while areas with net demand (in salmon in Fig. 4) of wastewater treatment, erosion prevention, and maintenance of soil fertility and biological control are larger in the observed landscape in 2019. These results reveal the imbalance of impacts on supply and demand that LULC changes could cause, affecting source-sink patterns. This finding emphasizes the importance of setting conservation actions and land use planning focused on tackling both, ecosystem services supply and demand.
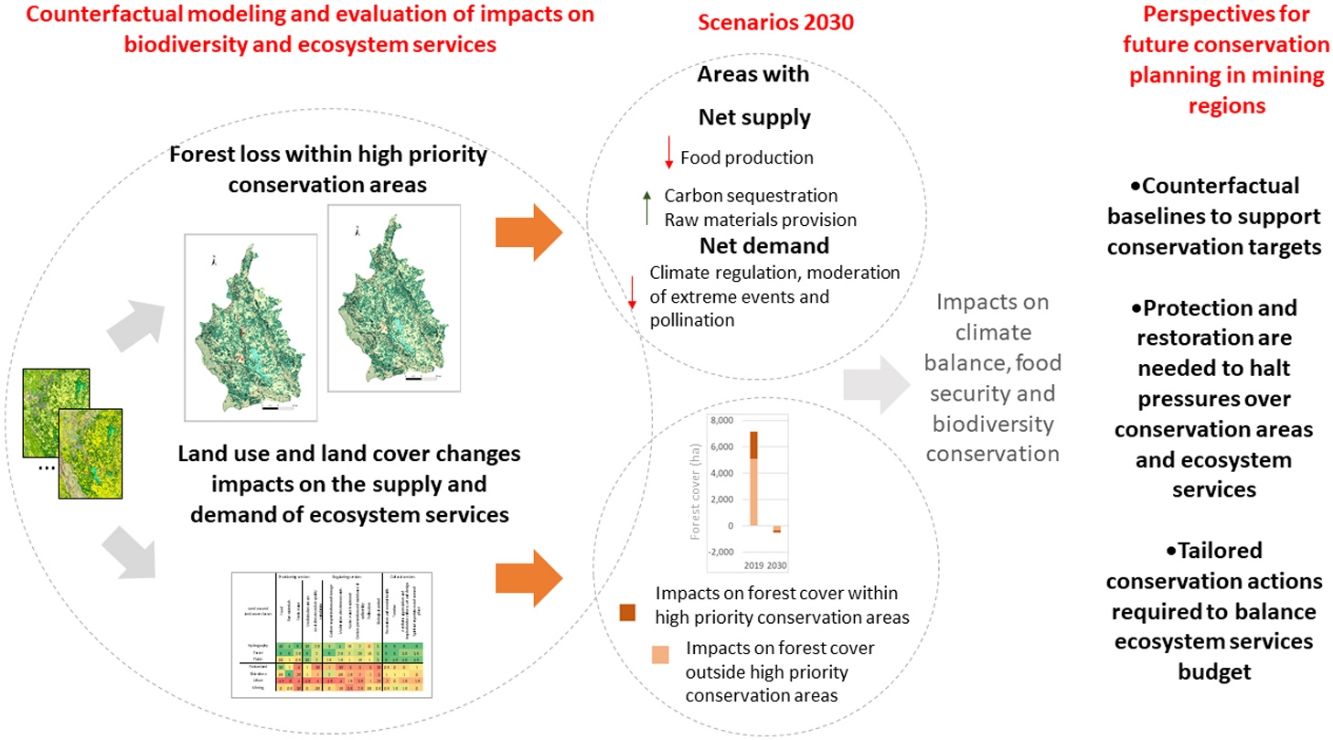
Exploratory scenario for 2030In general, considering the historic trends in the study region (Fig. S4) there is an increased forest cover considering LULC changes observed in 2008–2019 in contrast to a small decline in forest cover in the counterfactual scenario. These trends are projected to simulate the 2030 scenarios and the forest cover. A larger extent of forest cover within areas of high priority for conservation are projected in the 2030 scenario resulted from the observed changes 2008–2019 compared to the counterfactual scenario (Fig. 4).
These LULC changes would result in different impacts on ecosystem services, changing budgets in 2030 as compared to the observed in 2019. The smaller bar size in 2030 (Fig. 4) indicates a reduction of impacts (on both areas with net supply and net demand) on freshwater and medicinal resources provision, wastewater treatment, erosion prevention, and maintenance of soil fertility, and biological control. In contrast, larger impacts are projected to 2030 in the provision of food and raw materials as well as local climate and air quality regulation, moderation of extreme events, and pollination.
The projection to 2030 of LULC changes observed in 2019 reveal larger areas with net supply (green bars) of raw materials and carbon storage, showing great differences in the comparison with the counterfactual (Fig. 4). In contrast, the difference between counterfactual and projected landscape (the bars size) is higher considering the area of net supply for food production, with higher net supply areas in the counterfactual in 2030. Areas with net demand (salmon bars) are greater in the counterfactual for the provision of freshwater, regulating local climate and air quality regulation, moderation of extreme events, wastewater treatment, pollination and biological control. These effects on areas with net demand are resulted from the increased forest cover in the projected landscape for 2030 based on observed changes in 2019, revealing the need for tailored actions to strategically consider the demand to maintain the ecosystem services flow after conservation actions in the landscape.
Perspectives for conservation actions in mining regionsBy analyzing impacts resulted from LULC changes in terms of areas with high priority for conservation and ecosystem services budgets in a biodiverse mining region in Atlantic Forest we evidenced relevant trade-offs at the regional level. We found that areas with high priority for conservation could be adversely affected by LULC changes, with fresh water provision, pollination and local climate and air quality regulation as the ecosystems services whose budget is most affected. Considering trends of LULC changes for 2030, food production and raw materials provision would be also more impacted while minor impacts are projected in areas with high priority for conservation. Here we outline three main contributions of this study for broad conservation decision-making in mining regions.
Protection and restoration offsets to halt pressures over conservation areas and ecosystem servicesThe analysis revealed that LULC changes occurred differently across the watershed. The largest forest loss was found in the eastern sector, due to pastureland and silviculture expansion, while the least changes were observed in the central sector. Although the protection of offset areas could trigger pressures across the landscape, future biodiversity offsets of mine expansion could be planned to protect sectors currently under pressure (Sonter et al., 2020). Given the restriction of land availability for implementing protection offsets (Sonter et al., 2020), there is great need for impact avoidance in the next developments in the region, despite the limited scope for avoidance in mining projects (Sánchez and Franks, 2022), coupled with efforts to restore habitats to increase forest cover in the region. The trends to 2030 reveal the importance of maintaining the efforts of protection and increase restoration for achieving positive impacts not only on biodiversity but also on the supply of ecosystem services. Tailored actions are required to maintain the flow of services given the changes in the demand areas.
Counterfactual baselines needed as one possible way to set conservation targetsDetermining counterfactual baselines is especially important for accounting no net loss and net positive impacts (Sonter et al., 2017) resulted from project development (Bull et al., 2020, 2014; Grace et al., 2021; Maron et al., 2015; Nicholson et al., 2019). The counterfactual scenario could be influenced by the timeframe (Sonter et al., 2017), as well as by the biodiversity features or ecosystem services used as reference (Bull et al., 2020). Here we used a baseline of forest cover to find implications of offsets and conservation actions on B&ES. In our proposed model to simulate the counterfactual LULC changes, we extrapolated historic changes, which certainly influence the results of comparison for not considering other recent changes or exogenous factors. Alternatively, other counterfactual scenarios could be tested, focused on baselines to analyze priority ecosystem services and grounded on other spatial matched methods for avoiding the use of past changes in the landscape (Sonter et al., 2020) or use a combination of multiple counterfactuals perceived by different stakeholders (Bull et al., 2020). Other statistical methods can be used to evaluate the impact of policies and projects such as before-after-control-intervention studies using statistical matching or synthetic control methods (Schleicher et al., 2019).
Many mining regions are especially biodiverse (Murguía et al., 2016; Sonter et al., 2018) and shelter a variety of biodiversity values, such as endemic and threatened species (Fernandes et al., 2020). The trade-offs involved in conserving both B&ES show opportunities to investigate multiple counterfactuals, including trends in ecosystem services. Given that some mining companies are committing to net positive impacts on biodiversity, counterfactuals represent a valuable tool to evaluate trajectories and achievements.
Prioritization of conservation actions to balance ecosystem services budgetLandscape processes affect supply and demand of ecosystem services. Our results evidence that, despite the projected increase in the forest cover in the region and minor impacts on areas with high conservation priority in 2030, some ecosystem services budgets are greatly affected (Fig. 4). While carbon sequestration and raw materials would be positively impacted by the increased forest cover, the supply of food would be negatively impacted. In addition, there is a projection of smaller areas with net demand for local climate and air quality regulation, moderation of extreme events, pollination and biological control in the observed in comparison to the counterfactual, reveling the potential imbalance on areas responsible for demanding some services. Tracking demand areas is also important for improving the ecosystem services flow (Metzger et al., 2021; Verhagen et al., 2017). Setting conservation objectives and targets for conserving some ecosystems services, including their supply and demand, is a possible way for project level initiatives to increase the delivery of the benefits for society.
Declaration of interestsThe authors declare that they have no known competing financial interests or personal relationships that could have appeared to influence the work reported in this paper.
This study was financed in part by the Coordenação de Aperfeiçoamento de Pessoal de Nível Superior - Brasil (CAPES) — Finance Code 001. This research project coordinated by Luis E. Sánchez was funded by Anglo American Brazil. The authors are thankful to Anglo American Brazil for providing spatial information about the project and offsets, and to Bárbara Souza and Josianne Rosa for fruitful discussions during the development of the research.
The following is Supplementary data to this article:


