


Agricultural intensification is a major driver of biodiversity loss. However, the exact impacts of such loss of key ecosystem service (ES) provisions in agriculture require more scrutiny. We assessed the population loss impacts of a key ES-providing species in an agricultural landscape. We tested the hypothesis that intensive agriculture causes density reduction of frogs known as pest regulators and that negatively affects pest regulation. Different frog densities (high and low) observed in a previous study in low and high agricultural intensification areas were used as treatments in a semi-controlled field experiment. Functional response of the frog species was also studied. Neither high nor low frog density had any significant effect on respective pest populations. Limited feeding rate of the frog species might have contributed to reduced predation pressure on pests. Surprisingly, at low density, frogs significantly reduced the arthropod natural enemies, probably their preferred prey due to the latter’s agility. Unlike in low frog density treatment, increased intraspecific competition at high frog density made them seek out pests as alternative prey to the preferred arthropod pest enemies, whose populations were not affected by frog density. This study for the first time links the population loss of frogs, a potential bio-control agent to ES provision in a multi-trophic system.
Extensive use of agrochemicals and habitat loss due to expansion of the agricultural area for intensification of food production have been identified as major drivers of biodiversity loss in agricultural landscapes (Newbold et al., 2015, Dudley and Alexander, 2017). Such biodiversity losses have led to the loss of key ecosystem services (ES) like pollination or natural pest regulation in agriculture (Brook et al., 2008). Sustaining the ES can be crucial in bridging the yield gap between the attainable and the actual yield (Bommarco et al., 2013). Biological control of crop pests delivered by pests’ natural predators is a key ES (Gurr et al., 2003). However, despite years of research, our understanding of the underlying ecological processes that govern biological control, particularly the complex food web interactions that regulate the process, is still incomplete (Bengtsson, 2015). For example, notwithstanding the benefits natural enemies of pests provide, their impact on other non-target arthropod populations has been highlighted (Howarth, 1991). On the other hand, the behavior and efficacy of natural predators in a multi-trophic and multi-species system are still mostly unclear and warrant scrutiny.
Amphibians have long been recognized as potential natural predators of crop pests (Hamer et al., 2004; Loman and Lardner, 2006) being both generalist and opportunist predators (Mahan and Johnson, 2007). Khatiwada et al. (2016) reported a high proportion of rice pests in frogs’ diet and recommended the introduction of frogs for biological pest control in rice fields. A sizeable abundance of amphibians is regarded as being efficient in bringing down the rice pest population (Teng et al., 2016; Fang et al., 2019). However, intensive agriculture has been found to negatively impact frog populations (Davies et al., 2008). Ghosh and Basu (2020) reported a reduced density of amphibians in areas of high agricultural intensification compared to less intensive traditional agricultural areas (for details on the basis for classifying agricultural intensification see, Ghosh and Basu, 2020). A decline in frog population in an intensive agricultural landscape can therefore be expected to negatively impact ES delivery. Apart from this, there could be other factors working in synergy with diversity loss that can disrupt the overall pest regulation by a given frog species. For example, in a multi-species and multi-trophic system within a guild, predation of the arthropod pest predators by super-predator frogs, referred to as “intraguild predation”, may also influence pest regulation (Chailleux et al., 2014).
In this study, we tested the hypothesis that population loss of ES-providing species led to ES reduction using an amphibian species as the model and pest regulation as the targeted ES. We build on the previously reported data on the density of amphibians by Ghosh and Basu (2020) as this reflects the real impact of agricultural intensification on amphibian density. We replicated the densities of a commonly found frog species in the rice fields (Fejervarya sp.) according to the density reported from areas of low and high agricultural intensification (Ghosh and Basu, 2020) in a semi-controlled field experiment to assess the impacts of two different frog densities on the rice pest population. Further, we assessed how trophic interactions between frogs (super-predator) and other natural insect pest enemies might impact the ES. Not only does this study bring out the impact of population losses of key ES providers on ES provision, it also highlights the importance of multi-trophic interaction on ES delivery which hitherto is unexplored especially in relation to amphibians as super-predators.
Materials and methodsExperiment siteThe experiment was performed at the Agricultural Experimental Farm, University of Calcutta, Baruipur Campus in West Bengal, India in 2018 (22.3787°N, 88.4361°E). The farm is spread across an area of 85 ha with rice paddy being the major crop grown during the monsoon. Total experimental area was 7500 m2. The follow-up mesocosm experiment to study the nature of feeding response in the model amphibian was performed on the University campus in the year 2019.
Experimental designThree blocks of 50 × 50 m area were selected for the study. Each of the blocks was divided into six experimental plots of 10 × 10 m where we installed our experimental units using a drift fence of length 10 m and height of 91.44 cm. We installed a total of 18 experimental plots across an area of 7500 m2 leaving a buffer of 5 m between each experimental plot. Based on the field realistic density of frogs in a previous study (Ghosh and Basu, 2020) we replicated the frog densities in this experiment. We randomly assorted the plots to three different frog treatments — one control without frogs, one with a treatment density of 10 frogs/100 m2 as observed in low agricultural intensification (we refer to this density as high frog density), and a third with a treatment of 5 frogs/100 m2 representing the density observed in high agricultural intensification zones (we refer to this density as low frog density).
Experimental modelWe used adult (5–6 cm) paddy field frog species Fejervarya sp. as our model organism as they are the most abundant in the paddy fields of India and South Asia (Sumida et al., 2007). Fejervarya sp. is categorized as least concerned by IUCN and is also a generalist feeding mainly on insects (Chuang and Borzée, 2019) hence making it a potential bioresource to test their potential as pest regulators. This species belongs to a species complex, hence we have restrained to using only the genus name. We collected amphibians by active search in August 2018 from within the campus area for release in the experimental plots.
Experimental plot preparationWe selected paddy fields for their economic demand and for their potential in conserving amphibian diversity. For this study, we used a local rice cultivar “Patnai”, popularly grown in the study area. We prepared the seedbed with a density of 1916 seeds/m2 for a total seedbed area of 210 m2. Paddy saplings were transplanted around 30 days after preparing the seedbed at an average density of 762 plants/100 m2.
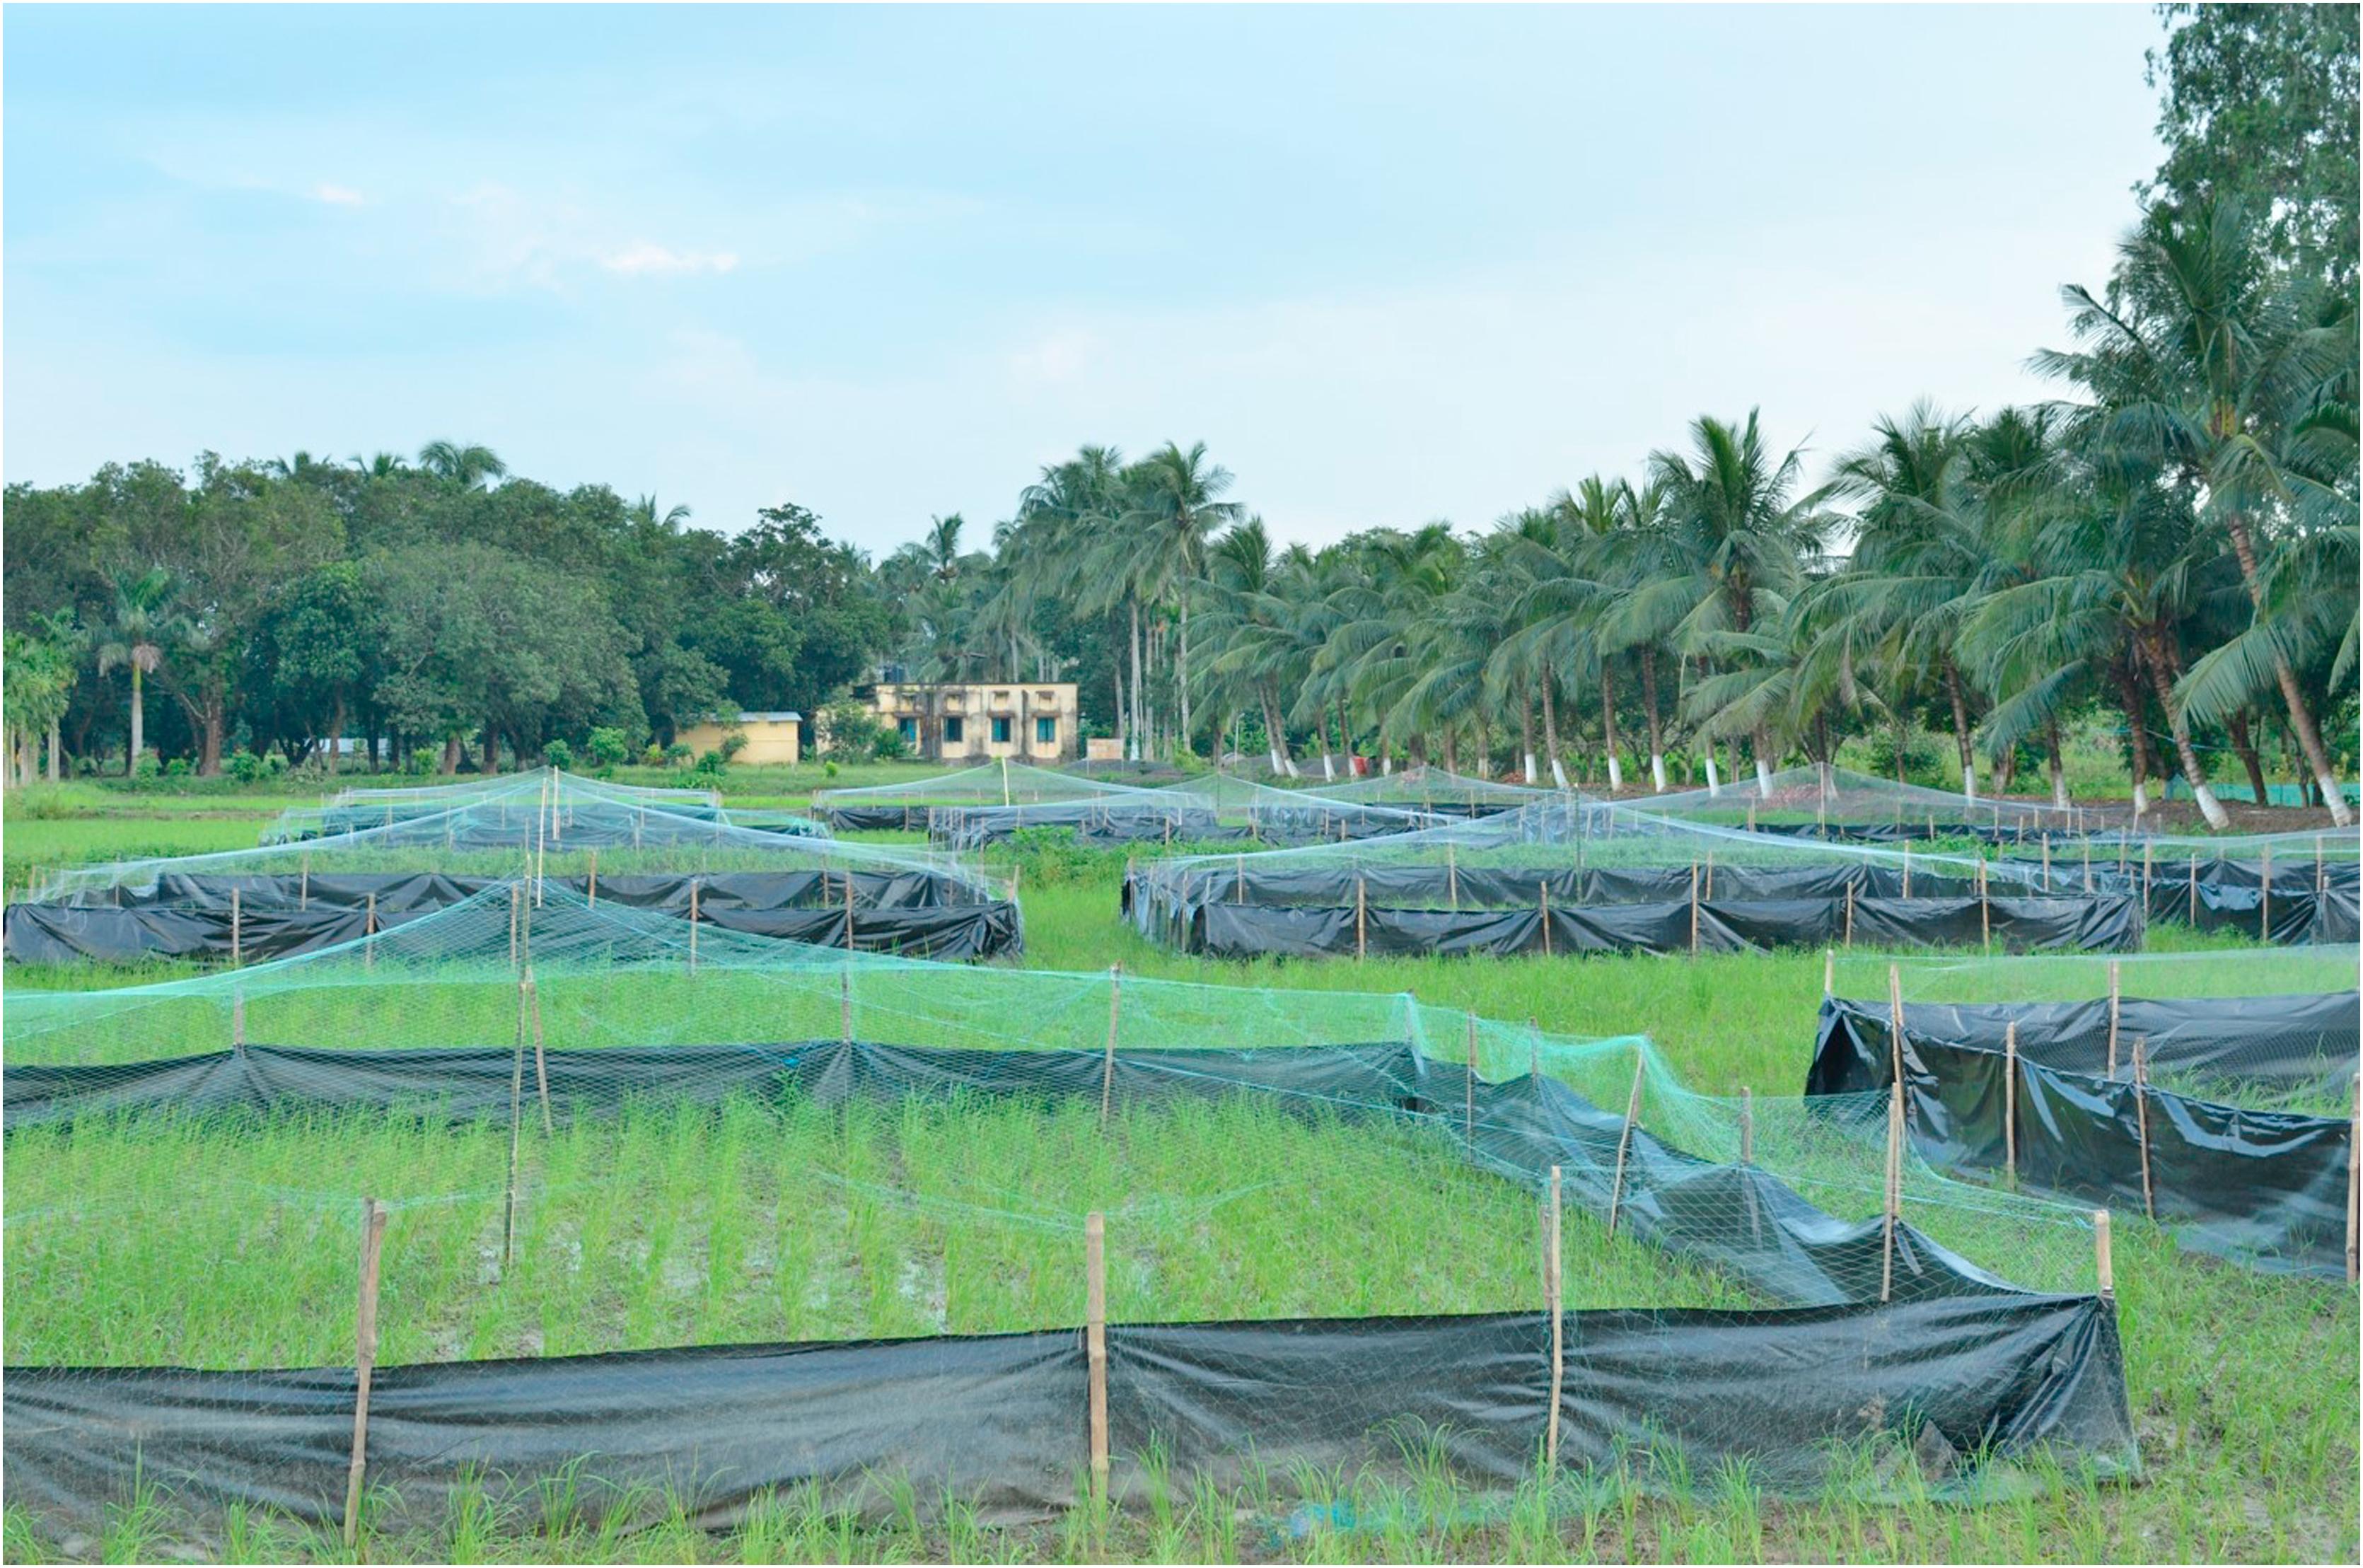
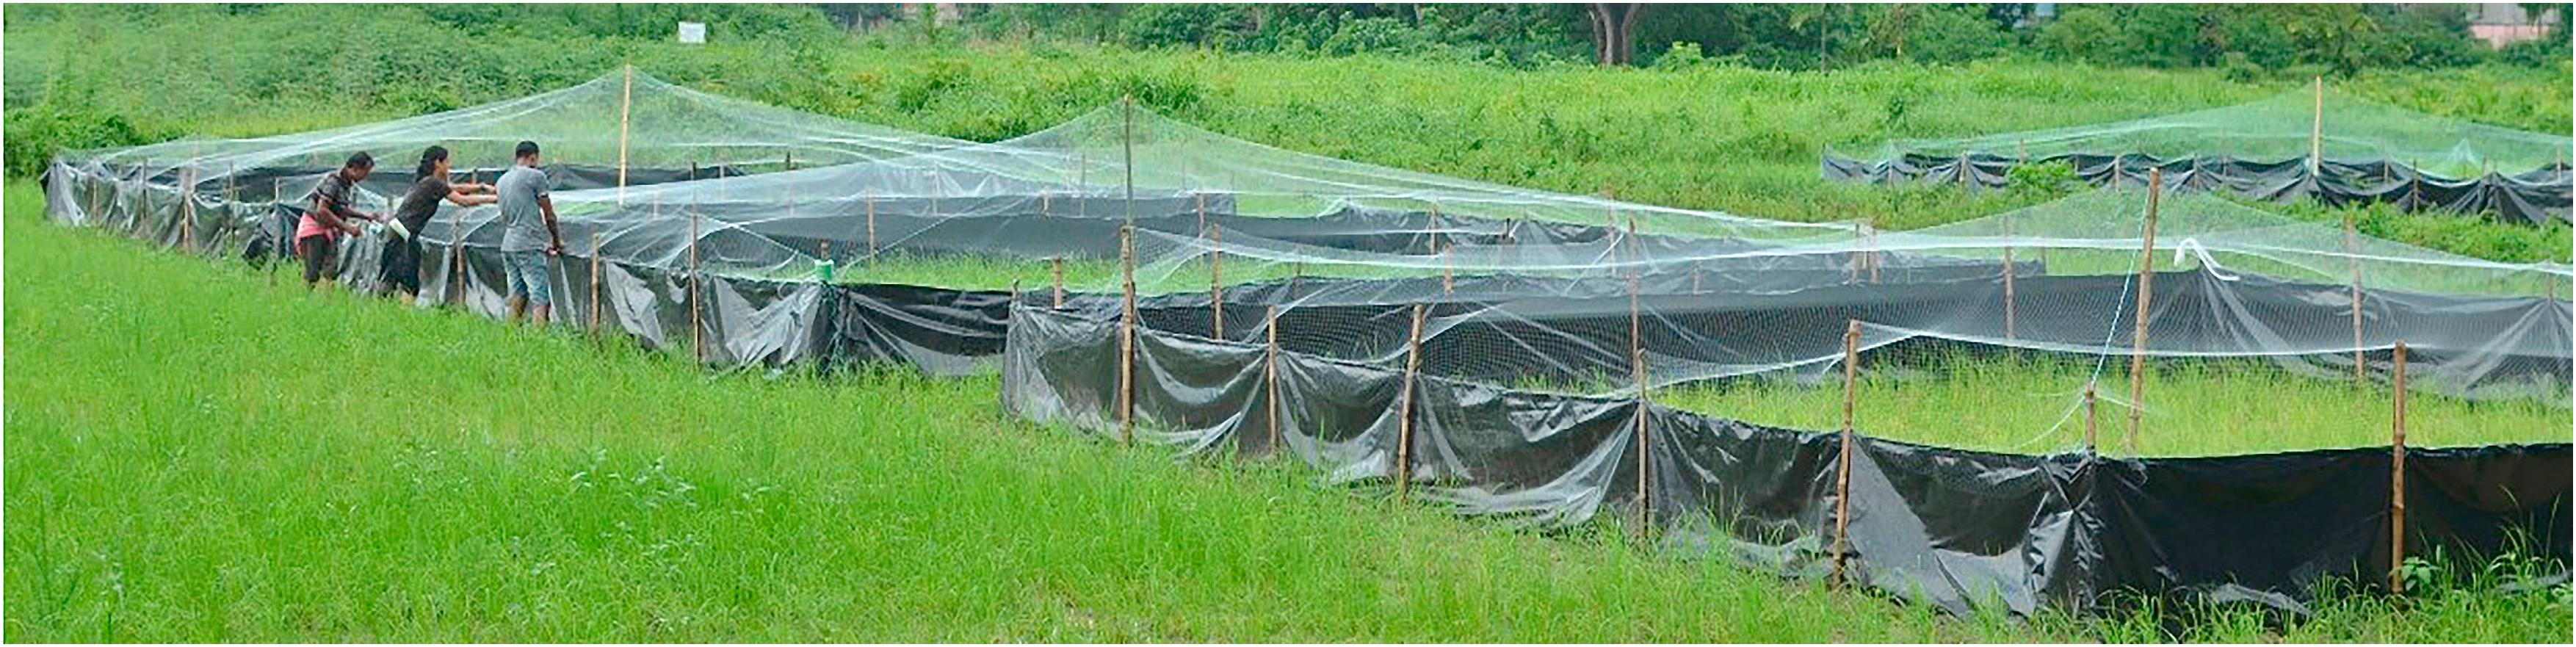
Each plot was secured using 3 ft high (from above the ground) drift fences on all four sides. Plots were secured with a mesh net of 4.8 cm gap size on the enclosure from the top as well as the sides of the fences (that allowed movements of arthropods) to exclude predation risk on both the pests and experimental frogs by birds as well as to prevent the escape of any frogs from the experimental enclosures by climbing on the fences (Fig. 1). Plots were left undisturbed for 15 days before the release of frogs. Frogs were released after sunset when the temperature was low to prevent desiccation. No pesticides, herbicides, or fertilizers were additionally applied. The study continued throughout the vegetative phase through the flowering stage from August to December.
Arthropod sampling and identification
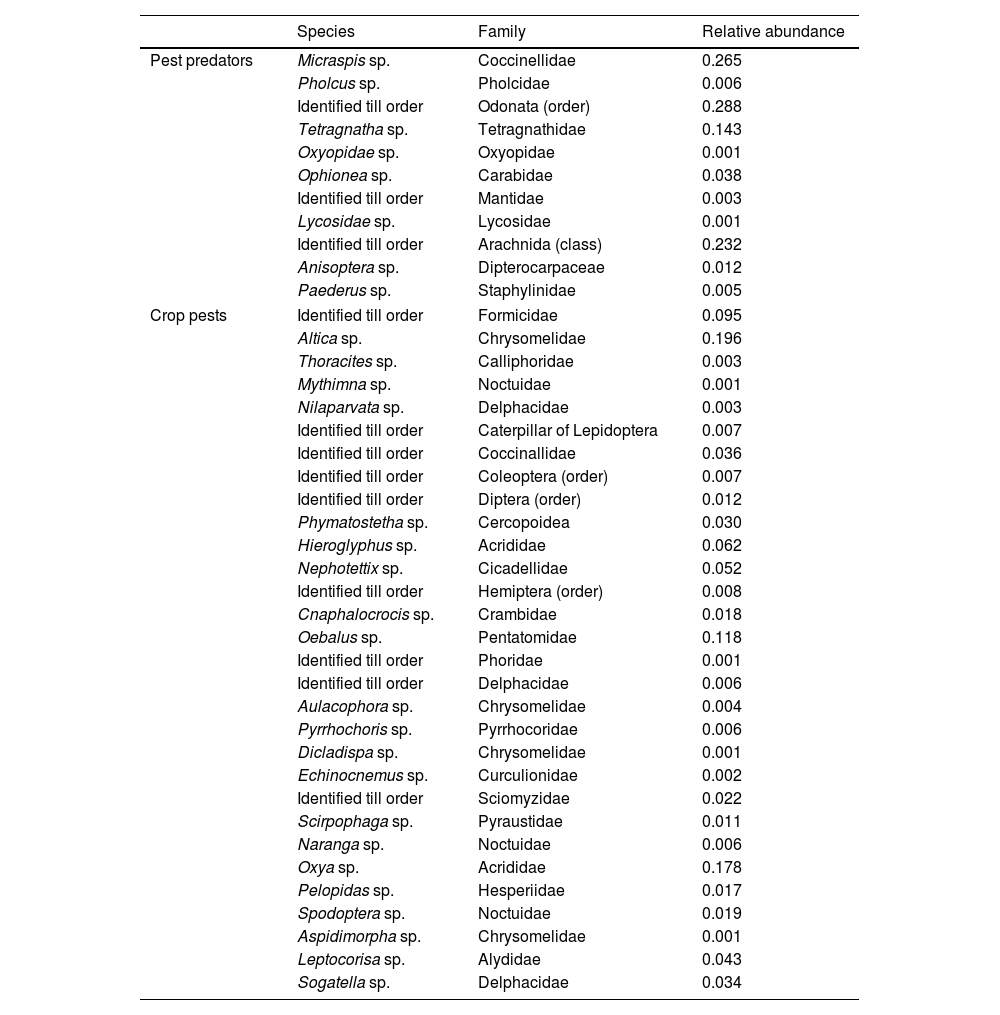
Sampling was divided into four phases- sample phase 1 (early vegetative phase), phase 2 (late vegetative phase), phase 3 (flowering phase) and phase 4 (fruiting phase). Insect sampling was conducted from 6.00 h to 13.00 h of the day. We used the sweep netting method with a standard-sized sweep net of 60.96 cm in length and an opening diameter of 30.48 cm (Fatahuddin et al., 2020). We used sweep netting owing to the accurate representation of the frog diet and the available prey as was also reported by Yousaf et al. (2010). Sweep netting was done 10 times along each of the four sides of the experimental plots leaving 3 m space on either side making a total of 40 sweeps per plot. All specimens collected were wet preserved in 70% alcohol for later identification and categorization. Table 1 provides a list of crop pests and arthropod pest predators along with their relative abundance. In most cases, we identified arthropods obtained in active sampling up to the genus level and categorized them into pests and non-pest natural predators (NICRA, 2011).
List of crop pest predators and pests observed in sweep net along with their relative abundance.
| Species | Family | Relative abundance | |
|---|---|---|---|
| Pest predators | Micraspis sp. | Coccinellidae | 0.265 |
| Pholcus sp. | Pholcidae | 0.006 | |
| Identified till order | Odonata (order) | 0.288 | |
| Tetragnatha sp. | Tetragnathidae | 0.143 | |
| Oxyopidae sp. | Oxyopidae | 0.001 | |
| Ophionea sp. | Carabidae | 0.038 | |
| Identified till order | Mantidae | 0.003 | |
| Lycosidae sp. | Lycosidae | 0.001 | |
| Identified till order | Arachnida (class) | 0.232 | |
| Anisoptera sp. | Dipterocarpaceae | 0.012 | |
| Paederus sp. | Staphylinidae | 0.005 | |
| Crop pests | Identified till order | Formicidae | 0.095 |
| Altica sp. | Chrysomelidae | 0.196 | |
| Thoracites sp. | Calliphoridae | 0.003 | |
| Mythimna sp. | Noctuidae | 0.001 | |
| Nilaparvata sp. | Delphacidae | 0.003 | |
| Identified till order | Caterpillar of Lepidoptera | 0.007 | |
| Identified till order | Coccinallidae | 0.036 | |
| Identified till order | Coleoptera (order) | 0.007 | |
| Identified till order | Diptera (order) | 0.012 | |
| Phymatostetha sp. | Cercopoidea | 0.030 | |
| Hieroglyphus sp. | Acrididae | 0.062 | |
| Nephotettix sp. | Cicadellidae | 0.052 | |
| Identified till order | Hemiptera (order) | 0.008 | |
| Cnaphalocrocis sp. | Crambidae | 0.018 | |
| Oebalus sp. | Pentatomidae | 0.118 | |
| Identified till order | Phoridae | 0.001 | |
| Identified till order | Delphacidae | 0.006 | |
| Aulacophora sp. | Chrysomelidae | 0.004 | |
| Pyrrhochoris sp. | Pyrrhocoridae | 0.006 | |
| Dicladispa sp. | Chrysomelidae | 0.001 | |
| Echinocnemus sp. | Curculionidae | 0.002 | |
| Identified till order | Sciomyzidae | 0.022 | |
| Scirpophaga sp. | Pyraustidae | 0.011 | |
| Naranga sp. | Noctuidae | 0.006 | |
| Oxya sp. | Acrididae | 0.178 | |
| Pelopidas sp. | Hesperiidae | 0.017 | |
| Spodoptera sp. | Noctuidae | 0.019 | |
| Aspidimorpha sp. | Chrysomelidae | 0.001 | |
| Leptocorisa sp. | Alydidae | 0.043 | |
| Sogatella sp. | Delphacidae | 0.034 | |
From 17.00 h to 21.00 h every day we counted the frogs and checked for any dead or desiccated frogs inside the experimental plot to ensure that the number of frogs remained constant. We performed a diet analysis study following the stomach flush technique which allowed us to select prey for the functional response study (Solé et al., 2005).
Experiment to study the feeding potential of the model speciesWe performed a mesocosm experiment with one size class of frogs (5–6 cm, adult) and three prey densities of 8, 33, and 43. We used medium-sized grasshoppers (Gesonula sp., family Acrididae) in this experiment, as representative of crop pests, as grasshoppers were found to frequently constitute frogs’ diet during stomach flush. We used this species as representative pest species (the pest species we observed in sweep nets belonged to the same family, refer to Table 1) as they can be raised and maintained in the laboratory for scientific purpose hence was outsourced and at the same time Gesonula sp. are essentially defoliators of crops as well. The densities of grasshoppers used were replicates of the observed total available pest densities in control treatments (no frog treatments) across sampling sessions (observed pest densities per 10 × 10-m experimental plots were 8, 33, 43, and 44 in four consecutive sampling sessions). A total of 12 frogs participated in this experiment. Four frogs were randomly allotted to each of the three different pest density treatments. The experiment was conducted from September to November 2019. On the day of the experiment, one predator was transferred to the experimental mesocosm of 1 × 1 m that was designed to mimic the natural environment of these predators. Health of the mesocosm was properly maintained. Total experimental time was 17 h. At the end of the experiment, we removed the predator and counted the remaining prey. All predators had the same starvation period before they were included in an experiment. Since they feed on live prey, we also maintained a separate terrarium for the prey at varying densities to check the mortality rate within 24 h and found no death during the period.
To collect data on the handling time and attack rate of frogs, we replicated the experiment with varying prey densities and recorded the feeding rates for 30 min using a video camera (Nikon 5200D) fitted outside the terrarium.
Statistical analysisEffect of frog density and paddy growth phase on crop pest and predator build-upA generalized Linear Mixed Model (GLMM) was used to predict changes in pest and natural predator abundance with varying phases of paddy growth (represented by sampling sessions) and frog treatments (Ghosh and Basu, 2020). Sampling phases and frog treatments were the fixed effects, and treatment within blocks was included as random effects in the model. We tested the significance of the two fixed effects using Analysis of Variance (ANOVA) Wald Chi-Square test and performed a posthoc test on the significant fixed effects. Further, for testing the significance of the random effects, we compared the models with and without random effects using ANOVA.
Functional response of predatorTo understand how feeding rate might be influencing biological pest regulation we performed a diagnostic test for the functional response (Pritchard et al., 2017) with prey eaten as a function of prey provided. Based on the result, we developed a final model with attack rate and handling time.
All the analyses were performed with the software R (version 3.5.2) (R Core Team, 2018) using packages nlme (Pinheiro and Bates, 2023), Mass (Venables and Ripley, 2002), lmtest (Zeileis and Hothorn, 2002), multcomp (Hothorn et al., 2008), lme4 (Bates et al., 2015), car (Fox and Weisberg, 2019), and frair (Paterson et al., 2014).
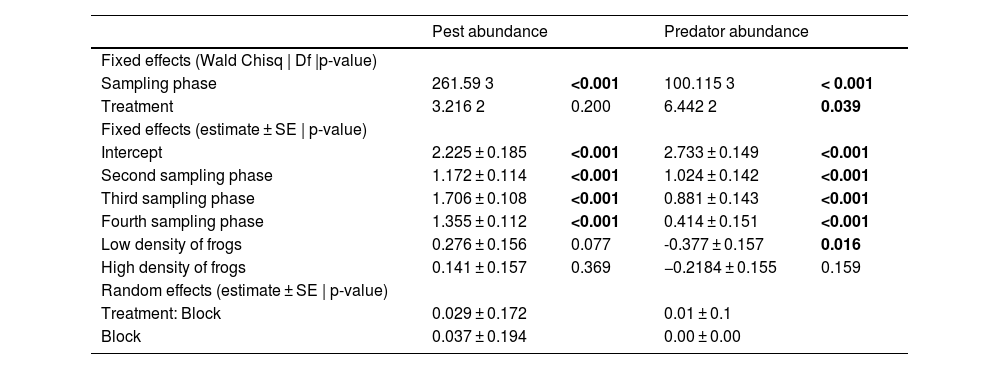
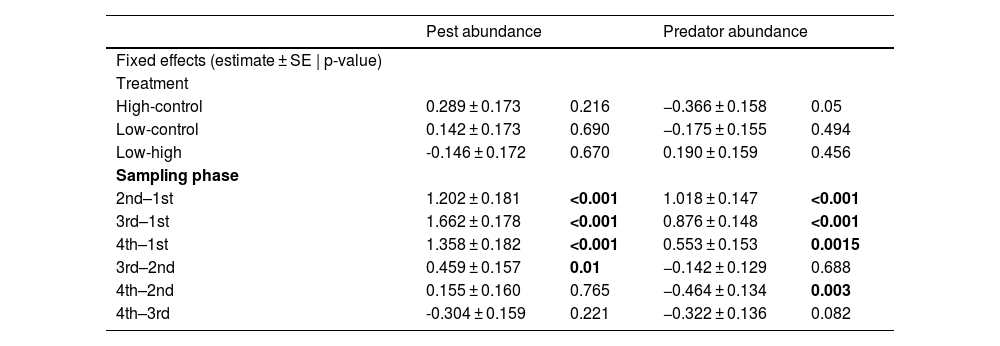
ResultsEffects of frog abundance on crop pests and beneficial arthropod predatorsResults from the GLMM showed that pest abundance was significantly affected by the paddy growth phases (Chi square = 261.590; df = 3; p < 0.001), especially by the 2nd (p < 0.001), 3rd (p < 0.001), and 4th (p < 0.001) phases. There was no significant effect of frog predation on pests at either high or low frog densities (Chi-square = 3.216; df = 2; p = 0.200; 10 frog treatment p = 0.369; 5 frog treatment p = 0.077). Arthropod pest predator abundance also was significantly affected by different paddy growth phases (Chi-square = 100.115; df = 3, p < 0.001), especially the 2nd (p < 0.001), 3rd (p < 0.001), and 4th (p = 0.006) phases. Interestingly, the abundance of beneficial arthropods was significantly affected by frog density (Chi-square = 6.442; df = 2; p = 0.039), especially by the lower density of frogs (5 frog treatment p = 0.016) and the effect was negative. However, abundance of beneficial arthropods was not affected by higher frog density (10 frog treatment p = 0.16). Table 2 provides a summary of the results we obtained from the ANOVA and GLMM. Tukey’s posthoc test suggests that 1st phase had lower values than the remaining phases, 2nd had lower values than the 3rd, and the 3rd and 4th did not differ for pests. For arthropod pest predators, 1st phase had lower values than the remaining phases, 2nd had lower values than the 4th, whereas 2nd and 3rd, and 3rd and 4th phases did not differ (Table 3). There was no significant difference between the models with random effects and without random effects (for pest abundance model: AIC value for model with random effects = 296, AIC value for model without random effects = 297; p = 0.08; for arthropod predator abundance: AIC value for model with random effects = 268, AIC value for model without random effects = 266, p = 0.35).
Summary of the results from ANOVA Wald Chi-square test for significance testing of fixed effects (showing Chi-square, df and p values) and GLMM results (showing estimates, standard error, and p-values) between levels of fixed effects and random effects. Significant results (p-value < 0.05) are in bold.
| Pest abundance | Predator abundance | |||
|---|---|---|---|---|
| Fixed effects (Wald Chisq | Df |p-value) | ||||
| Sampling phase | 261.59 3 | <0.001 | 100.115 3 | < 0.001 |
| Treatment | 3.216 2 | 0.200 | 6.442 2 | 0.039 |
| Fixed effects (estimate ± SE | p-value) | ||||
| Intercept | 2.225 ± 0.185 | <0.001 | 2.733 ± 0.149 | <0.001 |
| Second sampling phase | 1.172 ± 0.114 | <0.001 | 1.024 ± 0.142 | <0.001 |
| Third sampling phase | 1.706 ± 0.108 | <0.001 | 0.881 ± 0.143 | <0.001 |
| Fourth sampling phase | 1.355 ± 0.112 | <0.001 | 0.414 ± 0.151 | <0.001 |
| Low density of frogs | 0.276 ± 0.156 | 0.077 | -0.377 ± 0.157 | 0.016 |
| High density of frogs | 0.141 ± 0.157 | 0.369 | −0.2184 ± 0.155 | 0.159 |
| Random effects (estimate ± SE | p-value) | ||||
| Treatment: Block | 0.029 ± 0.172 | 0.01 ± 0.1 | ||
| Block | 0.037 ± 0.194 | 0.00 ± 0.00 | ||
Results of posthoc test for the fixed effects with estimates, standard error, and p-values. Significant results (p-value < 0.05) are in bold.
| Pest abundance | Predator abundance | |||
|---|---|---|---|---|
| Fixed effects (estimate ± SE | p-value) | ||||
| Treatment | ||||
| High-control | 0.289 ± 0.173 | 0.216 | −0.366 ± 0.158 | 0.05 |
| Low-control | 0.142 ± 0.173 | 0.690 | −0.175 ± 0.155 | 0.494 |
| Low-high | -0.146 ± 0.172 | 0.670 | 0.190 ± 0.159 | 0.456 |
| Sampling phase | ||||
| 2nd–1st | 1.202 ± 0.181 | <0.001 | 1.018 ± 0.147 | <0.001 |
| 3rd–1st | 1.662 ± 0.178 | <0.001 | 0.876 ± 0.148 | <0.001 |
| 4th–1st | 1.358 ± 0.182 | <0.001 | 0.553 ± 0.153 | 0.0015 |
| 3rd–2nd | 0.459 ± 0.157 | 0.01 | −0.142 ± 0.129 | 0.688 |
| 4th–2nd | 0.155 ± 0.160 | 0.765 | −0.464 ± 0.134 | 0.003 |
| 4th–3rd | -0.304 ± 0.159 | 0.221 | −0.322 ± 0.136 | 0.082 |
To further explain this, we explored the pest-predator build-up across the three treatments (Fig. 2). From the graph it is clear that pest abundance decreases substantially in high frog density (i.e., low intensification) compared to the control plot without frogs, however, this difference is not evident between control plots and low frog density (i.e., in high intensification). Especially, in the third phase of sampling, graphical representation revealed a prominent variation in pest-predator build-up pattern between the treatments. During the third phase, the availability of pests per arthropod predator was 3.9 at lower frog density. In contrast, at higher frog density, the availability of pests per arthropod predator was 1.7 while for the control treatment, it was 1.1.
Functional response across four sampling phases.")
Diagnostic tests indicated the feeding response pattern in our focal frog species to be Holling’s Type II. The final model with attack rate and handling time, and with the exponential co-efficient “q” fixed at 0, showed a significant effect on handling time (p < 0.0001). This validates that the functional response is of Hollings’s Type II (Fig. 3).
Discussion
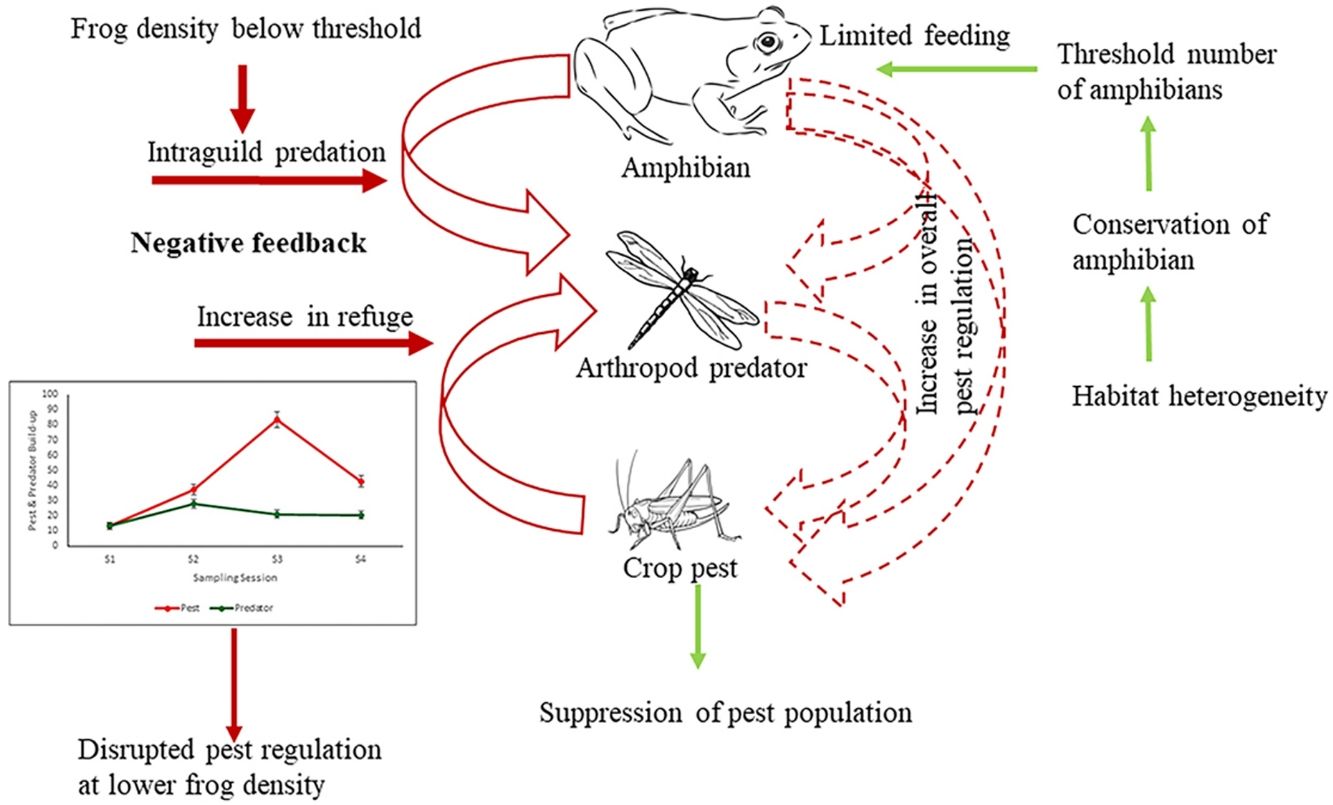
This study clearly brings out the importance of maintaining a threshold density of beneficial organisms in a natural multi-trophic system, below which not only does the ES provider fail to provide the desirable service it may be also counter acting. This was suggested by the fact that amphibians at lower density (in high-intensive farming) would feed on beneficial arthropods reducing the overall pest regulation. Further, it shows how population loss of key ES providing biodiversity elements can translate into the loss of ecosystem service provisioning using amphibians as model bioregulators of rice pests.
In our study, although frogs consumed pests, their existing field densities (Ghosh and Basu, 2020) were insufficient for significant pest regulation in areas of both low and high agricultural intensification. Even the highest observed frog density (10 frogs/100 m2) in the low-intensive farmlands, appears to fall short of the threshold at which they can significantly regulate pests.
There can be three possible reasons why frogs failed to regulate pests. Firstly, the existing density of frogs even in the low intensification areas is not adequate to control the pests. Teng et al. (2016) reported that an experimental density of 150 frogs/100 m2 could effectively control pests. There is a wealth of literature that shows that traditional or low-intensity farmlands harbor more biodiversity and density than conventional intensive farming areas (Gonthier et al., 2014; Stein-Bachinger et al., 2022). However, whether this higher diversity and density of an ecosystem service provider is sufficient for effective service delivery has hardly been questioned. The current density of amphibians in low-intensive agriculture is evidently below the threshold that can be expected to provide a considerable service to the ecosystem. However, reduction of intensification pressure has been reported to increase frog density (Ghosh and Basu, 2020) and as the present study shows increased frog density does impact pest regulation due to the cascading effect (of increased insect predators) in the multi-trophic system.
The second possible reason for the unaltered pest population at both high and low frog densities (in low and high-intensive farming respectively) could be due to trophic interactions interfering with pest regulation. As the results show arthropod predators were regulated by the frogs at a low density due to intraguild predation, which could have reduced the predation pressure by arthropod predators on pests. In a multi-species and multi-trophic environment with a super-predator like frog, natural pest regulation may remain unrealized. It is well established that generalist predators may have an antagonistic effect on biological control (Perez-Alvarez et al., 2019) especially because of diffused predation pressure (Wells, 2007). However, if frogs feed on crop pests only, the growth rate of beneficial arthropods would decrease as they are robbed off their resource, and eventually, this could further lead to an increase in crop pest abundance. Again, if the harvesting is shifted completely towards arthropod predators there would be an increase in crop pest abundance due to the release of interspecific interaction from the pest predator population. Therefore, the presence of frogs would cause negative feedback on the crop pest predator population, consequently increasing crop pest abundance. Our study shows frogs exhibit a preference for arthropod predators over pests, especially at a lesser density (Table 2, Fig. 4). The diet of amphibians in croplands has been found to be dominated by non-pests (94% of diet) (Brown, 1974; Khatiwada et al. 2016). Lisiecki (2019) also highlights the absence of any significant effect of lizards on crop damage due to intraguild predation on the beneficial arthropods. Though generalist species have a wide range of prey choices, they often weaken the biocontrol efficiency as they kill and eat natural enemies as well (Snyder et al., 2022). Therefore, intraguild predation can be a cause for disrupting pest regulation in a multitrophic system.
 reduces the arthropod pest predator density due to resource depletion (broken arrow) lowering the predation pressure on crop pests by the pest predators (grey arrow) (A). The preference of frogs for the arthropod pest predators (black arrow) causes an increase in crop pests due to lack of predation pressure from the predators (arrow in grey) (B). Width of arrows signify feeding intensity.")
Impact of prey preference shift in super-predator frog resulting in disrupted pest regulation. The preference of frogs for crop pests (black arrow) reduces the arthropod pest predator density due to resource depletion (broken arrow) lowering the predation pressure on crop pests by the pest predators (grey arrow) (A). The preference of frogs for the arthropod pest predators (black arrow) causes an increase in crop pests due to lack of predation pressure from the predators (arrow in grey) (B). Width of arrows signify feeding intensity.
The third possible factor that may affect pest regulation by frogs could be their feeding behavior. The model frog species seems to follow a Type II functional response pattern, however, this conclusion is based on a small number of replicates. This means that the feeding rate remains constant beyond a certain prey density and is dependent upon the prey handling time. Handling time (Th) relates to every prey item consumed and is indifferent to the prey density. Even with a higher density of grasshoppers, the maximum number of prey consumed was determined by the time spent in prey handling (T/Th). This means that the rate of prey consumption would decline at higher prey densities (that includes both crop pests as well as arthropod pest predators) due to handling constraints (Thorp et al., 2018).
The high prey availability per arthropod pest predator especially for high frog density compared to control can be explained by the following:
- i
Availability of pest refuge — at sampling phase 3 (30–40 days after transplanting) the crops have maximum vegetative mass (leaves and tillers) (http://www.agritech.tnau.ac.in/expert_system/paddy/Botany.html). The pest build-up was also the maximum at this phase. The pests found refuge in increased vegetative mass helping them to evade the frogs. Prey activity, crypsis, and refuge are important components that determine the outcome of prey-predator interactions (Sih and Moore, 1990; Chakraborty et al., 2017) and can destabilize the prey–predator cycle. Increase in search time also influences the profitability of the prey causing the predators to attack the more conspicuous prey, in our case the arthropod predators.
- ii
High predation pressure of frogs on the arthropod predators - our model species is an ambush forager (field observation) that forages using visual cues of prey movement (Cooper, 1999). Behaviourally predatory arthropods are more agile than the herbivore pests (Ahmed et al., 2016) who remain increasingly well hidden in the higher available vegetative mass and this makes the natural predator easier prey for the super-predator frog.
What still remains to be explained is why higher frog density did not have any significant impact on the arthropod pest predators compared to lower frog density. A possible reason could be increased resource competition among frogs at higher frog density that compels them to seek out other food options i.e., crop pests. However, more conclusive results would require further experimental scrutiny.
Conserving frogs in intensive agricultural landscapes for effective pest regulationThe vulnerability of amphibians to agricultural intensification is globally acknowledged (Ghosh and Basu, 2020). Agricultural intensification is only going to increase in the coming years more so in developing countries to feed the growing population. Our study brings out the need to conserve frogs in the intensive agricultural landscape for effective natural pest regulation service. Scientific management of appropriate landscape structures at the patch, and landscape levels, like semi-natural habitats, hedgerows, ephemeral water bodies, degree of connectivity with adjoining remnant natural vegetation, and habitat heterogeneity (Ghosh and Basu, 2020), will help in maintaining a healthy frog community. Vegetated buffer strips that include vegetation along ditches, and levees connecting various crop areas are important for maintaining ecosystem health (Marshall and Moonen, 2002), at the same time, they also provide habitat refugia for the amphibians. Further, the presence of vegetated strips provides continuous prey availability for amphibians (Martori et al., 2005). Such linear features and their degree of connectivity to adjoining natural or semi-natural vegetation would eventually increase the abundance of herpetofauna in general. The consequent environmental heterogeneity between natural and croplands would increase species co-existence among natural arthropods as well as the amphibian assemblage (Da Silva et al., 2012). Alongside bolstering the frog density and diversity, complex landscapes can weaken the strength of intraguild predatory effects by reducing niche overlap through spatial separation or even alternate resource availability (Perez-Alvarez et al., 2019).
As our study shows, despite the limitations, we discuss in this study, amphibians can still make good pest regulators provided they are maintained in a threshold abundance. Conservation of species or groups of species and maintaining their population density above specific threshold levels in an agricultural landscape at which they can be effective is the only desirable pathway towards developing an ecologically healthy sustainable agricultural landscape.
Authors’ contributionDG and PB conceived the idea, DG worked on the methodology, and collected and analysed data; DG prepared the first draft and DG and PB wrote the final manuscript. Both authors approve the publication of the manuscript.
Declaration of competing interestThe authors report no declarations of interest.
We thank Prof. Santanu Jha and his team from Bidhan Chandra Krishi Viswavidyalaya for their help in insect and pest infestation identification. We acknowledge Arnab Chakraborty for his support during the fieldwork.
The following are the supplementary data to this article:

