


Ecosystem resilience and functioning depends largely on species’ diversity and ecological roles. Functional diversity (FD) is a measure of the diversity of roles within ecosystems. The massive population and species extinction crisis, namely biological annihilation, is occurring around the World. Here we assessed the influence of mammals at risk, according to IUCN, on FD (trait richness) across ecoregions globally. Overall global models showed significant influence of mammals at risk over FD, and this influence was greater at regional scale. At least 65% of total FD was explained by threatened species in selected ecoregions in Asia, Europe, America and to a lesser extent in others. Since the ecoregion FD is disproportionally influenced by species at risk of disappearing in the short term, ecosystems supporting those species are more vulnerable to ecological meltdown through loss of its functional and resilience capacity; implications for humanity are unprecedented and ecological meltdown will undoubtedly impact to the globe.

The loss of species and populations is one of the most serious challenges humanity has ever faced (Ceballos et al., 2017). Currently recognized as the sixth mass extinction, the extent of this challenge remains to be fully understood (Bradshaw et al., 2021). Although we have gained considerable insights into species and population extinctions (Ceballos et al., 2015; Ceballos and Ehrlich, 2002), the rate at which species are disappearing compared to historical data (Ceballos et al., 2020, 2017, 2015; Ceballos and Ehrlich, 2018) and the overall impacts of such losses (Bradshaw et al., 2021; Torres-Romero et al., 2020), still leave many questions unanswered, especially from an ecosystem perspective. Understanding the impact of species loss on key processes such as nutrient cycling, productivity, energy flow and resource use, among many others, is critical. These processes, which refer to 'ecosystem functioning,' are essential for maintaining ecosystem services and overall ecosystem health. To date, several studies have addressed the loss of ecosystem function (Calba et al., 2014; Cooke et al., 2019; Volaire et al., 2020), and extensive research has explored the relationship between biodiversity and ecosystem function, including long-term experiments (e.g., Jena experiment, BEF, LTER Network, among other). However, a comprehensive understanding of the spatial variation in the impact of species loss on ecosystem functionality remains limited (Toussaint et al., 2021).
Ecosystem functioning and resilience is determined in large part by the functions and roles that species play in those ecosystems (González-Maya et al., 2016; Tilman et al., 1979; Volaire et al., 2020). These functions are a direct result of functional traits, which are the morphological, physiological, or behavioral characteristics of species that influence their interactions with the environment and consequently affect ecosystem processes. For example, plant traits related to resource acquisition (e.g., root architecture) directly influence nutrient uptake and water availability, impacting primary productivity. Similarly, animal traits related to diet (e.g., herbivory, carnivory) affect plant community composition and energy flow. The assessment of functional traits diversity can be used to evaluate the relative importance of the diversity of a plant or animal group in the functioning of an ecosystem (Petchey and Gaston, 2002a; Tilman, 2001). The diversity of these functional traits within a community –'functional diversity' – is crucial for maintaining stable and efficient ecosystem´s functions. For instance, a greater diversity of root architecture allows for more complete nutrient uptake from different soil layers, while a diversity of dietary strategies ensures that nutrients are processed and recycled through different pathways. Loss of functional diversity, therefore, can impair these processes and reduce the overall efficiency of multiple ecosystem functions. Despite recent advances in the understanding of functional diversity and its role in ecosystem´s processes (Cadotte et al., 2011; Hooper et al., 2002; Mayfield et al., 2010; McGill et al., 2006; Tilman et al., 1979), many questions have not been fully explored, especially regarding the impact of species extinction on functional diversity (González-Maya et al., 2017; Petchey and Gaston, 2002b; Toussaint et al., 2021). A comprehensive understanding of this impact is crucial for improved prioritization and conservation planning (Devictor et al., 2010; Schmera et al., 2009). Since the roles of species can be assessed through their functional complementary (Fonseca and Ganade, 2001), the extinction or colonization of a species can alter the functional diversity of an ecosystem at different organizational levels, such as within a trophic level, across trophic levels, or at the community level (Biswas and Mallik, 2011; Blaum et al., 2011).
Mammals, like many other plant and animal groups, play a major role in shaping and maintaining ecosystems, significantly influencing their function and dynamics through their diverse roles as architects, pollinators, predators, and consumers (Asquith et al., 1997; Lacher et al., 2019; Sinclair, 2003a, b). Their influence extends beyond providing specific ecosystem services; they profoundly shape and transform the ecosystems they inhabit through diverse ecological pathways (Lacher et al., 2019). Furthermore, as more information is available on mammal ecology and role on ecosystems, they can also serve as a model of the impact of population and species losses in an ecosystem. Currently, at least 25% of mammal species worldwide are facing imminent extinction (Schipper et al., 2008). This alarming trend is even more pronounced at the population level (Ceballos et al., 2020; Ceballos and Ehrlich, 2002). Therefore, a better understanding of the effect of mammal population and species losses on functional diversity is fundamental to understanding the impact of the larger extinction crisis (Ceballos et al., 2017, 2010) and new insights of the degradation of the world’s ecosystems (González-Maya et al., 2017; Terborgh et al., 2001). Here we assessed mammal functional diversity across the world´s ecoregions and estimated the global and regional variation of functional diversity explained by the number of threatened species. We specifically addressed (i) the variation in functional diversity across ecoregions; (ii) how the number of threatened species affects mammal functional diversity globally; and (iii) whether the relationship between the number of threatened species and mammal functional diversity varies across regions, highlighting potential areas of greater vulnerability. Understanding the magnitude of this influence, and its geographical variation, can provide clues on where ecosystem meltdown can occur when threatened functional assemblages are at imminent extinction risk.
Materials and methodsWe estimated mammal functional diversity of the world’s ecoregions using published data (Davidson et al., 2009; Jones et al., 2009), and our own updates (González-Maya et al., 2017), based on three primary life-traits: body mass, habits, and guild for 3,554 mammal species using published data. While our primary data sources were the global trait databases, we supplemented these with information from a range of published literature, such as species-specific ecological studies and regional fauna compilations, to create a more complete dataset. The methodology for this data integration, including our approach to addressing missing data, is detailed in González-Maya et al. (2016; 2017), which resulted in a functional trait database covering a high number of mammal species (>91%; SI). These traits represent a broad array of both mammal resource and habitat use, are available for most species, and have been useful in similar previous analyses (Davidson et al., 2009; Safi et al., 2011). Based on the distribution polygons for all mammal species (Schipper et al., 2008; UICN, 2018) and the world’s ecoregions defined by the World Wildlife Fund (Olson et al., 2001), local communities were defined as the mammal species assemblages present within each ecoregion. Based on the species composition of these virtual assemblages and the functional trait values of the constituent species, we then calculated the functional diversity index for each ecoregion. The index is based on the functional richness definition (González-Maya et al., 2016; Mason et al., 2005), based on the Petchey and Gaston FD index (Petchey and Gaston, 2002a) for each ecoregion and associated the number of species in each risk category of the IUCN Red List of Threatened Species ((UICN, 2018); Fig. S1). FD index (FDI) is based on the functional richness definition by Mason et al. 2005: “the amount of niche space filled by species in the community”. We selected this metric as it can be used with multiple traits, do not depends on abundance data and mostly because has significant interaction with species richness (González-Maya et al., 2017; Mason et al., 2005). Specifically, the Petchey and Gaston FD index quantifies functional diversity by constructing a dendrogram based on the functional traits of the species within an ecoregion. The total length of all the branches in this dendrogram represents the functional diversity of that assemblage. A large FDI value indicates that the species within the ecoregion occupy a greater extent of the functional trait space. This suggests a wider array of ecological roles and strategies are present, potentially contributing to greater ecosystem resilience and stability. Conversely, a small FDI value implies that the species are clustered more closely in functional trait space, indicating lower functional redundancy and potentially greater vulnerability to environmental changes or species loss, as fewer species may fulfill similar ecological roles. Furthermore, since FDI is expected to be closely related to species richness, the contribution of threatened species to overall functional diversity is inherently linked to the contribution of non-threatened species. Since the total species richness is the sum of threatened and non-threatened species, their respective contributions to functional diversity are necessarily complementary. Although Data Deficient species lack sufficient information for formal categorization, their potential vulnerability warrants consideration; therefore, they were included in our analyses to provide a more comprehensive assessment of potential biodiversity loss. Because we expected a global variation in the degree of influence of functional diversity exerted by threatened species and a subsequent variation at finer scales, we initially used ordinary least squares (OLS) models with all possible combinations of variables (i.e., number of Data Deficient - DD, Vulnerable - VU, Endangered- EN and Critically Endangered - CR species) as a global overall model. We then selected the best performing models based on Akaike Information Criteria weights (AICw; (Wagenmakers and Farrell, 2004); Table S1) and assessed the variability explained by the regressor variables based on the corrected R2 value. We used the Koenker statistic to analyze the non-stationarity characteristics of the models and to establish if the influence of species at risk on functional diversity was consistent across the globe (i.e., all geographic scales [Brunsdon et al., 1996]). To explore the spatial variability of the influence, we employed a geographically weighted regression (GWR) based on the selected variables derived from the OLS and compared model performance based on AICw and variability explained based on the corrected R2 values (Brunsdon et al., 1996; Fotheringham et al., 2002); Table S1). We then compared the AICw and R2 for both OLS and GWR models and estimated the R2 values weighted for both biomes and realms to ascertain if there was a stronger influence relative to major habitat types (i.e., biomes) and biogeographic realms (i.e., ecozones). Once a model was selected, we projected the local R2 on each ecoregion identifying those in which species at risk had the highest influence on functional diversity; those ecoregions with the higher R2 values suggested that functional diversity is highly determined by the number of species in each risk category, while lower R2 values indicated less influence and therefore the non-threatened species (i.e., Least Concern and Near Threatened Species) had a major influence of the functional diversity measure. All analyses were performed using Infostat (Di Rienzo et al., 2011), FDiversity (Casanoves et al., 2011) and ArcGIS 10.x (ESRI, 2025).
ResultsThreatened species significantly determine mammal functional diversity, although this relationship is not homogeneous globally, and some ecoregions are more susceptible to species loss, therefore, functional diversity loss.
Mammal species at risk showed different geographic relationships with Functional diversity (Fig. 1). For example, Data Deficient and Vulnerable species contributed 59% of global mammal functional diversity; however, this trend was nonstationary (i.e., is not homogeneous across all ecoregions). This suggests that the relationship between species at risk and functional diversity has significant geographic variability (Koenker (BP) Statistic [f] = 106.89 p < 0.001), and some traits or potential explaining factors are missing for certain locations (Figure S2).
 Data Deficient, (b) Vulnerable, (c) Endangered and (d) Critically Endangered IUCN Red List of Threatened Species categories.")
When we selected the best performing geographically weighted model for this global variation, we noted that Data Deficient, Vulnerable, Endangered and Critically Endangered species accounted for 73% of the functional diversity. However, coefficients for each variable, such as the direct influence of each variable and the local R2, which represents functional diversity variation explained by the selected variables, vary considerably across the world’s ecosystems. Ecoregions in eastern Asia, Europe, Mesoamerica, and northern South America, and the eastern coast of North America are the regions where threatened species exert a higher degree of influence on functional diversity in contrast to ecoregions in Alaska and southern Africa (Fig. 2A). Threatened species of the Neotropical, Palearctic, Indomalaya and Oceania ecozones have a substantially greater influence on functional diversity (>0.65) than they do in the Afrotropic ecozone, where the influence index of 0.36 (Fig.2B) is one of the lowest we identified. At the biome scale, the overall influence was the greatest for tropical and subtropical broadleaf moist forests and the tundra and the lowest for temperate coniferous forests and tropical and subtropical grasslands, savannas, and shrublands (Fig.2C). The greatest effect on an ecoregion´s functional diversity was exerted by the number of Vulnerable species (mean coefficient (M.Coef.) ± SD = 0.184 ± 0.07; Fig. 3C), followed by Endangered species (M.Coef. ± SD = 0.111 ± 0.168; Fig. 2B), Data Deficient (M.Coef. ± SD = 0.101 ± 0.069; Fig. 3D) and Critically Endangered species (M.Coef. ± SD = −0.023 ± 0.169; Fig. 3A). For coefficients extrapolated to geographical divisions, the models (Table 1) revealed a positive relationship between increased functional diversity and the number of Vulnerable species, with the most evident relationships occurring in Europe, southwestern South America, and eastern Africa (Fig. 3C). In contrast, Endangered species showed a positive influence in North America and a negative influence in South America, Africa, and Europe (Fig. 3B). Data Deficient species exhibited a strong positive relationship with functional diversity in North America, South America, Africa, and Europe, and a negative relationship in Southeast Asia and Australia (Fig. 3A). These maps display the local influence coefficients derived from Geographically Weighted Regression models (Table 1, Supp. Mat.).
 on the world´s ecoregions (a) and weighted by realm (b) and biome (c) scales. Local R2 values derived from a geographically weighted regression model. Note the high R2 values for northern South America, Europe and Asia (a), the overall higher influence in the Neotropic, Paleartic and Indomalaya realms (b), and the tropical and subtropical broadleaf moist forests and tundra (c).")
Maps depicting the variation of functional diversity explained by the number of threatened species (Local R2) on the world´s ecoregions (a) and weighted by realm (b) and biome (c) scales. Local R2 values derived from a geographically weighted regression model. Note the high R2 values for northern South America, Europe and Asia (a), the overall higher influence in the Neotropic, Paleartic and Indomalaya realms (b), and the tropical and subtropical broadleaf moist forests and tundra (c).

Spatial patterns of local influence coefficients for risk categories in the world's ecoregions showing the effects of (A) Critically Endangered, (B) Endangered, (C) Vulnerable, and (D) Data Deficient species. These coefficients were estimated based on the geographically weighted regression model (Table 1). Note the differential weighted influence relative to geographic location.
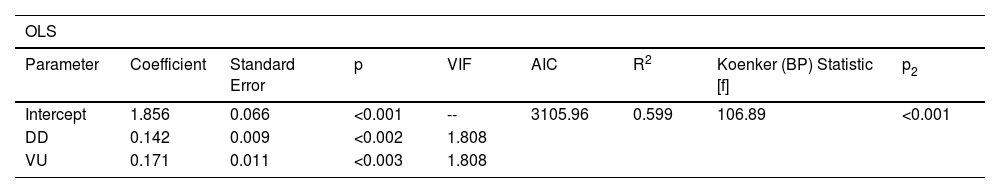
Summary statistics of the Ordinary Least Squares (OLS) and Geographically Weighted Regression (GWR) models selected, including the corrected Akaike Information Criteria (AICc) and R2 values for both models and the variable significance value (p), Variance Inflation Factor (VIF), Koenker nonstationarity statistic, and probability (p2) for the OLS model.
| OLS | ||||||||
|---|---|---|---|---|---|---|---|---|
| Parameter | Coefficient | Standard Error | p | VIF | AIC | R2 | Koenker (BP) Statistic [f] | p2 |
| Intercept | 1.856 | 0.066 | <0.001 | -- | 3105.96 | 0.599 | 106.89 | <0.001 |
| DD | 0.142 | 0.009 | <0.002 | 1.808 | ||||
| VU | 0.171 | 0.011 | <0.003 | 1.808 | ||||
| GWR | ||||||||
|---|---|---|---|---|---|---|---|---|
| Parameter | Mean Coeff. | Standard Deviation | AIC | R2 | ||||
| DD | 0.101 | 0.069 | 2769.85 | 0.735 | ||||
| EN | 0.184 | 0.072 | ||||||
| VU | 0.111 | 0.168 | ||||||
| CR | −0.023 | 0.169 | ||||||
Our findings provide new insights into the relationship between threatened mammal species and functional diversity, refining our understanding of extinction risk and its potential impact on ecosystem functioning and overall, the extinction crisis (Armsworth et al., 2007; Buisson et al., 2013; Cardillo et al., 2006; Cardinale et al., 2012; Ceballos and Ehrlich, 2002).
Our analysis revealed a significant direct relationship between the number of threatened mammal species and functional diversity across global ecoregions. This result aligns with the understanding that threatened species, frequently non-dominant and possessing unique functional traits, are particularly vulnerable to extinction and play a critical role in maintaining ecosystem processes (Toussaint et al., 2021). Although this global pattern is very insightful, our study emphasizes the importance of examining regional-scale variations, as these can reveal more nuanced patterns of functional diversity loss. One of our key findings is the geographically distinct influence of threatened species on functional diversity. Threatened species of the Neotropical, Palearctic, Indomalaya, and Oceania ecozones exhibit a substantially greater influence on functional diversity than they do in the Afrotropic ecozone. This striking difference could reflect a history of past extinctions or range contractions that have already depleted some functional diversity, making the remaining species functionally more similar (Pimiento et al., 2020). Another possibility is that the dominant threats faced by species in the Afrotropics, such as habitat fragmentation, might impact functional diversity differently than the threats prevalent in other ecozones, such as direct exploitation (Leclerc et al., 2020). This geographically varying influence of threatened species on functional diversity highlights the importance of considering regional context in conservation planning. Our findings suggest that some regions are more vulnerable to functional diversity loss than others, even when controlling the number of threatened species. This variability could be due to differences in functional complementarity, historical extinction patterns, or the types of threats faced by species (Leclerc et al., 2020; Cadotte et al., 2011). For example, regions with low functional complementarity might be more resilient to species loss, at least initially, while regions could experience rapid declines in functional diversity with even small numbers of extinctions. The mean negative relationship observed between functional diversity and the number of Critically Endangered species (Fig. 3A, Table 1) warrants further discussion, although it is not generalized globally. This seemingly counterintuitive result can be explained by considering the nature of the FDI and the concept of functional redundancy. FDI quantifies the total extent of functional trait space occupied by species in an ecoregion. In systems where Critically Endangered species exhibit a degree of functional similarity, their loss may have a limited immediate impact on the overall functional diversity, as similar functional roles are still represented by other species (considering our low number of traits). Furthermore, past extinctions might have already led to the loss of functionally distinct species, leaving behind Critically Endangered species that are more functionally similar. On the other hand, the negative relationship between Data Deficient species and functional diversity in Southeast Asia and Australia (Fig. 3A) is also intriguing and may reflect the distinct ecological and evolutionary histories of these regions. In Southeast Asia, for instance, the high rates of habitat loss and fragmentation may disproportionately threaten functionally specialized species, leading to a decline in functional diversity as Data Deficient species are lost. Australia's unique evolutionary history might also contribute to this pattern, with the loss of specific lineages having a significant impact on overall functional diversity. Data limitations and the use of a limited set of functional traits in our study may influence these regional findings, highlighting the need for further research employing a more comprehensive approach to validate them and provide additional insights. Further research is needed to disentangle the complex interplay of these factors and to identify specific functional groups or species that are most critical for maintaining ecosystem processes in different regions (Cadotte et al., 2011; Hooper et al., 2002).
Recent advances in ecosystem functioning theory (Buisson et al., 2013; Devictor et al., 2010) and understanding of animal functional diversity (Blaum et al., 2011; Flynn et al., 2009; Safi et al., 2011) have facilitated the ability to more accurately anticipate the potential impact of species loss on ecosystem functionality (Gonzalez-Maya et al., 2017). By using the well-recognized IUCN guidelines on species threat assessment (UICN, 2018) we documented the relative influence of the species in each risk category on functional dynamics. Understanding this relationship is critical in predicting ecosystem changes resulting from species and population loss. The IUCN model classifies species risk on an ordinal structure based on extinction likelihood, where the Critically Endangered category encompasses those species with the highest likelihood of extinction in the short term (Gonzalez-Maya et al., 2017). Considering the timeframe within which these threatened species are likely to disappear—a period that can vary considerably across species—and the strong linkage between ecosystem functioning and functional diversit y (Díaz and Cabido, 2001), species loss will most likely affect ecosystem dynamics and resilience. Since the species at higher risk significantly contribute to functional diversity, their extinction will therefore significantly affect ecosystem processes (Gonzalez-Maya et al., 2017). The Data Deficient category includes those species for which there is insufficient information to be categorized in one of the highest risk categories (i.e., VU, EN or CR; (UICN, 2018), and may have a latent high risk of extinction. The influence of this category on our model suggests that ecosystem functioning largely depends on species for which basic data on demographics and functional roles are lacking.
While the use of three functional traits and a single taxonomic group (mammals) in this study provides a valuable initial assessment of global patterns, we acknowledge the limitations of this simplified approach. Future research employing more comprehensive datasets and methodologies (e.g., Toussaint et al., 2021) could address these limitations and provide a more complete picture of the complex interplay between species threats, functional diversity, and ecosystem vulnerability. Although we focused on mammals as a potentially keystone group and a useful proxy in the present analysis, other taxa, such as birds, reptiles, amphibians, and fish, also contribute to ecosystem functioning and likely provide functional complementarity. Future research should therefore investigate the functional roles of these diverse taxa and their interactions. Exploring the combined functional diversity of multiple groups would provide a more holistic understanding of ecosystem resilience and vulnerability. As previously suggested, the degree of functional complementarity provided by different taxa likely varies geographically. Some regions may rely heavily on mammals for specific functions, while others may depend more on other groups. Investigating this spatial variation in functional redundancy across multiple taxa is a crucial next step in identifying regions most at risk of ecological meltdown. Furthermore, considering trophic interactions and food web structure, including the roles of invertebrates, would further enhance our understanding of ecosystem vulnerability.
Beyond a presentation of a rather pessimist perspective on the extinction crisis and the likelihood of a geographically differential meltdown of ecosystems, we believe our results contribute to a better understanding of the potential impact on the environment resulting from species loss. Our previous works on the impact of species and population losses, especially for mammals (Ceballos et al., 2017, 2010; Ceballos and Ehrlich, 2002; Schipper et al., 2008), helped define global conservation priorities. The results we presented here further reinforce these priorities and provide a new perspective on what may be lost following species extinction. A well-functioning ecosystem is a requisite for resilience against global pressures such as climate change and other threats (Alberti and Marzluff, 2004; Peterson et al., 1998; Sundstrom et al., 2012; Walker et al., 1999) and the provision of ecosystem services necessary to sustain human populations and biodiversity on Earth (Armsworth et al., 2007; Cardinale et al., 2012; Dias et al., 2013; Flynn et al., 2009). The impacts of the global biological annihilation will likely impact many aspects of humanity and there is still high uncertainty and neglection on which ones will likely represent a more serious challenge (Bradshaw et al., 2021; Ceballos and Ehrlich, 2018); adding up that species and population losses not only represent a huge loss because their intrinsic value but also will severely impact ecosystem resilience and functioning, and that it is more serious in certain regions of the globe, call for urgent actions and resound on the urgency of properly tackling the ongoing sixth mass extinction (Ceballos et al., 2017) and overall the underestimated global biodiversity crisis. The results of our work and similar approaches have the potential to inform for identifying strategies on how to best address these global-level threats resulting from species extinction, and thus help us move across conservation, restoration, and adaptation, likely our best approach for decades to come.
CRediT authorship contribution statementJFGM, IMVV, and GC contributed to all stages of the manuscript.
Data accessibility statementAll data is openly available online and in the supplementary information.
The authors declare that they have no known competing financial interests or personal relationships that could have appeared to influence the work reported in this paper.
We would like to thank E. Martínez-Meyer, L. Víquez-R, A. Arias-Alzate, R. Medellín, H. Zarza and J. Schipper for insightful comments and support throughout the research and writing of this manuscript. R. Bjorkland considerably improved language and manuscript style. All data is freely available elsewhere: species distribution data (UICN, 2018), Ecoregion data (Olson et al., 2001) and trait data (Davidson et al., 2009; Jones et al., 2009), and the specific database including species richness and Functional Diversity Index by ecoregion is included as Supplementary Information.
The following are Supplementary data to this article:

