The definition of conservation targets is strategic for the protection of biodiversity and must ensure the representativeness and persistence of biodiversity components. This is especially critical in fast-disappearing ecosystems, such as in the Cerrado, where opportunities for conservation are rapidly diminishing. We evaluate how different categories of protected areas (PAs) in the Cerrado contribute to achieve the 17% conservation target defined by the Convention on Biological Diversity (CBD). Deforestation rates in sustainable use PAs (IUCN categories IV to VI) are similar to those outside PAs, indicating they are not adequate to ensure the protection of biodiversity. Conversely, strict PAs exhibit significantly less deforestation and should form most of the target content. Because strict PAs represent only 3% of the Cerrado, Brazil is far from achieving the 17% target defined by the Convention on Biological Diversity. Urgent measures toward the creation of strict PAs in the Cerrado are needed, to ensure the representativeness and persistence of its conspicuous biodiversity.
Although mankind is facing an expressive biodiversity crisis (Peh, 2011), conserving nature's legacy is not an easy task. The establishment of reserves networks is an important tool to achieve conservation targets for biodiversity conservation (Margules et al., 2002). Conservation targets can originate from evidence-based studies or from policy-driven suggestions (Svancara et al., 2005). Ideally, reserve networks must be large enough to ensure adequate ecosystem representation and persistence (Gaston et al., 2006), but there is no consensus on the proportion of the natural landscape that must be maintained (Brooks et al., 2006).
A review of conservation goals for different countries and ecosystems indicated an average of 13.3% for policy-driven targets, whereas evidence-based targets were much larger (Svancara et al., 2005). There is a clear conflict between expectations of conservation scientists and policy makers (Wilhere et al., 2008), especially regarding how much land is needed to ensure biodiversity conservation. Protected areas (PAs) are routinely set on residual lands (Adams, 2005), where the land cost is more important than the biological value, rendering the PAs system extremely adverse for biodiversity maintenance (Venter et al., 2014).
The most widely applicable conservation targets are those stated by the Convention on Biological Diversity (CDB), linked to the United Nations Environment Program and signed by 168 countries, including Brazil. The revised and updated strategic plan for global biodiversity conservation for 2011–2020 was recently discussed in Aichi, Japan, and included the establishment of a conservation target of 17% for terrestrial and inland water ecosystems and 10% for marine and coastal ecosystems.
High deforestation rates, typical of tropical regions, are the main cause of biodiversity loss, affecting some of the most biologically diverse countries (Vié et al., 2009). However, even in forested areas biodiversity can be threatened by subsistence hunting and fragmentation processes that lead to defaunation (Peres, 2000), jeopardizing the maintenance of natural populations (Redford, 1992). In the Brazilian Cerrado, the largest and richest Neotropical savanna (Myers et al., 2000), according to the Brazilian deforestation monitoring, the levels of habitat destruction are rampant and only 50% of its natural cover remains. Although the Cerrado accounts for 30% of Brazilian biodiversity, a very small amount of its surface is protected. The main causes of Cerrado deforestation are commodity monocultures and pastures, whereas hydroelectric reservoirs and the expansion of urban areas are secondary causes. Some predictions show a very grim scenario for the native vegetation in a near future (Faleiro et al., 2013). According to the Brazilian government reports, the deforestation rate in the Cerrado in 2009 was 0.32%, more than twice the 0.14% rate observed in Amazonia.
In Brazil, PAs created by federal, state, or municipal governments fit in twelve categories, forming two groups: Integral Protection (IP) and Sustainable Use (SU) PAs (Brasil, 2000). While the primarily goal of the former is to protect natural resources, the latter aim to promote nature conservation and the sustainable use of natural resources. As the creation of PAs is the most effective framework for biodiversity protection, several countries (especially those signatories of the CBD) invest substantial resources for the identification, creation, and management of PAs (Gaston et al., 2006).
Because PAs receive financial resources and public trust, it is essential to understand their effectiveness for biodiversity conservation (Gaston et al., 2006). Considering that the main hallmarks of any successful conservation target are representation (all known or relevant ecosystems, species, and populations included in the system), redundancy (how much of ecosystems, species, and populations included), and persistence (how long they will remain), we assess the contribution of different PA categories to avoid habitat loss. We use deforestation inside IPs and SUs and on their vicinities to assess resilience and consider only the portion of PAs covered by natural vegetation as effectively protected. We specifically address the following questions: (1) Can PAs ensure Cerrado persistence? (2) How IPs and SUs compare in preventing habitat loss in Cerrado? (3) How efficient are IPs and SUs for the maintenance of Cerrado tree cover?
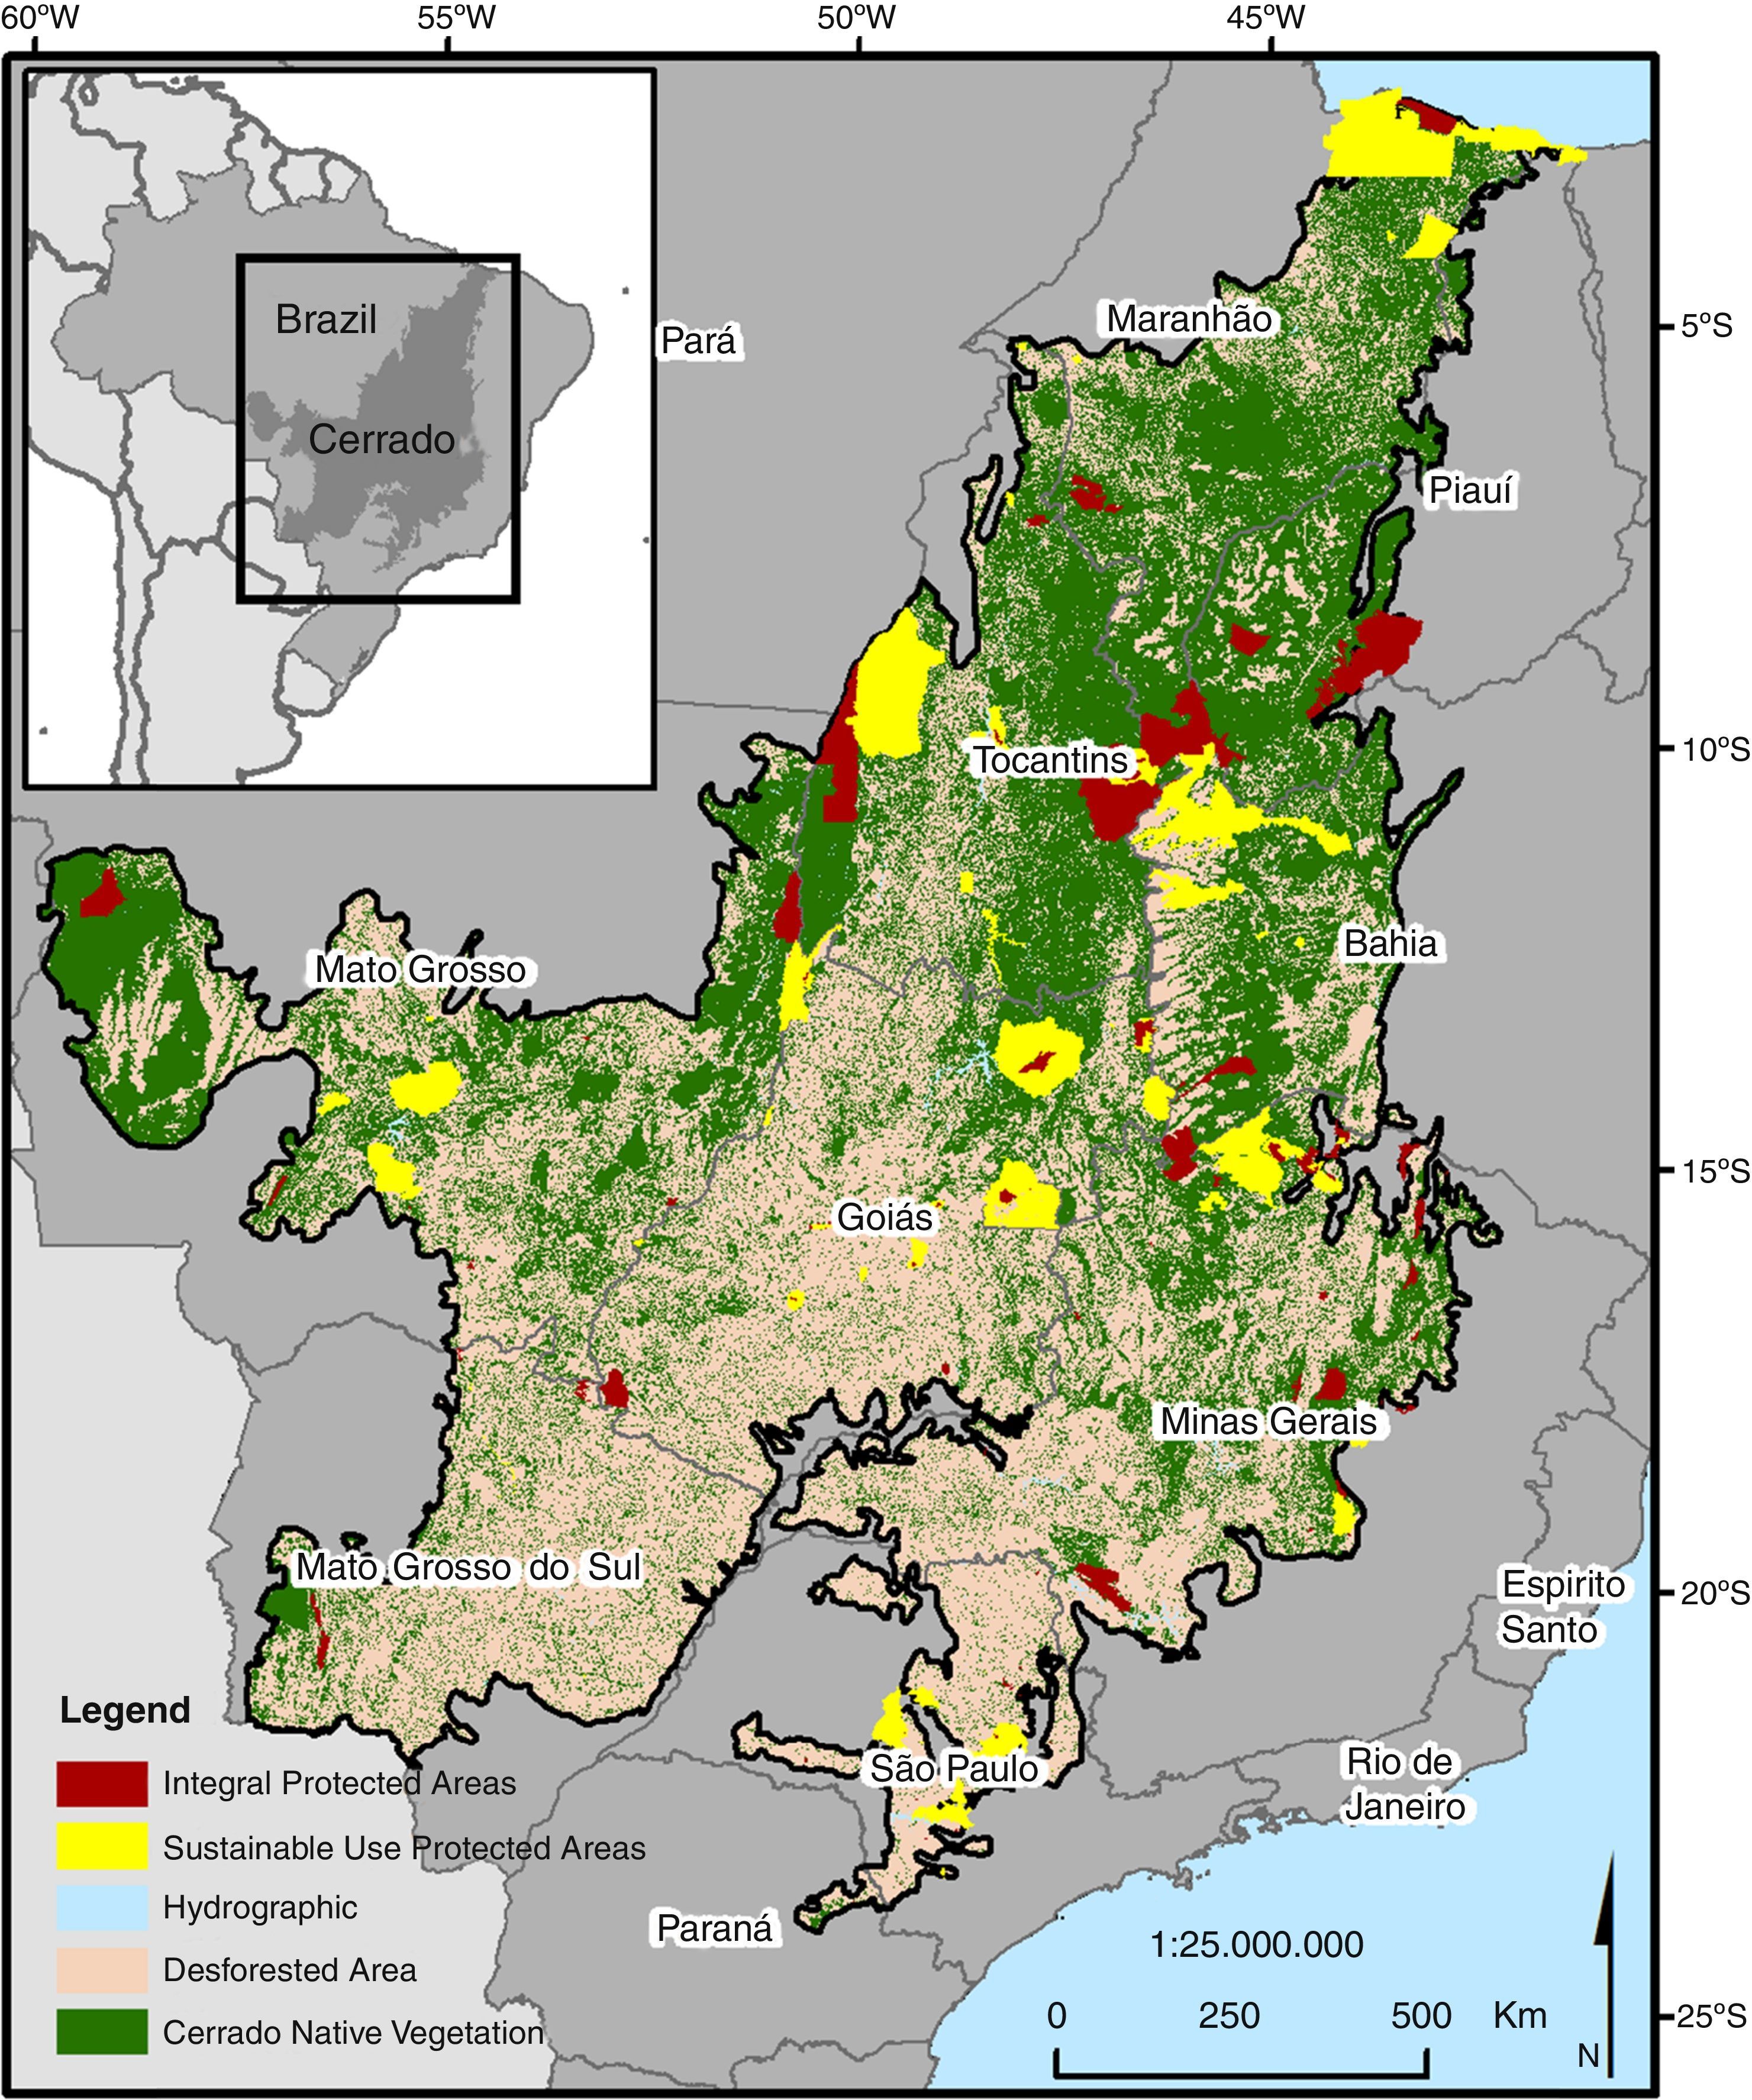
Material and methodsWe obtained data of all PAs in the Brazilian Cerrado, except of RPPNs (available at http://www.ibama.gov.br/zoneamento-ambiental/ucs/), and clipped their limits according to official boundaries of Cerrado. We used Cerrado remnant shapefiles from Landsat and CBERS image classification, identifying patches larger than 2ha, and cropped shapefiles of Brazilian PAs using the Cerrado boundaries.
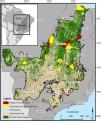
We recorded the presence of Cerrado remnants inside PAs (IPs and SUs) and in a 10km buffer surrounding them (Fig. 1). When PAs overlapped, we considered the amount of deforested area of the most restrictive category, because in these cases Brazilian law considers that standards applied to more restrictive PAs should be maintained (Brasil, 2000). We obtained the total area, total remnant area and total deforested area for 2008 using the Patch Analyst for ArcGis 9.3. Next, we calculated the proportion of total remnants and total deforested areas and arcsine-transformed all values prior to analyses.
We assessed the effects of use (IPs or SUs), jurisdiction (state, federal or municipal), and expropriation (yes or no) upon total deforestation inside and in the 10km buffer, using factorial ANOVA and Tukey HSD tests. Some PA categories are expropriated after their creation (REBIO, ESEC, PARNA, FLONA, RESEX, and RDS). We assessed differences in percent deforestation inside and outside (10km buffer) different PA categories with Wilcoxon tests. We report means±1 standard deviation and used the significance level of 5% for hypothesis testing.
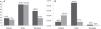
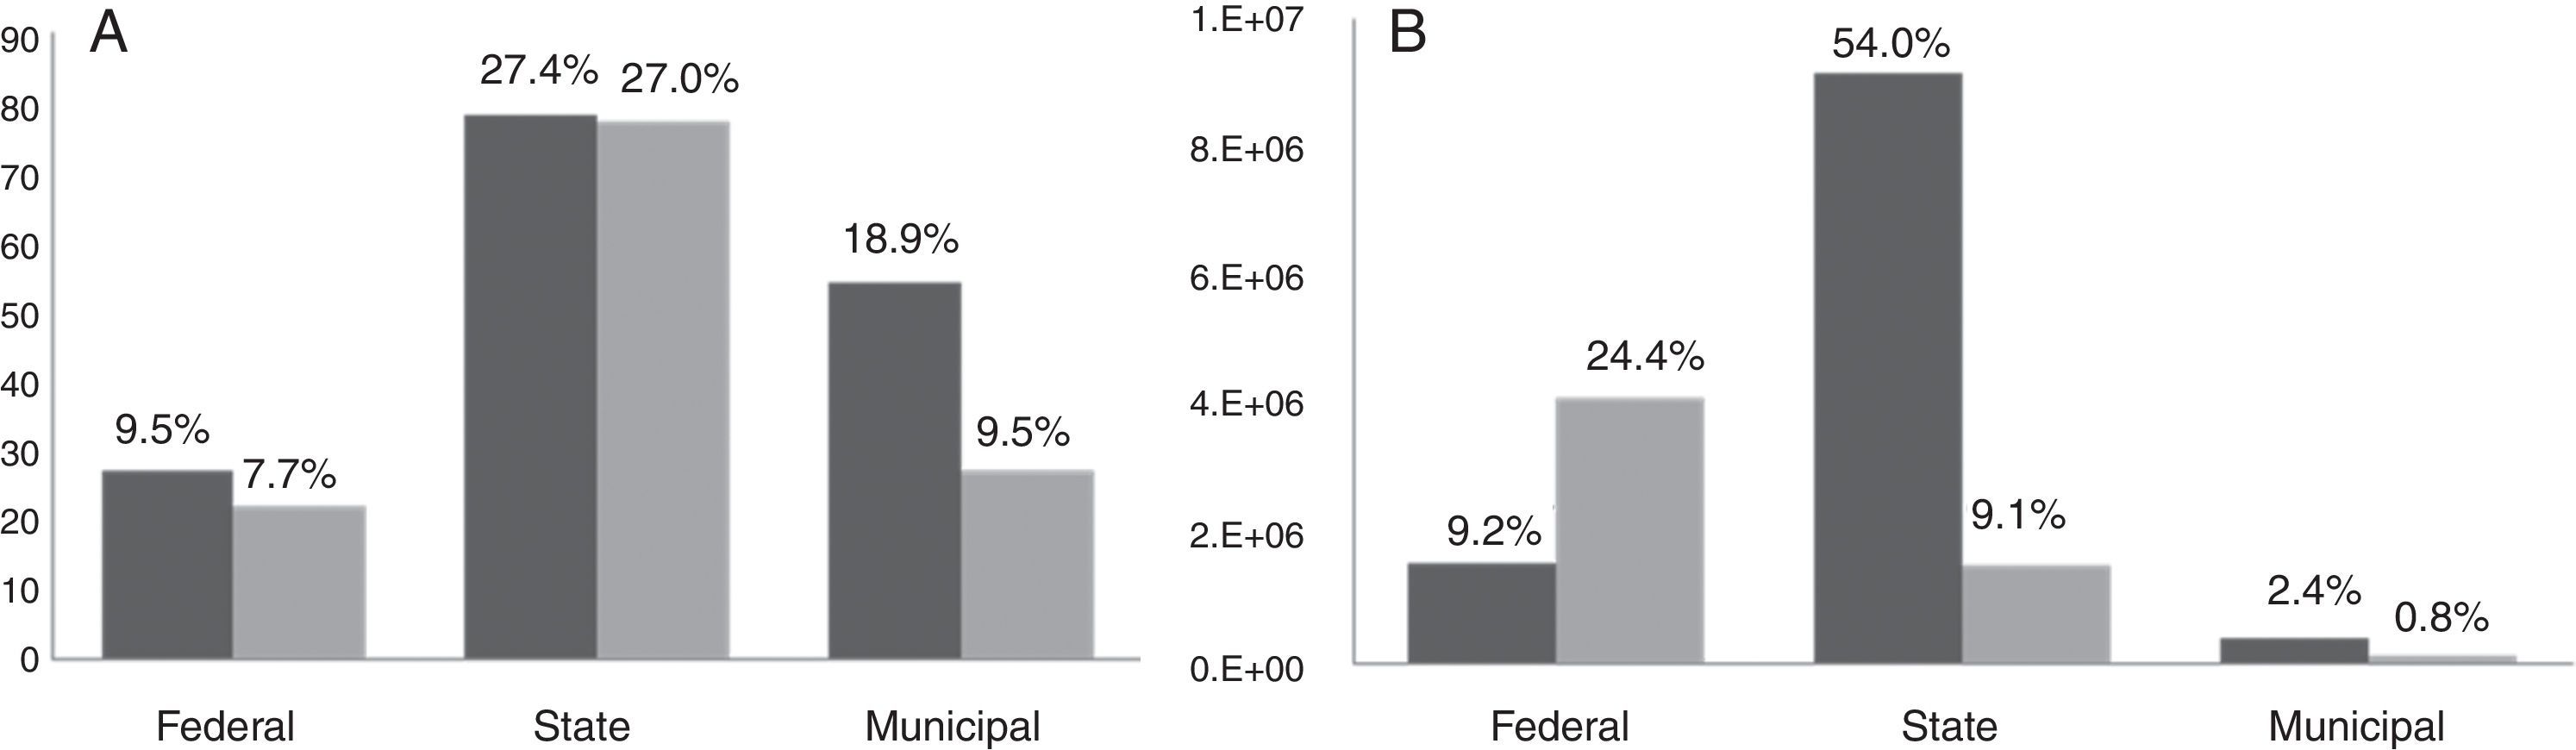
ResultsThere are currently 285 protected areas in the Brazilian Cerrado (Table 1), comprising 155 state, 81 municipal and 49 federal reserves, covering 9.6% of the region. Nevertheless, after accounting for overlapping areas, they only represent 8.3% of the Cerrado. Considering only the fraction covered by native vegetation, this drops to 6.5% (Table 1). State PAs are more numerous, considering both IPs and SUs (Fig. 2A), and correspond to 54% of the total PA in the region (Fig. 2B). Municipal PAs, albeit more numerous than federal PAs, correspond to only 3.2% of the Cerrado total PA. Despite being less numerous, federal PAs protect most of the Cerrado in IPs.
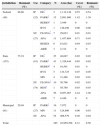
Number, size, and percentage of natural cover for each category of protected area in the Cerrado, according to jurisdiction and use.
| Jurisdiction | Remnant (%) | Use | Category | N | Area (ha) | Cover (%) | Remnant (%) |
|---|---|---|---|---|---|---|---|
| Federal | 88.60 | IP | EE* | 5 | 1,112,149 | 0.55 | 0.54 |
| (49) | (22) | PARK* | 15 | 2,891,980 | 1.42 | 1.39 | |
| REBIO* | 1 | 3,449 | 0 | 0 | |||
| RVS | 1 | 128,049 | 0.06 | 0.06 | |||
| SU | FLONA* | 7 | 29,023 | 0.01 | 0.01 | ||
| (27) | APA | 11 | 1,457,864 | 0.71 | 0.45 | ||
| RESEX | 6 | 81,621 | 0.04 | 0.03 | |||
| ARIE | 3 | 2,312 | 0 | 0 | |||
| State | 75.19 | IP | EE* | 25 | 48,687 | 0.02 | 0.02 |
| (155) | (81) | PARK* | 43 | 1,326,444 | 0.65 | 0.62 | |
| REBIO* | 4 | 10,501 | 0.01 | 0 | |||
| RVS | 5 | 134,725 | 0.07 | 0.05 | |||
| MN | 4 | 31,468 | 0.02 | 0.01 | |||
| SU | FLONA* | 10 | 30,766 | 0.02 | 0.01 | ||
| (74) | RDS* | 1 | 58,780 | 0.03 | 0.03 | ||
| APA | 56 | 9,057,087 | 4.44 | 3.20 | |||
| ARIE | 7 | 4,446 | 0 | 0 | |||
| Municipal | 29.94 | IP | PARK* | 16 | 7,972 | 0 | 0 |
| (81) | (27) | MN | 11 | 124,806 | 0.06 | 0.03 | |
| SU | APA | 54 | 408,579 | 0.20 | 0.04 | ||
| Total | 285 | 16,950,708 | 8.31 | 6.50 | |||
Remnant (%)=percentage of area not affected by deforestation; Cover (%)=percentage of Cerrado biome covered by each category; IP=integral protection; SU=sustainable use; EE=ecological station; REBIO=biological reserve; RVS=wildlife refuge; FLONA=national forest; APA=environmental protected area; RESEX=extractive reserve; ARIE=area of relevant ecological interest; MN=natural monument; RDS=sustainable development reserve.
Deforestation within PAs varied significantly with use, jurisdiction, as well as the interaction between jurisdiction and expropriation (Table S1). Deforestation was significantly lower inside IPs in relation to SUs (Table S2 and Table 2, Tukey HSD test, p<0.001). Federal PAs were significantly less deforested than state or municipal PAs (Table S2 and Table 2, p=0.004 and p<0.001, respectively). Nevertheless, differences in deforestation inside PAs according to jurisdiction were dependent on expropriation: federal expropriated PAs had significantly less deforestation than either state expropriated (p<0.001), municipal expropriated (p=0.013), or municipal non-expropriated (p<0.001) PA (Table S2). None of the other pairwise comparisons were significant.
Number and deforestation (mean and standard deviation) inside and in 10km buffer outside protected areas of Cerrado according to use, jurisdiction and expropriation.
| N | Inside (%) | Outside (%) | |
|---|---|---|---|
| Use | |||
| IPs | 130 | 25.15±31.02 | 57.24±29.16 |
| SUs | 155 | 46.46±32.04 | 55.67±28.92 |
| Jurisdiction | |||
| State | 155 | 35.68±33.64 | 58.17±31.30 |
| Federal | 49 | 22.58±30.82 | 43.69±28.49 |
| Municipal | 81 | 47.32±30.46 | 60.64±21.88 |
| Expropriation | |||
| Yes | 133 | 28.78±35.50 | 59.27±29.90 |
| No | 152 | 43.70±29.57 | 53.86±28.02 |
IPs=integral protection areas; SUs=sustainable use areas.
Deforestation in the 10km buffer varied significantly with jurisdiction, expropriation, as well as the interaction between jurisdiction and use (Table S2). Deforestation was significantly higher around expropriated than non-expropriated PAs (Table 2; Table S2 p<0.001). Deforestation was significantly lower around federal than either state or municipal PAs (p=0.006 and p=0.004, respectively; Table S2; Table 2). Nevertheless, differences in deforestation around PAs according to jurisdiction were dependent on use: deforestation around federal PIs was significantly lower than around state or municipal PIs, state or municipal SUs, and federal SUs (p<0.04 in all cases, Table S2). None of the other pairwise comparisons were significant.
Comparing the deforestation inside and outside PAs, we also observed lower deforestation inside federal parks and EE and state parks. All other categories of PAs showed non-significant differences between inside and outside deforestation (Table S3).
DiscussionProtected areas (PAs) are only effective if any deep ecological changes or habitat loss can be detected and prevented (Ahrends et al., 2010), enabling the integrity and maintenance of their communities, populations and endangered species (Parrish et al., 2003). As expected, Cerrado IPs without human settlements within their boundaries are less deforested than SUs (Carranza et al., 2013). This is an obvious result, since most human activities include the use of fire and deforestation. Moreover, only expropriated IPs presented less deforestation within than outside their boundaries. Although federal PAs are more efficient for biodiversity protection, they are notoriously less numerous than state and municipal PAs. On the other hand, federal PAs are larger than municipal PAs, but smaller than state PAs.
Among all PA, there was no difference in deforestation inside and outside SUs, highlighting their ineffectiveness against deforestation. In the Cerrado, 85% of all PAs corresponds to APA (federal, state and municipal). Although APAs are generally larger than other more restrictive PAs, they are ineffective in preventing deforestation. PAs that fall into IUCN Category VI (e.g., APA and ARIE) have low social, political and economic costs, since there is no expropriation and restrictions on land use are very few. These PAs are often created close to or even within urban areas; thus, it is not surprising that the APA category is the most numerous in all jurisdictions. State governments are responsible for 60% of PAs in the Cerrado, but their investment in conservation is far from the ideal. As of 2005, only 16.5% of the state PAs were IPs (Rylands and Brandon, 2005); nowadays, this proportion has decreased to 14.4%.
Biodiversity conservation is a secondary aim for SUs (Rylands and Brandon, 2005). Indeed, IUCN categories V and VI (most SUs in Brazil, including RESEX, RDS, FLONA and APA/ARIE) should not be considered PAs, since they were not designed strictly with the goal of protecting biodiversity (Locke and Dearden, 2005). These categories are, in fact, more close to the social agenda, aiming to secure land for different human groups (as indigenous lands and territories for the descendants of slaves). Although these categories are relevant for achieving some social demands, they must be conducted by social or agricultural governmental institutions, as proposed in the past by the Brazilian government for ecological land settlements. Indeed, this bias represents more financial and political costs for the challenge for biodiversity conservation. For instance, APAs were initially adopted in Brazil as an strategy for land use planning in buffer areas surrounding other PAs (Rylands and Brandon, 2005).
Government states that more than 9% of the Cerrado is in PAs, distributed in all jurisdictions and categories. Nevertheless, our results indicate that only 6% correspond to Cerrado remnants in PAs. The other 3% correspond to deforested areas within different PAs (mainly APAs). Official Brazilian reports to CBD include all PAs, even those that are ineffective against deforestation, as contributing for CBD objectives. Thus, considering the effectiveness of different PA categories, only IPs should be included when computing efforts toward the current 17% target from CDB. This scenario could even worsen, since some sectors of the Brazilian government are actually planning to include all remnants with any kind of legal protection, such as Indigenous Reserves (destined for the maintenance of the indigenous needs), legal reserves (small fraction of private lands for sustainable use) and areas of permanent protection (as springs, riparian vegetation, sand dune vegetation, and flooded areas, that are protected due to social interests) in the counting for the CDB target (see https://www.cbd.int/nbsap/targets/default.shtml). Moreover, some Cerrado IPs are under threat of reduction.
According to our results, there is no dispute whether more restrictive management PAs without human occupation (Integral Protection) are most effective for biodiversity conservation. Still, these categories are clearly losing ground for PAs that allow many forms of human use. Although some authors agree that people can promote environment protection by the sustainable use of biodiversity (Adams, 2005), especially when users of natural resources are involved in the decision process (Ostrom and Nagendra, 2006), the human presence in PAs increases deforestation and fire rates, promoting habitat loss (Nepstad et al., 2006). Thus, conservation policies must build upon arguments that have an ecological basis (Peterson et al., 2005).
It is estimated that 15–29% of Earth will be protected in 2030, but most PAs will be designed for human use (McDonald and Boucher, 2011), with varying degrees of biodiversity loss. This stems from ideological and political issues, coupled with personal interests of public managers, politicians, and decision makers. PAs designed for sustainable use are less politically wearing, but most have high costs associated with biodiversity loss and associated environmental services, which ultimately lead to the impoverishment of local communities (Andam et al., 2010).
We argue that the creation of PAs that are inefficient in protecting the biodiversity of high priority areas is nonsensical. As PAs are the cornerstone of all strategies for biodiversity conservation, investing on the selection, design and management of these areas only makes sense if there is a reasonable chance they will continue to provide biodiversity protection and ecological services in the future (Leverington et al., 2010).
Although protected areas are the most important framework for biodiversity conservation (Margules et al., 2002), it is evident that the efforts of the Brazilian government toward Cerrado conservation are far from ideal. The creation of new federal IPs is necessary, since they are more effective at preventing deforestation (Carranza et al., 2013), even considering actual threats.
About 15% of the Brazilian territory is under some kind of protection (McDonald and Boucher, 2011). However, PAs are very unevenly distributed across different biomes (Barr et al., 2011). This could reflect differences in previous CBD targets (30% for Amazonia, and 10% for other biomes), but the Brazilian Amazonia is not a conservation hotspot (Myers et al., 2000). There is a large imbalance in protection efforts between Brazilian biomes, with the Cerrado being one of the least protected (Barr et al., 2011). However, Brazil has the global responsibility to protect its hotspots, i.e., the Atlantic Forest and the Cerrado (Rylands and Brandon, 2005), especially because both are almost entirely restricted to the Brazilian territory.
Our findings indicate that investment in the creation of PAs in Cerrado must be directed mainly toward federal IPs, especially those requiring expropriation, as parks, REBIOs and EEs. National parks also promote ecological tourism, thus benefiting local communities and society, and are often large, contributing more effectively for the Cerrado conservation.
Conflicts of interestThe authors declare no conflicts of interest.
GRC thanks CAPES, CNPq and FAPDF for financial support. RBM was supported by a research grant from CNPq.
The following are the supplementary data to this article: