


Species with high mobility may have low genetic differentiation among populations due to historical long-distance dispersal, but recent studies show that bat dispersal may be affected by habitat loss and fragmentation. Here, we analyze the effects of landscape contemporary changes and dynamics in paleodistribution during the Quaternary on genetic diversity and differentiation in the Pallas’ long-tongued bat, Glossophaga soricina. We sampled 18 populations in landscapes with different land cover, and used nine microsatellite loci and the sequence of a fragment of the mitochondrial gene cytochrome b (CYB) to obtain genetic data. We performed ecological niche modelling and used general linear mixed models and optimization of multiple resistance surfaces to analyze how landscape structure and climatic suitability affect genetic diversity and differentiation. Our results show that the conversion of natural vegetation, such as forests and savannas, to agriculture, pastures or urban matrices (unsuitable habitats) decreases genetic diversity and increases inbreeding, but has no effect on genetic differentiation among populations, that was likely affected by spatial distance. Our findings point to the importance of maintenance of large areas of natural vegetation remnants to conserve genetic diversity of G. soricina, an important bat pollinator in the Neotropics.
Animal mobility and dispersal may be affected by habitat loss and fragmentation (e.g. Umetsu et al., 2008; Puttker et al., 2011), and there is evidence of deleterious effects of habitat fragmentation on genetic variability and differentiation on common and widespread vertebrate species with high mobility (Johansson et al., 2007; Delaney et al., 2010; Levy et al., 2019). Landscape structure, such as matrix quality and distance among habitats, may isolate populations, limiting their dispersal (Umetsu et al., 2008; Boscolo and Metzger, 2011) and thus, population connectivity and genetic diversity (e.g. Dixo et al., 2009; Balkenhol et al., 2013; Jackson and Fahrig, 2016).
Moreover, climate changes during the Quaternary might also have affected species genetic diversity due to the cycles of population expansion and contraction (Hewitt, 2000). Population range contraction may decrease effective population size, leading to loss of genetic diversity due to genetic drift. Shifts in species geographical distributions due to the Quaternary climate changes have played an important role in shaping the genetic diversity of animal species in the Cerrado biome (e.g. Miranda et al., 2019). Thus, disentangling contemporary and historical processes leading to population effective size reduction and loss of genetic diversity is important to predict species response to changes in landscape in the Anthropocene.
Bat species are differentially affected by habitat fragmentation (e.g. Gorresen and Willig, 2004; Meyer et al., 2009; Centeno-Cuadros et al., 2017). Some bats avoid flying over open areas (Henry et al., 2007), watercourses (Albrecht et al., 2007), and roads (Zurcher et al., 2010). Thus, fragmentation has a potential to isolate bat populations and reduce genetic connectivity (Rossiter et al., 2000) and colonization of new areas (Kerth and Petit, 2005; Russell et al., 2005). In addition to the barriers imposed by the landscape, reproductive behavior and historical patterns of colonization may also be responsible for restricted gene flow (Wilmer et al., 1999). Although highly mobile, bats may show different dispersal patterns and breeding systems, including variation in roosting ecology, and social structures (McCracken and Wilkinson, 2000), that may affect genetic structure (e.g. Flanders et al., 2016). Indeed, several studies have shown significant population substructure in bat species at different spatial scales (e.g. Biollaz et al., 2010; Ripperger et al., 2013; Flanders et al., 2016).
Glossophaga soricina (Pallas 1766) (Glossophaginae), the Pallas’ long-tongued bat, is one of the most common and widespread nectarivorous bats in the Neotropics (Reis et al., 2005), and also feeds on insects and fruits (Willig et al., 1993), and uses a large variety of roosts (caves, trees, human-made structures). Adult males may defend harems and juveniles and both males and females disperse from their natal colony (Pink, 1996). Because of its geographical distribution and natural history, a low effect of habitat fragmentation on G. soricina genetic diversity may be expected or even no effect at all. However, more than half of the Cerrado biome has been rapidly transformed into pastures and crops (Silva et al., 2006), affecting species genetic diversity and inbreeding (e.g. Arruda et al., 2017) jeopardizing species long-term conservation.
Here, we address the effects of contemporary changes in landscape structure and paleodistribution during the Quaternary on genetic diversity and population differentiation in G. soricina in the Cerrado biome. We used a multi scale spatial approach to specifically test whether habitat amount (forests and savanna), matrix (unsuitable land covers) type and past climate changes explain the current genetic diversity and differentiation among populations. The genetic data were obtained from nuclear bi parentally inherited microsatellite loci and the maternally inherited mitochondrial cytochrome B gene (CYB). Thus, using data from markers with different inheritance and evolutionary rates our data may track differences in dispersal between male and female bats and also differences in time of response to Quaternary climate changes and current landscape changes. We expect to find significant relationships between landscape structure and genetic diversity and differentiation for microsatellite loci, but not for CYB. Conversely, we expect that CYB genetic parameters will be better explained by climatic changes and historical effective population size due to lower mutation rate.
Materials and methodsPopulations and tissues samplingWe sampled 18 populations (229 individuals) of G. soricina throughout the Brazilian Cerrado biome (Fig. 1, Table S1). Populations were selected in landscapes with different land use composition, such as habitat (savanna and forest) amount and matrix (unsuitable land cover) type. Bats were captured with mist nets installed at ground level and we sampled approximately 3 mm of the wing membrane (see details in Supplementary File S1).
 and the outer (black line) has 5 km radius. Land use categories are in legends. Other refers to mixing categories not detectable at the map scale. Land use map was obtained from the MMA (Brazilian Ministry of Environment) database http://mapas.mma.gov.br/mapas/aplic/probio/datadownload.htm.")
Geographical distribution of the 18 samples of Glossophaga soricina in the Brazilian Cerrado and sampling design for landscape analysis. Two circular buffers delimited each population. The inner buffer has 2 km radius (red line) and the outer (black line) has 5 km radius. Land use categories are in legends. Other refers to mixing categories not detectable at the map scale. Land use map was obtained from the MMA (Brazilian Ministry of Environment) database http://mapas.mma.gov.br/mapas/aplic/probio/datadownload.htm.
For genetic data, DNA was extracted and individuals were genotyped using nine microsatellite loci previously developed for G. soricina (Oprea et al., 2012). For sequencing, we used the primers described by Irwin et al. (1991) to amplify a 1140 bp fragment of the cytochrome-b mitochondrial gene (CYB). Details of the protocols for genotyping and sequencing are described in Supplementary File S1.
To obtain genetic parameters for microsatellite loci we estimated genetic diversity (heterozygosity expected under Hardy–Weinberg equilibrium, He), inbreeding coefficient (f) and allelic richness for each population. For population genetic differentiation we estimated Wright’s FST (Wright, 1951), G’ST (Hedrick, 2005) and Jost’s D (Jost, 2008) using PopGenReport package (Gruber and Adamack, 2019) implemented in R 3.6.1. (R Core team, 2019).
We used a Bayesian clustering method implemented in the software Structure 2.3.4 (Pritchard et al., 2000), to identify genetically homogeneous groups within our samples. We estimated a posteriori probability of K (number of groups) ranging from 1 to 18 (corresponding to each sampled locality).
For CYB, we estimated nucleotide (π) and haplotype (h) diversity for each population, and population differentiation (FST) using the software Arlequin 3.11 (Excoffier et al., 2005). Population structure was also assessed using Bayesian clustering implemented in the software BAPS v6.0 (Corander et al., 2008) with an upper limit of K = 18.
To understand the geographical distribution and phylogenetic relationships among mtDNA haplotypes, we inferred a haplotype network using the software NETWORK 4.6.1.6 (Forster et al., 2004). Details of genetic analyses are provided in Supplementary File S1.
Effective population size and connectivityBecause genetic diversity may be an effect of changes in effective population size we estimated historical and contemporary effective population sizes (Ne). Contemporary Ne was calculated for microsatellite loci for each population with Ne Estimator v. 2.01 (Do et al., 2014) using the molecular coancestry method (Nomura, 2008) to verify the effect of population size on genetic parameters.
We estimated historical Ne using coalescent analysis for both microsatellite loci and CYB. We estimated the mutation parameter theta (θ) and the number of immigrants per generation among all population pairs using Lamarc 2.1.10 software (Kuhner, 2006). Details are described in Supplementary File S1.
Ecological niche modelingWe obtained 13,069 occurrence records of G. soricina across the Neotropics (Fig. S1). After data filtering, the remaining 2353 occurrence records (Table S2) were mapped in a grid of cells of 2.5′ × 2.5′ (longitude × latitude), encompassing the Neotropics, to generate the matrix of presence used to calibrate the ENMs.
The climatic layers were represented by five bioclimatic variables: annual mean temperature, mean diurnal range, isothermality, precipitation of wettest quarter, and precipitation of driest quarter, selected by factorial analysis with Varimax rotation from 19 bioclimatic variables obtained in the ecoClimate database (Lima-Ribeiro et al., 2015). Bioclimatic variables were obtained for pre-industrial (representing current climate conditions), mid-Holocene (6 ka) and Last Glacial Maximum (LGM; 21 ka) from five Atmosphere-Ocean General Circulation Models (AOGCM) (Table S3).
Estimates of the current and past potential distribution of G. soricina were obtained by modeling its ecological niche using five algorithms (Table S4). The ENMs were then built on the current climatic scenario and projected onto the climatic conditions during both the mid-Holocene (6 ka) and LGM (21 ka). All ENM procedures were run in the integrated computational platform BIOENSEMBLES, which provides predictions based on the ensemble approach (Diniz-Filho et al., 2009).
For each algorithm and AOGCM, models were built using 75% of occurrences and tested against the remaining records (25%). Models with poor performance were eliminated (TSS < 0.7). The frequency of predicted presence was used as a measure of consensus suitability from 50 initial models.
Finally, the full ensemble was obtained for each time period using the predictive performances (TSS) to compute a weighted mean of suitabilities, from which historical refugia were mapped (i.e. all grid cells with suitability values ≥ 0.5 during the three time periods). Details are provided in Supplementary File S1.
Landscape and climatic effects on genetic diversityTo analyze the effect of landscape structure on genetic diversity we quantified landscape variables at node level (Wagner and Fortin, 2013). We drew landscape-buffers of 2.0 and 5.0 km radius around each sampled location (Fig. 1) using high-resolution images available at the map database of the Geographic Information System in ArcGis v.9.3 (ESRI®a). We chose these landscape-buffer sizes because of the home range of G. soricina (e.g. Aguiar et al., 2014).
In each landscape-buffer we classified the land cover and calculated the area and the percentage of each land cover type inside each buffer (Fig. 1, Table S5) using ArcGis v.9.3. We examined the correlation among land cover amounts and excluded those with Pearson’s correlation ≥ 0.5, to avoid collinearity. We kept percentage of natural vegetation remnants (forests and savanna), representing habitat amount, and for matrix we used matrix type (pasture, agriculture, urban area, water body, mining and outcrops and mixed use).
We used Generalized Linear Mixed Model (GLMM) to analyze the effects of landscape structure and paleodistribution on genetic parameters. We used as explanatory variables matrix type and percentage of natural vegetation remnants, suitability at present day derived from ENM and climatic stability. We also used historical (based on coalescence) and contemporary (based on coancestry) Ne in each locality as explanatory variables.
We built several models with combinations of explanatory variables and a null model. Analyses were carried out using the MCMCglmm package (Haldfield, 2019) implemented in R 3.6.1. (R Core team, 2019). To select which model best explains the observed variation in genetic parameters among landscapes we calculated AIC corrected for small samples (AICc) and ΔAICci, i.e. the difference between each model (i) and the best models (Burnham and Anderson, 2002). Details are provided in Supplementary File S1.
Landscape and climatic effects on genetic differentiationTo perform the analysis at the link level (Wagner and Fortin, 2013), we used ResistanceGA package (Peterman, 2018), implemented in R 3.6.1. to optimize multiple resistance surfaces simultaneously. For genetic distance matrix we used the genetic differentiation among all pairs of populations (Tables S6–S9): FST (for both microsatellites and CYB), and GST' and Jost' D for microsatellites. For resistance matrix we extracted the land cover between all pairs of populations and converted land use in resistance surface. We also used the consensus map of ENM at present-day for resistance due to climate, and the geographical distance matrix to account for isolation-by-distance. Optimization was performed with the function gdistance/commuteDistance. To select the most likely model, we used ΔAICci.
We also analyzed genetic discontinuity among populations using the Delaunay network (Legendre and Legendre, 1998) implemented in the software SAM v.4 (Rangel et al., 2010), for both microsatellites and CYB. Details are provided in Supplementary File S1.
ResultsGenetic diversity and population differentiationPopulations had similar levels of genetic diversity and polymorphism (Table S10) despite the differences in sample size. The inbreeding coefficients were significantly different from zero for most populations (Table S10). Most pairs of populations had low values of pairwise FST (Table S6), pairwise Jost’s D and pairwise G’ST (Tables S7 and S9); the only exception was population 18, which showed high and significant values for all comparisons. Details of results are provided in Supplementary File S1.
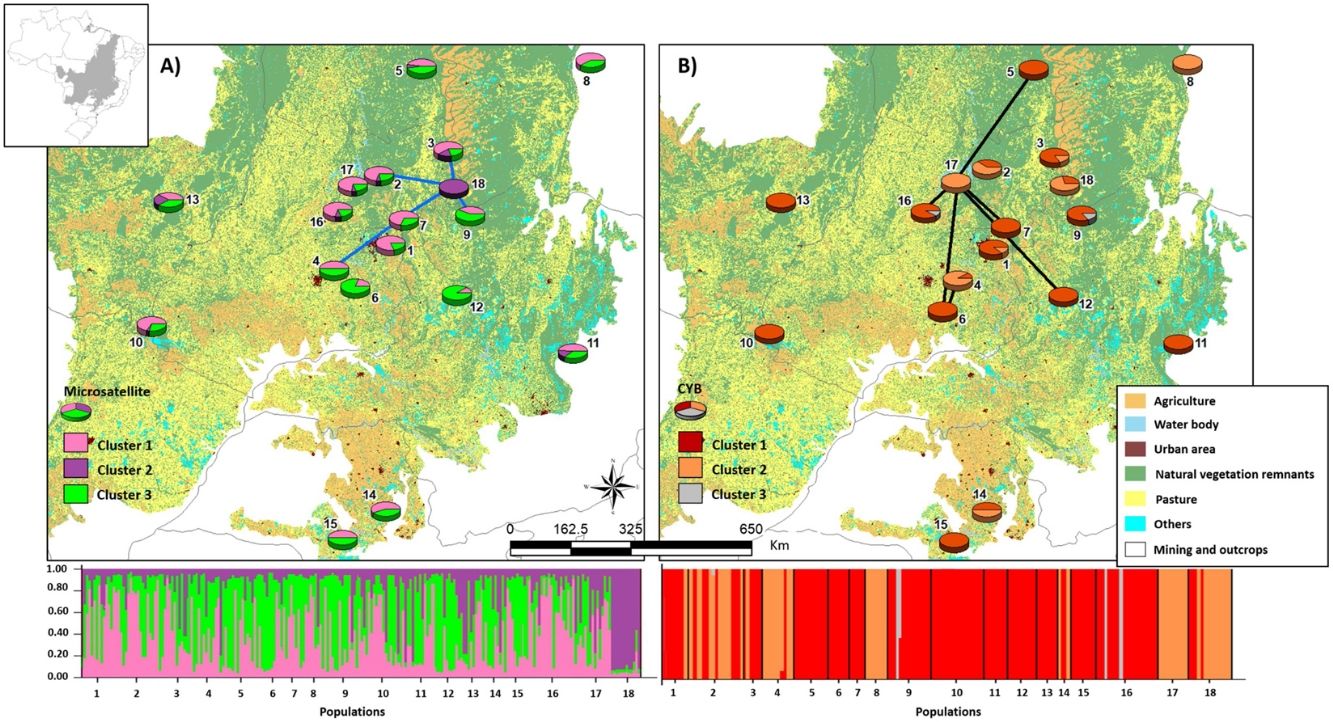
Bayesian clustering based on microsatellite loci showed that three clusters (K = 3, Fig. S2, Table S11) were most likely. Cluster 1 (green, Fig. 2) comprised most populations. Cluster 2 (yellow, Fig. 2) comprised mainly population 18. Populations from Southeast Brazil (14 and 15, Fig. 2) were equally assigned to clusters 1 and 3.
 database http://mapas.mma.gov.br/mapas/aplic/probio/datadownload.htm.")
Bayesian clustering for microsatellite loci and CYB of 18 Glossophaga soricina populations in Brazilian Cerrado. The black full lines indicate possible genetic discontinuity between localities based on Delaunay’s triangulation for microsatellite loci and green for CYB. Different colors were assigned for each cluster according to the figure legend. The circle sections represent the cluster frequency in each sampled population. See Table S1 for population code and locality. Land use map was obtained from the MMA (Brazilian Ministry of Environment) database http://mapas.mma.gov.br/mapas/aplic/probio/datadownload.htm.
We found 171 different CYB haplotypes for the 229 individuals of G. soricina (Table S12). All populations showed high haplotype and nucleotide diversities and most haplotypes were exclusive to one population (Tables S101, S12, Fig. S3). Haplotypes from population 18 (H158, Fig. S3), 1 (H01) and 14 (H117) were the most differentiated and were exclusive to these populations (Fig. S3, Table S12).
Populations showed high pairwise FST (Table S9). Bayesian clustering showed an optimal partition of K = 3 clusters (Fig. 2, Table S13), but with no clear geographical pattern.
Contemporary and historical effective population sizes were low for all populations (Table S10). Overall, the number of migrants per generation was high (Nem > 1.0) between all pairs of populations (Table S14) for both microsatellites and CYB.
Ecological niche modelingGlossophaga soricina showed a clear preference for hot climate across the Neotropics (Fig. 3) with high frequency of occurrence in savannas, seasonally dry and rain forests of the Neotropics. Such climate space was equally available at the LGM, mid-Holocene and present day (Fig. 3, Figs. S4, S5, Table S15), and thus ENMs predicted only a slight difference in G. soricina potential distribution through time, with a slightly larger range size at the LGM (Fig. 3, Fig. S5) compared to both the mid-Holocene and present-day. In addition, a wide region across eastern, northeastern Brazil, towards central-west Amazonia and northern South America and western MesoAmerica probably acted as historical refugia maintaining populations of G. soricina during the climate changes throughout the last glaciation cycle (Fig. 3). ENMs also showed a range shift in geographical distribution towards the southeast Brazil, especially from the LGM to the mid-Holocene (Fig. 3, Fig. S5). From the mid-Holocene to present-day, ENM showed quasi-stability in G. soricina geographical range (Fig. 3, Fig. S5). See details in Supplementary File S1.
, mid-Holocene (6 ka), present-day and the historical climatic refugium through time (from the LGM to present-day). Red dots are the 18 populations sampled.")
Maps of consensus of the 75 models of the potential distribution of Glossophaga soricina, based on ecological niche modelling during the LGM (21ka), mid-Holocene (6 ka), present-day and the historical climatic refugium through time (from the LGM to present-day). Red dots are the 18 populations sampled.
Overall, models including matrix type explained better the variation in genetic parameters for microsatellite loci (Figs. 4A, S6A, Table S16) and CYB (Fig. 4B, Fig. S6B, Table S16) at both spatial scales. Although models with effective population size (Ne) and matrix type had significant coefficients for k and h (Table S16), they were less likely than models comprising only matrix type (Figs. 4 and S6). Models including climatic suitability or percentage of natural vegetation remnants were less likely than models with matrix type (Table S16).
 and the model coefficients (β) for (A) microsatellite loci, (B) CYB. Error bar represents standard error (see Table S16 for p values). See Fig. S6 for 5 km spatial scale. He, genetic diversity; f, inbreeding coefficient; AR, allelic richness; k, number of haplotypes; h, haplotype diversity; π, nucleotide diversity.")
Model averaging results for each genetic parameter based on the genotyping of microsatellite loci and sequencing of CYB for 18 Glossophaga soricina in Brazilian Cerrado for 2 km spatial scale. Panels show the relative importance of each variable based on wAICc (Akaike’s weight of evidence) and the model coefficients (β) for (A) microsatellite loci, (B) CYB. Error bar represents standard error (see Table S16 for p values). See Fig. S6 for 5 km spatial scale. He, genetic diversity; f, inbreeding coefficient; AR, allelic richness; k, number of haplotypes; h, haplotype diversity; π, nucleotide diversity.
Genetic differentiation among populations was not explained by landscape or climatic resistance to G. soricina dispersal (Table S17, Figs. S7–S10). The null model was the best model for both CYB and microsatellites, however geographic distance could not be rejected as a factor explaining the variation in genetic differentiation among populations for microsatellites (Table S17).
We found discontinuity between pairs of populations, i.e. higher FST than expected by the spatial distance between pairs of populations. For microsatellite loci population 18 was the most differentiated. We found evidence for discontinuity between five pairs of populations: 4–7, 2–18, 3–18, 7–18, and 9–18 (Fig. 2, Table S17). For CYB, population 17 was the most divergent. We found discontinuity between 4–6, 5–17, 6–17, 7–17, 12–17 and 16–17 (Fig. 2, Table S18).
DiscussionContemporary changes in landscape and genetic diversityOur findings show that contemporary changes in landscape affects genetic diversity in populations of Glossophaga soricina from the Cerrrado biome. The replacement of natural vegetation, such as forests and savannas, to agriculture, pastures or urban areas may decrease genetic diversity and increase inbreeding. The influence occurs at both spatial scales analyzed here (2 and 5 km buffers).
The effects of scale on the relationships between landscape structure and bat occurrence, abundance and population genetic structure have been reported previously (e.g. Gorresen et al., 2005; Razgour et al., 2014). The lack of scale effect in our study may be due to G. soricina’s dispersal ability and its foraging and mating behavior. The home range of the species is larger than 2 km, and the maximum flight distance tracked so far was 3.8 km (Aguiar et al., 2014). However, G. soricina makes colonies and harems defended by adult males, which may constraint dispersal and cause the high inbreeding observed. In addition, the dispersal constrain due to mating behavior may also isolate colonies of G. soricina, explaining the effect of matrix type on inbreeding. Smaller bats, such as G. soricina, may be more affected by landscape changes independent of the geographical distribution. For instance, genetic diversity and gene flow in Carollia castanea, a small widely distributed bat species, are negatively affected by loss of habitat (forests) whereas the larger Artibeus jamaicencis is not affected by percentage of forest and matrix (Cleary et al., 2017). Likewise, Carollia perspicillata show loss of genetic diversity due to habitat fragmentation, contrasting to Uroderma bilobatum, a larger more vagile species (Meyer et al., 2009).
Mating behavior and philopatry may affect population structure in bats and increase relatedness within populations and inbreeding (Biollaz et al., 2010; Ripperger et al., 2013; Flanders et al., 2016). Our findings show higher genetic differentiation for mitochondrial CYB than for nuclear microsatellites, which may be evidence of female philopatry, i.e., males disperse more frequently than females. However, it is important to note that the mitochondrial genome (mtDNA) is maternally inherited without recombination and the effective population size of mtDNA is smaller than that of the nuclear genome, thereby leading to a higher rate of allele fixation by genetic drift for mtDNA than for nuclear DNA (Birky et al., 1983). Effective population size may be one of the most important factors influencing rates of molecular evolution (Lanfear et al., 2014). Thus, differences between microsatellite loci and CYB may be due to differences in dispersal behavior but also in evolutionary rates. Moreover, genetic differentiation at microsatellite loci and CYB showed different responses to geographical distance. CYB showed no effect of spatial distance likely because males disperse more frequently than females.
Here we found no effect of land cover in genetic differentiation at both CYB and microsatellite loci. However, we found discontinuity in several pairs of populations, meaning that some pairs of populations have higher FST than expected by their geographical distance. The genetic discontinuity may be due to the recent fragmentation and anthropogenic disturbance because populations showing genetic discontinuity for microsatellite loci are imbedded in urban areas, agriculture or pasture that may affect the dispersal of G. soricina among localities, restricting gene flow and increasing inbreeding. For instance, population 18 is within a conservation unit, which has pristine vegetation and a wide variation in food resources, surrounded by extensive agriculture areas (mainly soybean and corn). The region presents high number of well-preserved caves, which are used as roosts by the species. All these characteristics may favor bats staying within the conservation unit, decreasing the connectivity of this population (18) even with populations at close distance, such as populations 2, 3 and 9 (see Fig. 2), leading to a genetic boundary. In fact, larger and more stable caves and surrounded by natural vegetation can have more bat species and larger populations (e.g. Barros et al., 2020). Population 9 is also within a conservation unit, however, with extensive areas of savanna and no caves, which may favor G. soricina dispersal, decreasing discontinuity. Population 17 is surrounded by crops and mining industry, which may isolate the G. soricina population.
In addition, CYB showed different patterns of discontinuity and Bayesian clustering compared to microsatellite loci. For instance, population 18 showed high connectivity with other populations and no genetic discontinuity for CYB. On the other hand, population 17 had high differentiation and discontinuity for CYB, but not for microsatellites. This result may be due to different dispersal pattern between males and females or due to differences in evolutionary rates. Microsatellites may show signals of current landscape changes while CYB may show the effects of historical connectivity and paleodistribution (see below). Indeed, bats may show male-biased dispersal that can be highly affected by landscape changes and habitat loss, leading to loss of genetic diversity (Halczok et al., 2018).
Despite the high level of fragmentation and anthropogenic disturbances in the Brazilian Cerrado, the studied populations of G. soricina presented relatively high genetic diversity at both microsatellite loci and CYB, similar to the levels of other Phyllostomidae bats such as Lophostoma silviculum (He = 0.490; Dechmann et al., 2002), Carollia brevicauda (He ranging from 0.430 to 0.940; Bardeleben et al., 2007) and Dermanura watsoni (h ranging from 0.902 to 0.991, and number of haplotypes ranging from 11 to 21; Ripperger et al., 2013). Our results also show low but significant differentiation for microsatellite loci (FST = 0.056, P < 0.0001) among populations of G. soricina in the Brazilian Cerrado, similar to other bat species, such as Plecotus auritus (FST ranging from 0.011 to 0.026; Burland and Wilmer, 2001) and Nyctalus azoreum (FST ranging from 0.009 to 0.036; Salgueiro et al., 2008;). The low genetic differentiation among populations may be the outcome of historical long-distance dispersal. In fact, Bayesian clustering showed three genetic groups indicating weak genetic structure among sites with high levels of gene flow. The only exception was population 18, which showed high and significant values of pairwise FST for all comparisons.
Paleodistribution dynamics affected genetic boundaries between populationsWe found no evidence that paleodistribution changes during the Quaternary significantly affected the genetic parameters analyzed. The lack of significant effect may be due to the quasi stability of G. soricina’s geographical range since the LGM. In fact, our findings show a slightly larger geographical range during the LGM than at the mid-Holocene or present-day, showing that G. soricina may have expanded its distribution during the glacial periods of the Quaternary, when seasonally dry forests and opened vegetation expanded their distributions (Pennington et al., 2000).
Nevertheless, the large areas of high suitability through the Quaternary may have been historical climatic refugia, maintaining populations through time. The historical refugia provided a source of migrants to colonize new suitable areas while the species was tracking climatic niche. ENM showed that several populations of G. soricina in Central Brazil were outside the climatic refugia (see Fig. 3) from the LGM to present-day, explaining the genetic discontinuity at CYB between some populations, such as population 17. On the other hand, some populations were connected in the past, such as population 18, and contemporary landscape changes may have isolated populations leading to low connectivity and genetic discontinuity at microsatellite loci. Thus, the genetic boundaries among populations may be due to both, the paleodistribution dynamics in the Quaternary, and the contemporary landscape changes.
Concluding remarksOur findings show loss of genetic diversity in populations of G. soricina in the Brazilian Cerrado due to contemporary changes in landscape, despite the high dispersal ability. Our results also show isolation of populations surrounded by pasture, agriculture or urban area, increasing inbreeding. Less distance among natural vegetation remnants may also increase population connectivity, decreasing genetic differentiation. Although paleodistribution did not explain variation in genetic diversity and differentiation among populations, historical refugia may explain the patterns of genetic boundaries between pairs of populations.
Our findings highlight the effects of habitat loss and spatial distance among remnants in genetic diversity and differentiation of highly mobile and widely distributed species, such as the Pallas’ long-tongued bat, highlighting the harmful effects of habitat loss for bat species and genetic diversity (e.g. Meyer et al., 2009; Muylaert et al., 2016; Cleary et al., 2017) Ecological interactions may also be affected in the way fragmentation affects G. soricina since ecological processes, such as pollination and seed dispersal may also be affected, modifying ecosystem dynamics and regeneration.
Moreover, our results suggest that conservation planning for G. soricina may be based on the local pattern of landscape structure, protecting natural vegetation remnants to increase population genetic diversity and connectivity.
Author contributionsRGC and MO conceived the work. RGC and MPCT funded the work. MO obtained the data. RGC, LCV and TBV carried out analyses. RGC wrote the original draft and all authors approved the final version.
DNA sequencesCYB sequence data are available at GenBank (https://www.ncbi.nlm.nih.gov/), access number from MN719187 to MN719369.
Conflict of interest statementThe authors declare that the research was conducted in the absence of any commercial or financial relationships that could be construed as a potential conflict of interest.
This work was supported by the project CNPq/FAPEG/AUX PESQ CH 007/2009 and CAPES/PROCAD (project no. 88881.068425/2014-01). M. Oprea received a CAPES fellowship. We thank AC Pavan, L Salles, L Geise, L Aguiar, MC Nascimento, KC Faria, W Uieda, A Pedrozo, TB Vieira and P Mendes for tissue samples, and Matheus S Lima-Ribeiro for helping with ecological niche modelling. RGC and MPCT have been continuously supported by CNPq and CAPES grants and fellowships, which we gratefully acknowledge. The authorization for sampling was granted by the Brazilian Institute for Environment (ICMBio/MMA number 20982-1). Current research is funded by the National Institute for Science and Technology (INCT) in Ecology, Evolution and Biodiversity Conservation (MCTIC/CNPq/FAPEG project no. 465610/2014-5).
The following are Supplementary data to this article:

