
Understanding the influence of local and regional factors that structure biological communities can be useful in environmental conservation. Our objective was to verify whether a fish metacommunity in the Brazilian Atlantic Forest has a nonrandom structure along the longitudinal stream gradient. To do so, we applied the elements of metacommunity structure to examine fish distribution patterns at the micro-basin extent for 20 stream fish assemblages. Stream fish species were independently distributed following the Gleasonian pattern. The Gleasonian pattern suggested that the communities varied continuously over space, potentially reflecting the degree to which species tolerances overlap. The metacommunity structure may have resulted from the environmental gradient and has a high beta diversity. The upstream reaches have higher values from regional variables (confluence distance and declivity) and slower values on variables representing a local scale (temperature, conductivity, depth, and width). Knowing the type of structure and the drivers that shape a metacommunity, we suggested that ensuring the connectivity of streams is a good conservation strategy as the species move from one to another, being very dependent on the colonization source. This environmental management can affect biodiversity at local and regional scales, thus we would require devoting local conservation efforts to a large number of different reaches of streams and in a micro-basin regional scale.
A central theme in community ecology is the relative importance of local and regional processes on the structuring of local biological communities (Ricklefs, 1987). Local processes, such as competition, predation, resource limitation, disturbance, and stochastic events, are known to influence local diversity. Regional processes, such as lifetime of the habitat, differences in speciation and immigration rates, and differences in extinction history (Ricklefs and Schluter, 1993), are more difficult to be incorporated into ecological studies. These processes act on a larger spatial and temporal scale. The metacommunity concept has been applied to understand the direct influence of local processes and indirect influence of regional processes in community structure (Ricklefs, 2008; Leibold et al., 2004; Holyoak et al., 2005). A metacommunity is considered a set of local communities that are linked by dispersal and that potentially interact with one another (Hanski and Gilpin, 1991; Wilson, 1992; Holyoak et al., 2005).
The elements of metacommunity structure (EMS) (Leibold and Mikkelson, 2002) constitute a pattern-based approach to examine the metacommunity. EMS identify which idealized metacommunity structure best reflects the species distribution along the latent gradient. The idealized patterns of species distribution include checkerboard, nestedness, evenly spaced, Gleasonian, Clementsian, and random distributions (Leibold and Mikkelson, 2002; Presley et al., 2010).
The checkerboard pattern occurs when pairs of species co-occurrence is less than expected by chance, demonstrating the existence of competitive exclusion (Stone and Roberts, 1990). The nestedness pattern is found if poor communities that occupy a smaller portion of the environmental gradient are subsets of those that occupy a larger portion of the gradient (Patterson and Atmar, 1986). If species distributions exhibits turnover along the environmental gradient, three patterns can be identified. Evenly spaced distributions occur if the boundaries are hyperdispersed, indicating maximal differences in environmental tolerances among species (Tilman, 1982). If the boundaries of the species distributions are idiosyncratic, the pattern is Gleasonian, with individualistic responses to the underlying environmental gradients and overlapping ranges (Gleason, 1926). The Clementsian pattern occurs if the boundaries are clumped in reference of distinctive “communities” in which the boundaries of species ranges are coincident (Clements, 1916).
Stream systems are characterized by branched and hierarchically organized dendritic networks (Grant et al., 2007) in which the upstream water course is smaller and tend to become larger in the downstream due to the connections between them. The mobility pattern of species is influenced by this structure (Brown and Swan, 2010). In dendritic networks, it is expected that communities of macroinvertebrates and fish assume distinct metacommunity patterns because these organisms respond differently to local and regional effects along the longitudinal gradient (Grant et al., 2007; Brown et al., 2011; Henriques-Silva et al., 2013; Fernandes et al., 2014). The environmental heterogeneity along the upstream-downstream gradient influences the community composition, creating species zonation and addition (Balon and Stewart, 1983; Rahel and Hubert, 1991; Petry and Schulz, 2006; Ferreira and Petrere, 2009).
The longitudinal gradient is central to stream hydraulics, depth, and substrate type and act as a filter on functional species traits (Lamouroux et al., 2002). The upstream-downstream gradient may affect the extinction-colonization events, shaping ecological community and facilitating the identification of the metacommunity pattern (Datry et al., 2016). Motivated by these ideas, we expect that stream fish community will exhibit turnover along the environmental gradient (Clementisian or Gleasonian metacommunity pattern), because both the environmental harshness in the downstream-upstream gradient and local environmental conditions determine the species occurrence in a transition of high to intermediate dispersal and within a instream to across streams gradient (Heino et al., 2015). Our objective was to verify whether a fish metacommunity in the Brazilian Atlantic Forest has a nonrandom structure along the longitudinal stream gradient. To do so, we applied the elements of metacommunity structure (EMS) to examine fish composition patterns at the micro-basin extent for 20 stream fish assemblages.
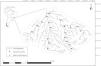
Material and methodsStudy areaThe network of streams selected is located in the southeastern of São Paulo state, in the Alto Paranapanema River Basin. The headwater streams originate in Serra de Paranapiacaba, at an elevation of 1100m. In this part of the basin, the vegetation is characterized by Atlantic Forest, with a rainfall of 1700 to 2400mm and an annual temperature ranging from 18°C to 20°C (CBRN, 2009). We selected twenty wadeable streams stretches targeting 2nd to 4th order (Strahler, 1952). Eleven were from Claro River micro-basin (C1–C8 and CL1–CL3), six from Pinhal River micro-basin (P1–P6), and three from Alegre River micro-basin (A1–A3) (Fig. 1 and Table S1). For each stream stretch, geographic coordinates (UTM) were recorded with a GPS (Garmin eTrex Legend H) and the distance (km) between each stream stretch and the main confluence in the subbasin and declivity (m/km) were measured.
Fish sampling and environmental data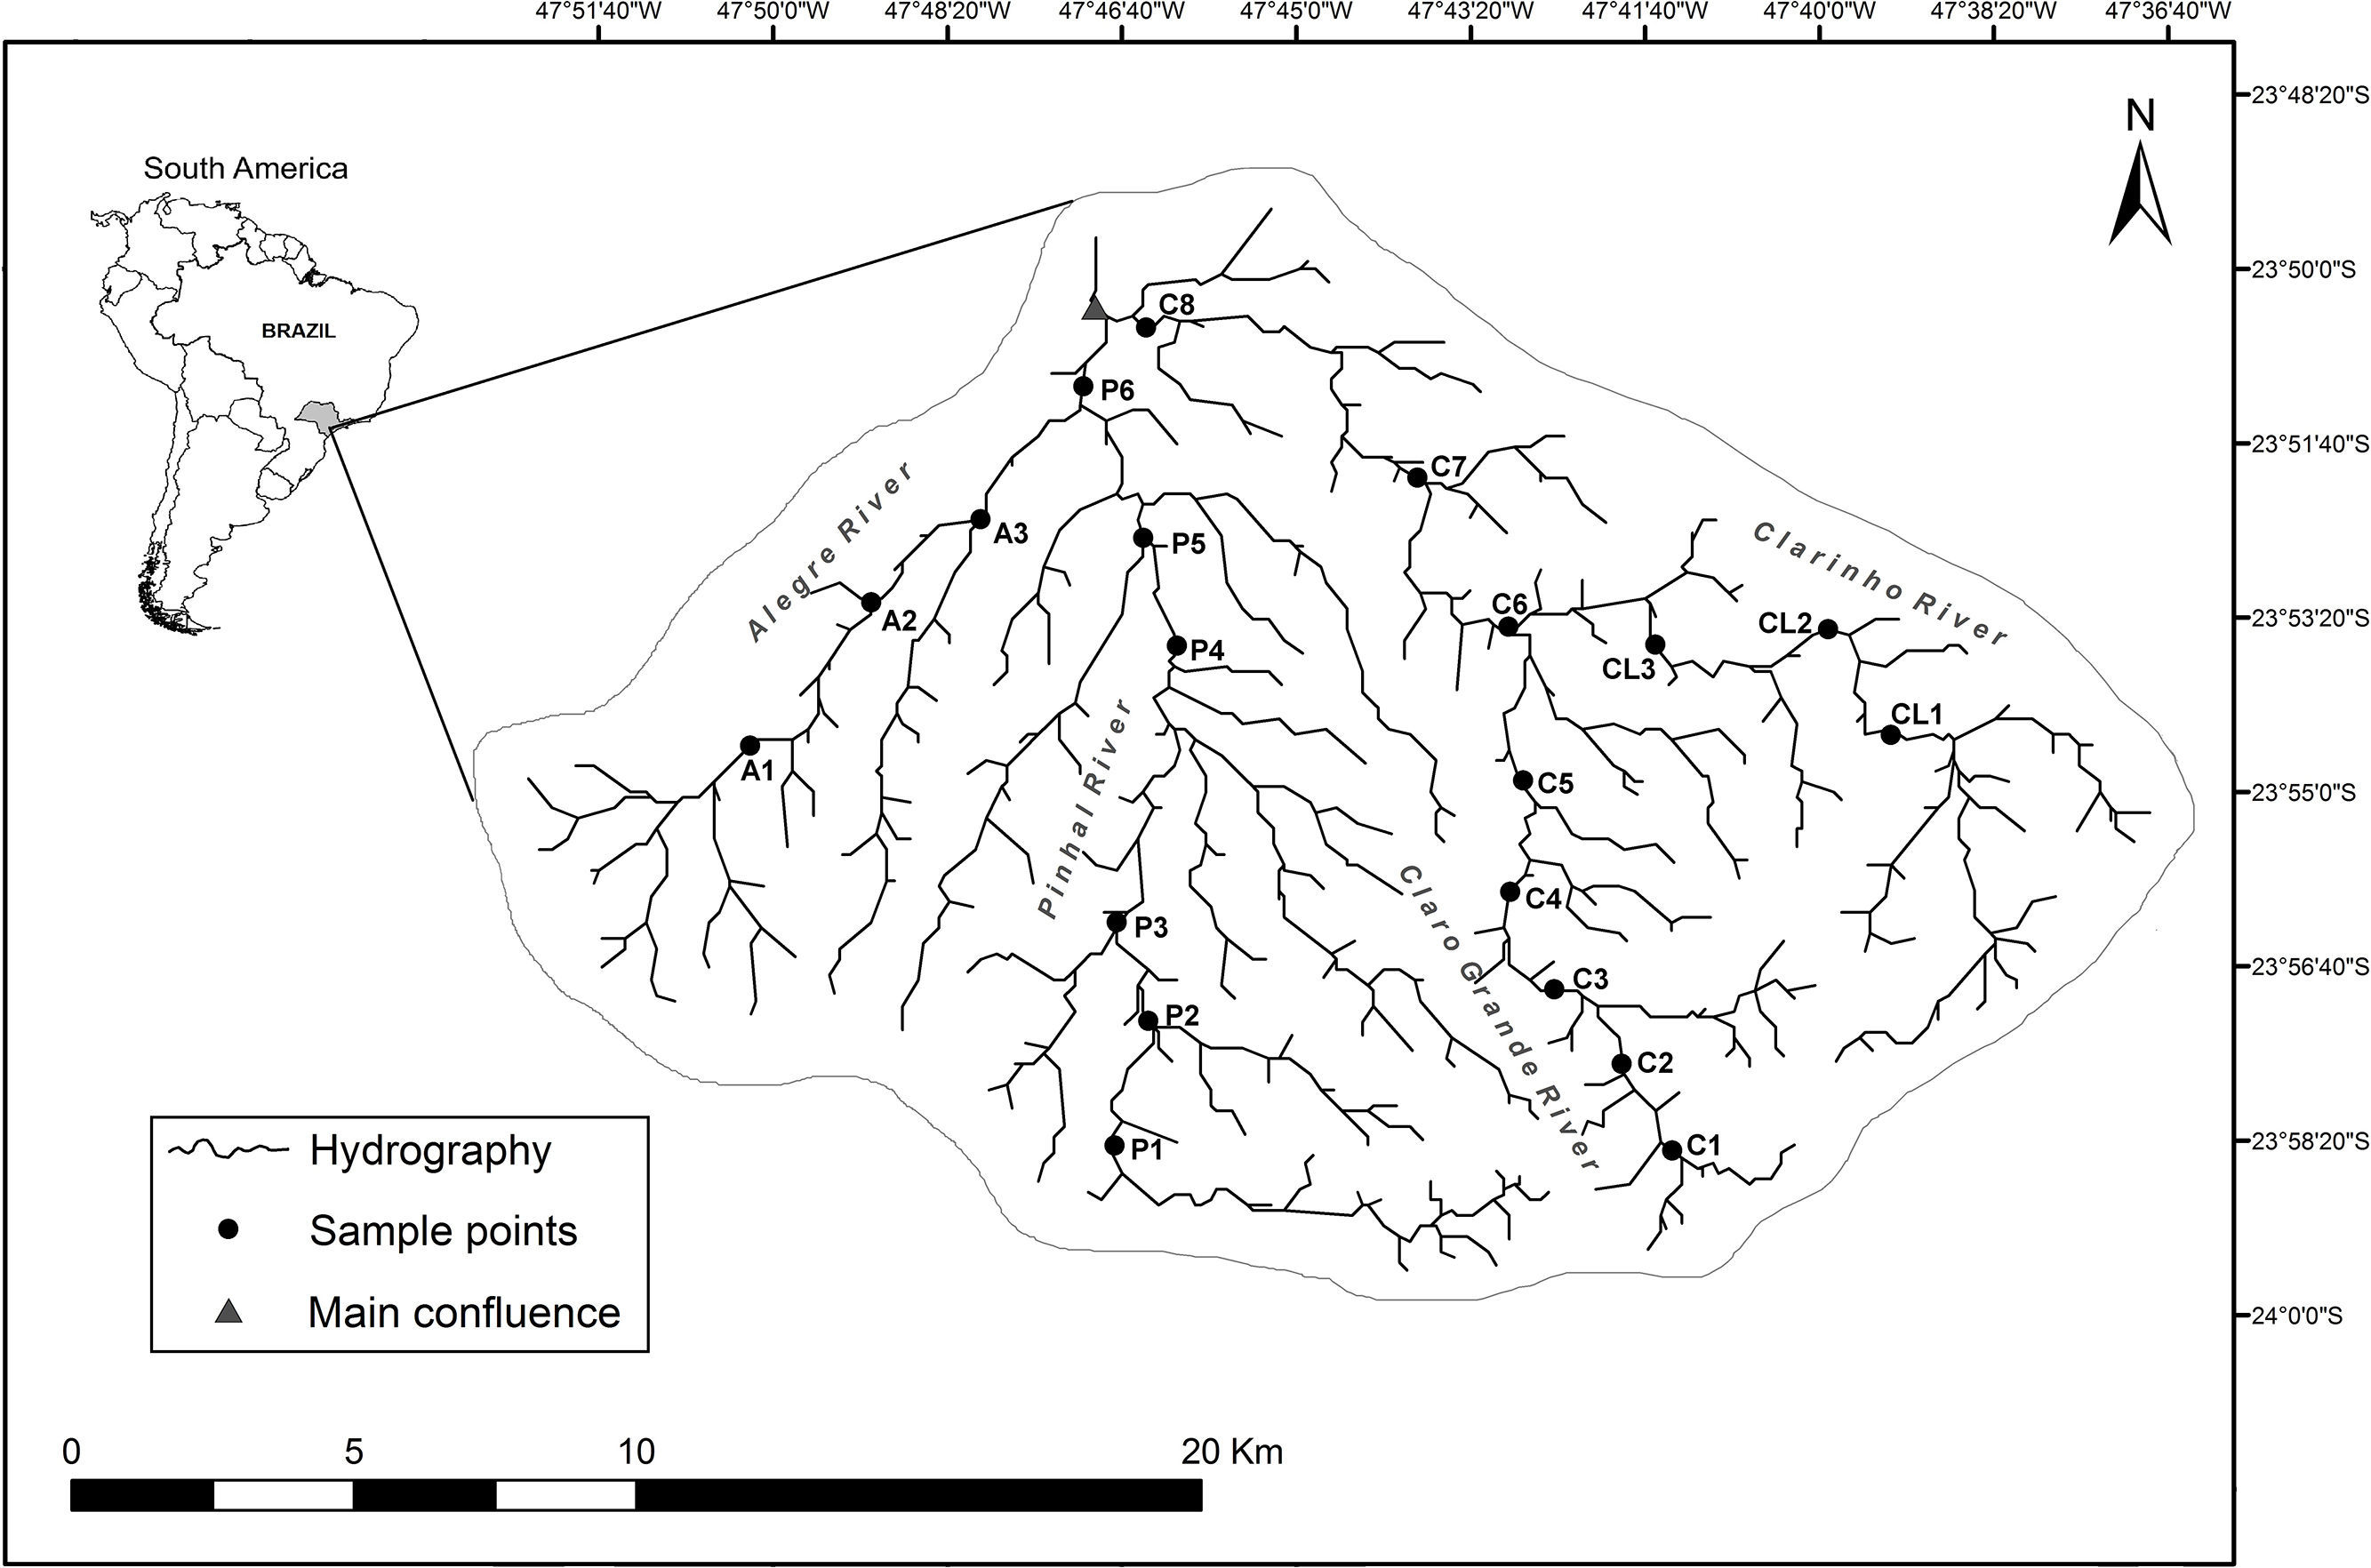
Fish were collected during the dry season in August–November 2011/12 during daytime hours by electrofishing using a portable gasoline generator (Yamaha EF2600 model, 2.3kVA, 60Hz) linked to a current rectifier. In each stretch, a single downstream-upstream sweep was performed, without contention nets at the upper and lower limits. We selected streams stretches of 70m in length presenting at least one pool-and-riffle sequence that provides a heterogeneous physical environment that is utilized by many different types of organisms (Fryirs and Brierley, 2013). In the dry season, the relationship between fish assemblages and water conditions in the streams were expected to be more robust, since flows are lower and fish can be captured more efficiently (Pinto et al., 2006; Pease et al., 2012). Furthermore, this ensured only direct dispersal interactions between sites, with no confounding in the data through multiple dispersal events, which occurs in the rainy season (Cottenie, 2005).
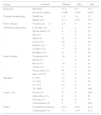
We used 29 variables to characterize the stream stretch environment (Table 1). Bank composition was visually estimated as the percentage of rocks, tree roots, tree trunks, steep slopes, and exposed soil in both banks at three transects positioned perpendicular to the 70-m reach. Transects were separated by 20–25m and selected to represent upper, middle, and low sections of the reach. Shading was estimated as the percentage of shaded and lighted areas within the 70-m stream reach.
Median, minimum and maximum values of the environmental variables.
| Group | Variable | Median | Min | Max |
|---|---|---|---|---|
| Regional | Dist (km) | 11.6 | 0.7 | 11.8 |
| Declivity (m/km) | 0.006 | 0.001 | 0.033 | |
| Channel morphology | Width (m) | 4.4 | 3.6 | 5.5 |
| Depth (cm) | 27.3 | 25.9 | 39.7 | |
| Flow velocity | Velocity (ms−1) | 0.2 | 0 | 0.4 |
| Substrate composition | Leaf litter (%) | 5 | 1 | 39 |
| Wood debris (%) | 6 | 0 | 16 | |
| Silt (%) | 3 | 0 | 24 | |
| Sand (%) | 11 | 0 | 70 | |
| Gravel (%) | 20 | 2 | 40 | |
| Pebbles (%) | 15 | 0 | 33 | |
| Cobbles (%) | 9 | 0 | 28 | |
| Boulders (%) | 11 | 0 | 56 | |
| Bank stability | Vegetation (%) | 18 | 0 | 83 |
| Rocks (%) | 1 | 0 | 67 | |
| Roots (%) | 10 | 0 | 24 | |
| Trunks (%) | 0 | 0 | 18 | |
| Steep stones (%) | 48 | 3 | 92 | |
| Bare soil (%) | 0 | 0 | 43 | |
| Shading | 0–25% | 50 | 0 | 75 |
| 25–50% | 13 | 0 | 75 | |
| 51–75% | 13 | 0 | 75 | |
| 76–100% | 0 | 0 | 100 | |
| Land cover | Forest (%) | 75 | 0 | 100 |
| Agriculture (%) | 0 | 0 | 80 | |
| Grazing (%) | 0 | 0 | 32 | |
| Urbanization (%) | 0 | 0 | 100 | |
| Water | Conductivity (μS/cm) | 23.5 | 15.2 | 81.4 |
| Temperature (°C) | 17.1 | 14.8 | 23.2 | |
Dist, distance to main stream confluence.
Channel morphology and flow velocity were recorded during onsite surveys and were taken at 1-m intervals in the three transects. Channel morphology was defined in terms of the mean and standard deviation of the width and depth measurements. Flow velocity was measured with a mechanical General Oceanics model 2030 flowmeter at the middle of the water column and described in terms of mean values recorded along the three transects.
Substrate composition included the percentage of woody debris, leaf litter, silt, sand, gravel, pebbles, cobbles, and boulders estimated at 1-m intervals along transects. To measure substrate variables, we visually estimated the composition of consecutive 1-m2 plots along each transect and scored substrate composition in an ordinal scale as 1, 2, 3, or 4, meaning <25, 26–50, 51–75, >75 percentage composition, respectively.
Physical and chemical variables including temperature and conductivity were measured once at a single point near a bank of the middle transect using portable analytical equipment (Marte MB-10P and Marte MB-11P). To characterize the riparian vegetative zone, we visually estimated the percentage (%) of the site-scale riparian shading and land cover types within a 30m along both sides of the sampling reach: (i) natural riparian vegetation, (ii) agriculture, (iii) grazing, and (iv) urbanization.
Statistical analysesTo check whether the metacommunity is nonrandomly structured along the environmental gradient, we analyzed the elements of metacommunity structure (EMS) checking patterns of coherence, species turnover, and range boundary clumping in the incidence matrix. Coherence measures the existence of a gradient promoted by biotic interactions (checkerboard) or by environmental effects. Species turnover measures the rate of replacement of one species by another along the gradient, allowing one to detect whether the pattern is nested or not (negative turnover). The boundary clumping provides evidence for whether the community pattern is Clementsian (obvious boundaries between communities), Gleasonian (individualistic species response to the environmental gradient), or evenly spaced (species have over-dispersed range boundaries) (Leibold and Mikkelson, 2002). The EMS analysis was applied using the “metacom” package (Dallas, 2013) after ranking the scores from the correspondence analysis (CA) (Leibold and Mikkelson, 2002).
The coherence is measured by counting the number of embedded absences in the incidence matrix, i.e., interruptions within the distribution of species or composition of sites, after the matrix had been ordered according to the correspondence analysis. The number of embedded absences in the matrix is statistically compared with the null distribution created by randomization in the observed matrix (Leibold and Mikkelson, 2002) (model “R1” package “Metacom” matrix, which maintains the species richness of a site – row totals – and fills species ranges – columns – based on their marginal probabilities) (Dallas, 2013). Before starting the analyses, we excluded species that occurred only in one site (i.e., a maximum of 5% of the total sites). Rare species are somewhat uninformative due to their idiosyncratic nature, and they can affect EMS analysis (Presley and Willig, 2010).
If the observed number of embedded absences is not statistically significant, the species do not respond to the environmental gradient and, in this case, there is no metacommunity structure. If coherence is significant and the number of embedded absences is greater than that found in the null model, it is assumed that a checkerboard pattern is occurring. If the coherence is significant, but the observed number is less than that found in the null model, it is assumed that there may be replacement or nestedness of species distributions (Presley et al., 2010).
Subsequently, we analyzed species turnover along the gradient. This enables us to assess the pattern of metacommunity loss or addition of species along the gradient. Species turnover analysis checks the number of times a species replaces another between two sites for every possible pair of species (Leibold and Mikkelson, 2002), when compared with the values generated by the null model. If the number of substitutions is different than expected by chance and less than average, this means that the metacommunity shows a pattern of species loss along the gradient analyzed, or a pattern of nesting. If the value of substitutions is significant and positive, a clumping pattern of species will occur along the environmental gradient.
The range boundary clumping of species is represented by the co-occurrence of species along the environmental gradient. The type of clumping is evaluated by the Morisita dispersion index. If I>1, this indicates that the metacommunity has a Clementsian pattern, i.e., the species respond to the environmental gradient and it is possible to partition the structure of metacommunities and analyze each compartment. If I<1, it is assumed that the clumping is evenly spaced. However, I=0 indicates that an individualistic response of species is occurring, assuming a Gleasonian pattern. To assess the significance of I, we used a χ2 test (Leibold and Mikkelson, 2002).
To verify whether the ordering of the points generated by the Detrended Correspondence Analysis (DCA) can be explained by environmental variables, we performed an analysis of unconstrained ordination. The DCA eliminates the arch effect and the underlying gradient determines whether the species responded to the gradient differently than we measured it (Legendre and Legendre, 2012). In this rescaling, the axes are scaled in units of beta diversity (SD units, or units of species standard deviations) (Gauch, 1982). The significance of the variables, obtained by a randomization process (1000 iterations) (Borcard et al., 2011), was observed (function envfit, vegan R-package, R Core Team, 2013; Oksanen et al., 2013).
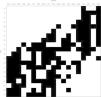
ResultsIn the 20 sampled streams stretches, 1189 individuals were collected and classified into 27 fish species (Table S2). The observed number of embedded absences (81) was statistically significant lesser than the mean produced by the null model (137.36, sd=11.36), indicating a nonrandom structure with positive coherence, and species distribution determined by a common latent environmental gradient. The observed number of replacements (3562) was statistically significant and greater than average (1216.04, sd=409.23), which is consistent with a nonnested structure. Morisita's Index (I=1.03) was positive but non-statistically significant (p=0.41), indicating that boundary clumping was stochastic and the metacommunity structure is Gleasonian (Fig. 2).

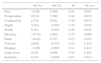
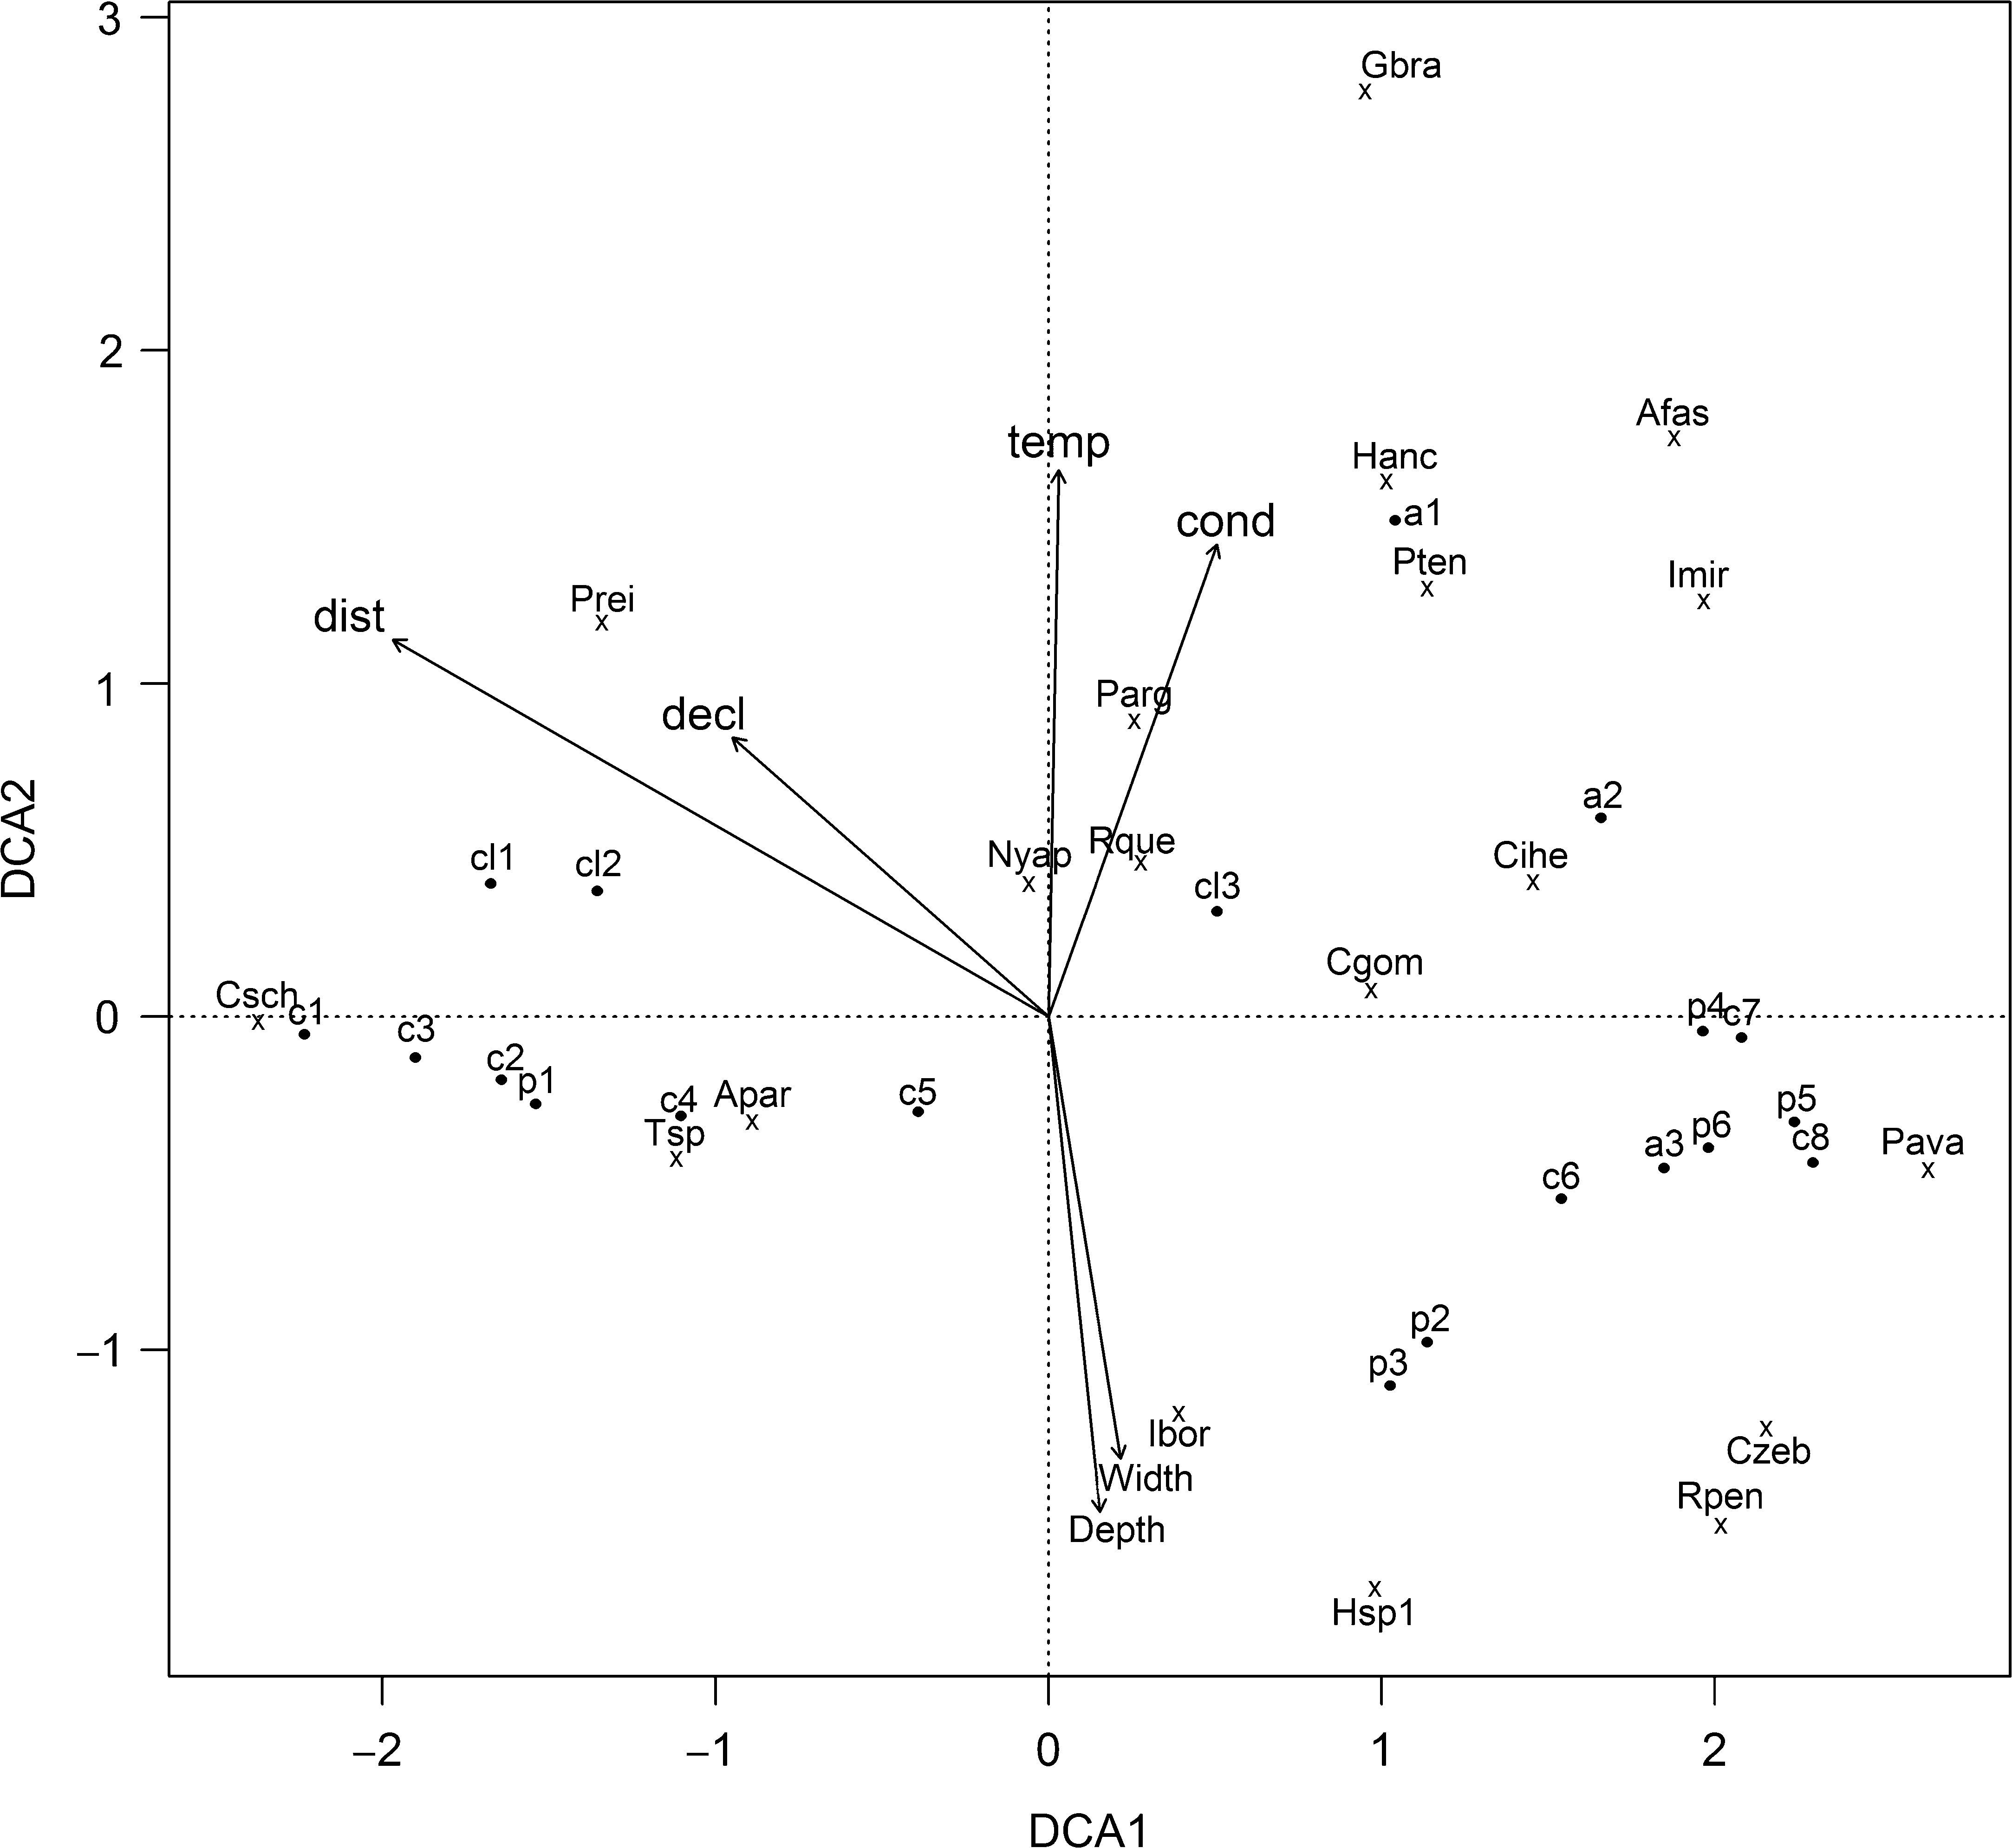
The DCA axes 1 and 2 explained about 50% of data variation (Table 2). On DCA1, the longitudinal gradient ordering the streams stretches from the headwaters (C1, C2, C3, CL1, and P1 with negative scores) to the downstream stretches (C6, C7, C8, A2, A3, P4, P5, and P6) (Fig. 3). The species associated with headwater stretches were Characidium schubarti (Csch), Trichomycterus sp. (Tsp), Astyanax paranae (Apar), and Phalloceros reisi (Prei). The range sample score is about 4.5 along the DCA1 axis, indicating a high beta diversity and that the samples at the low confluence distance share few species with those at the high confluence distance. The upstream stretches have higher confluence distance and declivity, and slower temperature, conductivity, depth, and width (Table S3).
Output of the unconstrained ordination analysis. Vectors (DCA1 and 2), coefficient of determination (R2) and p-value of the environmental variables.
| DCA1 | DCA2 | R2 | Pr (>r) | |
|---|---|---|---|---|
| Dist | −0.867 | 0.498 | 0.81 | 0.001 |
| Temperature | 0.018 | 1.000 | 0.42 | 0.015 |
| Conductivity | 0.336 | 0.942 | 0.36 | 0.015 |
| Depth | 0.104 | −0.995 | 0.35 | 0.029 |
| Width | 0.161 | −0.987 | 0.28 | 0.058 |
| Declivity | −0.750 | 0.662 | 0.25 | 0.068 |
| Bank | −0.642 | 0.767 | 0.13 | 0.303 |
| Velocity | 0.659 | −0.752 | 0.12 | 0.343 |
| Shading | −0.261 | −0.965 | 0.11 | 0.413 |
| Land cover | 0.041 | 0.999 | 0.10 | 0.392 |
| Substrate | 0.153 | −0.988 | 0.07 | 0.553 |
Dist, distance to main stream confluence.
We found that fish communities respond to the same latent environmental gradient, showing positive species turnover, but with individualistic responses, characterizing a Gleasonian structure, consistent with metacommunities molded by habitat preferences or specializations. Gleasonian pattern suggested that the communities varied continuously over space, potentially reflecting the degree to which species tolerances overlap. The metacommunity structure may have resulted from the environmental gradient, mainly from regional variables on a geomorphological scale, i.e., confluence distance and marginally with declivity, and local scale, i.e., temperature, conductivity, depth, and width. This environmental gradient can cause dispersion limitations, and for species to colonize a given site in the upstream, it must first have the ability to disperse from its source pool to arrive in the new environment, and then be tolerant to the new biotic and environmental conditions (Brown et al., 2011).
The Gleasonian pattern was molded by biotic and abiotic characteristics that change gradually. In streams systems, which are more continuous, the communities may show less ordered variations, and individualistic responses of species to multiple environmental gradients are expected (Heino, 2013; Heino et al., 2015). This gradual change in the physical, chemical, or structural condition did not allow discrete boundaries or the Clementsian pattern (Henriques-Silva et al., 2013; Willig et al., 2011). The nestedness pattern can be generated by low environmental gradient or dispersal limitation with low colonization capacity (Kodric-Brown and Brown, 1993; Cook et al., 2004). Our streams have gradual but high environmental gradient.
The sites ordination was slightly different from EMS to DCA. Each ordination addresses a different question that is contingent on the basis of ordination, and that the answers to each question may be ecologically valid (Presley et al., 2009). In the EMS ordination (CA), we defined the gradient that is important to metacommunity structure and ordinates communities and species along that latent gradient (Willig et al., 2011). The range sample score along the DCA1 axis indicated a high beta diversity.
Nevertheless, the two ordinations have A. paranae, C. schubarti, Trichomycterus sp., and P. reisi in their extremes. These species dominated most sampling points of upstream assemblages. These streams are characterized by spatial limitations, high food availability, and strong currents with selected species, which have adaptations for maintaining position in rapid current and foraging on substrates (Winemiller et al., 2008). Such species represent high functional diversity and belong to different feeding groups (omnivorous, invertivorous, herbivorous/detritivorous) and habitat use (nektonic, benthic, and benthic) (Casatti and Castro, 2006).
Our results indicated that streams fish communities can change in composition gradually along the environmental gradient, which may be an important driver of the metacommunity structure. Knowing the type of structure and the drivers that shape metacommunities is also relevant for their conservation, and could be useful to understand and predict the impacts of eventual streams disturbance. For example, increases in Small Hydropower Plants are expected as the result of anthropogenic activities (ANEEL, 2015). Our results indicated that fish stream metacommunity follow gradual species replacement structures that are highly influenced by confluence distance. Consequently, communities found at low streams have high share with those found at high confluence distance. Ensuring the connectivity of streams is a good conservation strategy as the species move from one to another, being very dependent on the colonization source. This environmental management can affect biodiversity at local and regional scales, thus we would require devoting local conservation efforts to a large number of different streams reaches and in a micro-basin regional scale.
Conflicts of interestThe authors declare no conflicts of interest.
We are grateful to Fundação de Amparo à Pesquisa do Estado de São Paulo for financial support (Proc. 2009/53056-8 and 2012/09346-4). The Dr. Francisco Langeani Neto (UNESP/São José do Rio Preto) for species identification, the PPGDBC for financial support for the manuscript translation and Alexandre Peressin, Bruna Cruz, Bruno Mello, Fernanda Teshima e Maurício Carvalho for the data collection. Two anonymous N&C reviewers and Michael R. Willig provided helpful comments on earlier drafts of the manuscript.
The following are the supplementary data to this article: