The relevant scales over which specific communities vary must be identified to address fundamental ecological questions and to advance the conservation of biological diversity. In this study, the variation among drosophilid assemblages associated with forests was quantified at a large temporal–spatial scale. Our results are based on data collected in four conservation units (CUs) in the Brazilian savanna across four seasons and two years. The primary component of variation occurred at the temporal scale: it was three times greater than that of the spatial scale. Significant variability was also found in the interaction between seasons and CUs. Measuring the temporal and spatial variability of drosophilid diversity in forests contributed to the improvement of the methodological framework supporting such assemblages as bioindicators and provided important insights into the mechanisms behind the dynamic patterns in time and space that ultimately can improve our understanding of Cerrado biodiversity.
Biological diversity is a multifaceted concept that has long been a topic of interest in ecology and conservation. The innumerable processes regulating biodiversity are driven by various biotic and abiotic variables, which are interconnected, scale-dependent, and affect the distribution of organisms in complex ways (Levin, 1992; Wardhaugh, 2014). Reducing biodiversity loss is among the most important challenges in this century (CBD, 2010). However, documenting and conserving all biodiversity is unachievable, especially in megadiverse regions, because of many factors, such as the great (and frequently little-known) diversity, vast geographic dimensions, limited funding for study and conservation, and the high level of environmental threat by humans. The use of bioindicators emerges as a way to reduce complexity to more achievable approaches to biodiversity conservation and monitoring (Magurran and Queiroz, 2010). Therefore, quantifying the spatial and temporal variability of the distributions of organisms is a fundamental step not only for identifying relevant scales for research but also for creating effective tools for biological conservation.
The Brazilian savanna, locally known as the Cerrado, is a highly heterogeneous biome, with forests, grasslands and fields occurring in the same region and latitude under highly similar climatic conditions (Oliveira and Marquis, 2002). Another conspicuous characteristic of the Cerrado is its seasonality. The average annual rainfall is 1500mm, with rains strongly concentrated in the rainy season (i.e., November–March). Most plants desiccate, and some even die during the dry season (i.e., May–September), when rains rarely occur (Bustamante et al., 2012). Animal communities also reflect the heterogeneity of the Cerrado. Studies of insects – organisms that exist in the environment at finer spatial scales – show that these organisms form communities that vary sharply among the different vegetation types (Pinheiro et al., 2002; Carrijo et al., 2009; Pacheco and Vasconcelos, 2012; Mata and Tidon, 2013), regions of the biome (Ferro and Diniz, 2007; Mata et al., 2010), and through the seasons (Pinheiro et al., 2002). However, studies that investigate this biological variation across multiple temporal–spatial scales while considering the same habitat type (i.e., gallery forests) are still lacking.
Although gallery forests occur naturally in the Cerrado biome as patches, the high rates of destruction of these environments have contributed to the loss and further isolation of the remaining areas. Whereas gallery forests currently occupy only 5% of the territory of this biome, they support approximately 33% of its phanerogamic flora (Felfili et al., 2001), which harbor the biome's highest biodiversity. Therefore, this high diversity is associated with current severe threats (fragmentation, deforestation and fire), generating the need for studies focused on biodiversity monitoring and conservation planning of the gallery forests.
Drosophilid assemblages of the Cerrado have been suggested as bioindicators (Mata et al., 2008) and are considered an excellent model system for studies in conservation biology (Mata et al., 2010). Determining and measuring the scales on which the drosophilid assemblages associated with gallery forests vary through time and across space will contribute to advancing the methodological framework that supports the use of drosophilids as bioindicators. In this study, we focused on three questions: How much of the assemblages’ differences can be explained by the variation (1) through time (intra-year and inter-years), (2) across space (four different conservation units), and (3) by the interaction of both?
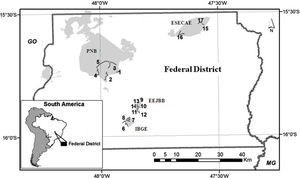
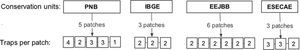
Material and methodsSampling design and species identificationThis study was conducted in four conservation units (CUs) of the Brazilian savanna in the Federal District: Parque Nacional de Brasília (PNB; 15°42′S, 48°00′W), Reserva Ecológica do Instituto Brasileiro de Geografia e Estatística (IBGE; 15°56′S, 47°53′W), Estação Ecológica do Jardim Botânico de Brasília (EEJBB; 15°54′S, 47°50′W) and Estação Ecológica de Águas Emendadas (ESECAE; 15°33′S, 47°35′W) (Fig. S1). Because drosophilid assemblages show strong seasonal variation (Mata and Tidon, 2013),we made two collections representative of the rainy season (February 2010 and February 2011) and two representative of the dry season (July 2010 and August 2011). In each collection, we investigated two spatial scales: among the different CUs (regional) and among the different forest patches of the same CU (local).
In each forest patch, we exposed one to four drosophilid retention traps (Roque et al., 2011) (Fig. S2), with each trap separated by at least 30m. The traps were baited with bananas fermented with dried baker's yeast (Saccharomyces cerevisae) and left in the field for three consecutive days. In the laboratory, we identified the flies to the species level when possible and deposited vouchers at the Collection of the Laboratório de Biologia Evolutiva da Universidade de Brasília.
Data analysesIndependence among the traps was investigated using spatial autocorrelation (Mantel test), which did not identify pseudoreplicates (Global Pearson's r=0.006; p=0.97). Among the 156 traps placed in the field, 143 captured drosophilids and were used as sampling units. Individual-based rarefaction curves for all drosophilids were compiled separately for the CUs to assess the completeness of the samples (Sest; EstimateS 9.1; Colwell, 2013).
The same 143 traps were then used to produce ecological similarity measures among sampling units based on the Bray–Curtis similarity index (a measure of β diversity). The data were standardized by the total to minimize the different size effect among sampling units and square root transformed to balance the contribution of the common and rare species. The similarity matrix was then subjected to a permutational multivariate analysis of variance (PERMANOVA; Anderson, 2001) to quantify the variability and determine the relative importance of each factor. The analytical model used in the analysis consisted of four factors: season (broad temporal scale), year (narrow temporal scale), conservation unit (regional spatial scale) and forest patch (local spatial scale). The years were nested into the seasons, and the forest patches were nested within the CUs. Because the nested factors are random, their interactions were not included in the model: we only interpreted the interaction between the fixed factors (season x protected area). The sizes of the components of variation, corrected for the corresponding degrees of freedom, were also calculated by PERMANOVA for each factor. A principal coordinates analysis ordination (PCO) displayed the dissimilarity relations (or β diversity relations) among samples classified according to the different factors. These analyses were run in Primer V6 software (Clarke and Gorley, 2006).
ResultsWe captured 18,400 individuals belonging to 51 drosophilid species (Table S1 in supplementary material online), and the rarefaction curves showed a tendency to reach an asymptote (Fig. 1). Considering the total number of species collected, the Sest estimator of species richness suggests that our sampling protocol gathered 73% of the species in IBGE, 71% in EEJBB, 59% in PNB and 69% in ESECAE.
 of the drosophilid assemblages for each of the four conservation units that were sampled.")
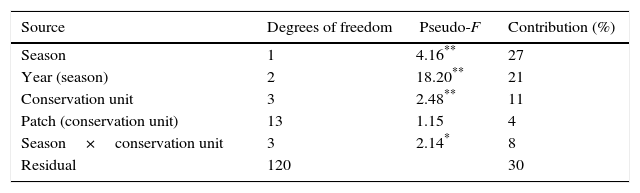
The strongest component of variation of the forest drosophilid assemblages was the temporal scale: it explained almost half of the drosophilid dissimilarities. The spatial scale contributed 15% to the data variability, and the interaction between seasons and CUs contributed 8%. In addition, the variability of all factors was significant, except for the variability found at the local spatial scale (among forest patches: p=0.20). A very large component of variation was found in the residual (30%), which was interpreted as the variability among traps in the same forest patch (microhabitats) (Table 1).
PERMANOVA based on Bray–Curtis similarity and calculated from proportional abundances of individual species (51 species) per forest patch over four sampling periods (143 traps), relativized and square root transformed, including estimates of pseudo-multivariation at each scale as a proportion of the total.
The ordination of patch centroids, summing all sampling periods and traps for each patch, illustrates the regional effect (Fig. 2). Drosophilid assemblages from patches in the same CU were more similar to each other than they were to those in patches of the other CUs. Furthermore, assemblages from CUs located in the southern portion of the Federal District (IBGE and EEJBB) showed a relatively higher degree of similarity to each other than those located in the northern portion of this region (PNB and ESECAE), which also showed a relatively high degree of similarity to each other. Because of the large variation among sampling periods, the dissimilarity relations among patches were investigated separately for each sampling occasion. In this case, although the groups varied according to the sampling period, the patches in a CU tended to cluster together and/or with the forests of the neighboring CUs (Fig. 3).

Principal coordinates ordination of drosophilid assemblages of the Brazilian Federal District's gallery forests showing the dissimilarity relationship among the four conservation units (CUs). Each point represents the centroid of the traps within each forest across all sampling occasions. ♢ PNB, ○ ESECAE, ♦ IBGE, ● EEJBB.

This study is the first to quantify the variation of drosophilid assemblages from a unique habitat type of the Brazilian savanna, the gallery forest, at a large temporal–spatial scale. For those assemblages, time indeed explained almost 50% of total variation, a result that agrees with the seasonality patterns already demonstrated by previous studies that compared contrasting environments of the biome (Tidon, 2006; Mata and Tidon, 2013; Roque et al., 2013). During the rainy season, most of the species expanded their populations, occupying virtually all the forest patches. During the dry season, in contrast, drastic population bottlenecks occurred. Possibly, these bottlenecks were followed by local extinctions in certain patches. The population recovery after bottlenecks supports the findings of the previously cited studies (focusing on imagoes), as well as the findings of Mata et al. (2015) focusing on immature stages.
Regarding the geographical scale, the drosophilid assemblages varied among the conservation units (15% of total variation). The forest assemblages in the same CU were more similar to each other and/or to the forests of the neighboring CUs. Indeed, assemblages from the same habitat type vary geographically. This result emphasize not only the need for conserving the biodiversity between the CUs but also for protecting the high number of still-unprotected forest environments, whose loss or alteration may contribute to a reduction in the biodiversity of the Neotropics. Still, the similarities between the CUs located in the northern portion of the Federal District and the similarities between the CUs located in the southern portion of the Federal District were greater than the similarities between the northern and southern CUs. In general, according to metacommunity theory, the dispersal rate among relatively close patches must be greater than the rate among different CUs, especially among those that are farther apart (Leibold, 2011). Therefore, the difference between regions as well as the relative similarity between forests in the same CU is likely due to the dynamics among the patches, which are dictated primarily by the dispersing potential of the species involved.
A significant part of the variation in the assemblage structure occurred among the traps in the same forest patch (30% of total variation) even though only a few meters separated them. Although the mechanisms determining this variation at the local level are not well understood, the vertical stratification of the forests can be a clue for explaining this pattern, as it provides a great diversity of niches (Tanabe, 2002), and flies move actively among these strata, searching for food resources and suitable microclimate conditions (Roque et al., 2013). The movement in search of niches that maximize survival and reproduction, called “niche construction” (Odling-Smee et al., 2003), is still little studied and certainly has important consequences for ecological and evolutionary theory (Dickins and Rahman, 2012). In addition to factors “determined” by organism-environment interactions, certainly part of the observed variation may be stochastic; that is, the individual was captured simply because it was passing by that location at the sampling time.
This study can contribute to improve the methodological framework that proposes the use of drosophilid assemblages as bioindicators (Mata et al., 2008) for monitoring and diagnostic assessments. First, by including the temporal dimension in this framework, this study clearly revealed that drosophilid diversity associated with the forests varies at multiple temporal–spatial scales. The implication of this result for the bioindication framework is that the use of drosophilid assemblages in monitoring surveys must properly choose the time and locality to sample. This will guarantee that the study goals are in accordance with the scale on which the selected phenomena occur. For instance, if the goal is monitoring drosophilid diversity over years, one cannot consider samples from wet or dry seasons arbitrarily, because this can seriously bias the results. In this case, the most appropriate would be collecting in the wet season, when assemblages are expanded and the richness of the neotropical species is higher. Second, from the results of β diversity analysis, this study advocates that the measurement of β diversity (variation of diversity across patches) can be a very good measure to be added in diagnostic surveys comparing forests among two or more regions. Especially if these diagnostic surveys aim at reserve selection and delineation, β diversity can identify the complementarity between the patches and, therefore, furnish appropriate information for the goal of the survey. Finally, an investigation into the mechanisms that promote these dynamic patterns in time and space, as well as the role of these mechanisms in modulating the drosophilid assemblages, is an important research goal for a future investigative agenda.
Conflicts of interestThe authors declare no conflicts of interest.
We would like to thank the Universidade de Brasília, Parque Nacional de Brasília (PNB), Reserva Ecológica do IBGE (IBGE), Estação Ecológica do Jardim Botânico de Brasília (EEJBB) and Estação Ecológica de Águas Emendadas (ESECAE) for logistic suport, and Dr. E.M. Vieira and Dr. R.B. Machado for critiques of earlier versions of this manuscript. Financial support was provided by CNPq, FAPDF, and FINATEC.