


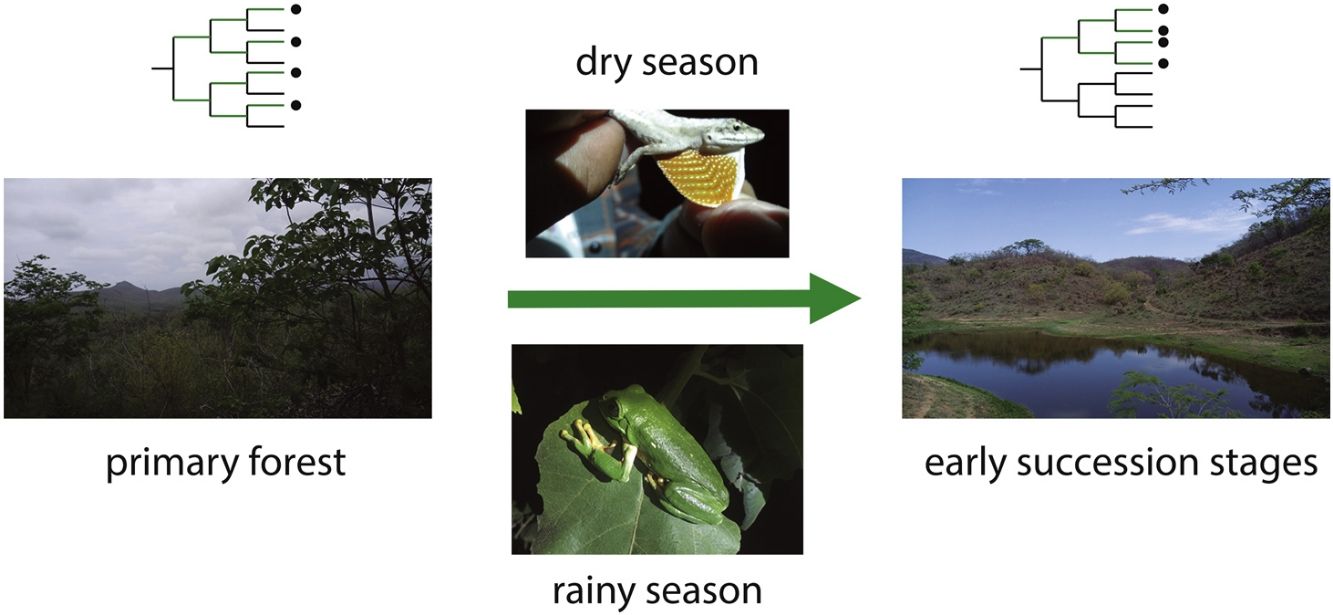
The tropical dry forest (TDF) is one of the most biodiverse ecosystems on earth, but also one of the most threatened. Therefore, it is critical to understand the processes that control community assembly and generate diversity during succession. We surveyed 15 herpetofaunal communities from a chronosequence of succession plots and tested whether phylogenetic structure (nonrandom distribution of species with respect to phylogeny) and phylogenetic diversity (incorporation of phylogenetic differences between species to measure biodiversity) differed among seasons and succession stages of the TDF in western Mexico. Phylogenetic structure and diversity of both groups showed temporal shifts. Our data suggest a role of environmental filtering in the first succession stages: during the rainy season in amphibians, allowing the coexistence of closely related species in water ponds, while for reptiles during the dry season, where higher exposure to solar radiation and humidity loss predominate in pastures. The more distantly related species in primary and secondary forests in later succession stages may predict ecosystem stability assuring the sufficient ecological strategies in a community to achieve the persistence of the ecosystem under changing conditions. Our results strengthen the arguments for promoting the conservation and managing of secondary forests under recovery to maintain phylogenetic diversity.
Habitat loss and degradation are the most important threats that tropical forests and its associated fauna currently suffer (Primack, 2012). Consequently, primary forests tend to be rapidly replaced by the regeneration of secondary vegetation on previously deforested and degraded lands, which comprise five of the 11 million km2 of tropical forest coverage remaining today (Dent and Wright, 2009). The study of forest succession is important to understand the processes that control community assembly and generate diversity (Letcher et al., 2012), and to predict ecosystem responses to future anthropogenic disturbances (Prach and Walker, 2011).
One approach to study these processes is through the use of phylogenetic information. As phylogenies represent the accumulation of biological differences along branches, they may be used to explain or predict ecological and evolutionary processes assembling species into biological communities (Tucker et al., 2016). Based on this idea, many metrics have been developed to investigate patterns of community structure and diversity from a phylogenetic perspective (Vellend et al., 2011; Cadotte and Davies, 2016; Tucker et al., 2016). Phylogenetic structure represents nonrandom distribution of species within communities with respect to phylogeny (Webb et al., 2002). Some of the most commonly metrics used are net relatedness index (NRI) and nearest taxon index (NTI), which estimate how closely related are on average each pair of species within a community (Webb et al., 2002). From these metrics three outcomes can be obtained: phylogenetic clustering, overdispersion or random. Assuming that closely related species will tend to have similar ecological requirements, phylogenetic clustering suggests environmental filtering on shared physiological tolerances (Webb et al., 2002). Phylogenetic overdispersion suggests competition causing overdispersion of conserved traits or environmental filtering on ecologically important convergent traits (Webb et al., 2002). In a random pattern, no clustering or overdispersion can be detected. Therefore, the relative roles of niche-related (e.g., environmental filters and competition) vs neutral processes (e.g., random speciation and extinction, dispersal limitation) in community assembly can be inferred (Webb et al., 2002; Vellend et al., 2011; Cadotte and Davies, 2016).
Phylogenetic diversity is a measure of biodiversity incorporating phylogenetic differences between species (Faith, 1992). A commonly used metric is the phylogenetic diversity index (PD), which quantifies the total branch length spanned by the phylogenetic tree including all the species of a community (Faith, 1992). However, phylogenetic structure metrics can also give insights into phylogenetic diversity patterns (i.e., clustering = less phylogenetic diversity; Kellar et al., 2015). Phylogenetic diversity metrics thus explicitly incorporate species differences and not just the species richness and evenness (Vellend et al., 2011), and are often more useful because conserving the evolutionary diversity of a community would conserve their feature and functional diversity (Faith, 1992).
The tropical dry forest (TDF), one of the most biodiverse ecosystems around the world and with the largest extension in Mexico compared to the rest of America, is characterized by a pronounced seasonality in precipitation with a marked dry period during several months (Portillo-Quintero and Sánchez-Azofeifa, 2010). Despite its importance, the TDF is one of the most threatened ecosystems due principally to anthropogenic fragmentation and transformation because of farming and ranching (Trejo and Dirzo, 2000). Two of the most diverse and threatened groups that inhabit the TDF in Mexico are amphibians and reptiles (Ramírez-Bautista and Garcia, 2002). Around 77 (23%) amphibian and 243 (34%) reptile species inhabit this ecosystem in Mexico, representing 25% and 33% of all endemic species recorded in the country respectively (Ceballos and García, 1995). These organisms have important values as integral components of natural ecosystems and as indicators of environmental quality (Gibbons et al., 2000). Moreover, species of both classes are vulnerable to habitat loss and degradation (Gibbons et al., 2000; Gardner et al., 2007). Amphibians are more affected by deforestation and changes in humidity regimens, while reptiles are more affected by agriculture and the architectural change of their habitat (Gardner et al., 2007).
In this study, we assessed patterns of phylogenetic structure and diversity of amphibian and reptile communities along a successional gradient of TDF in western Mexico. We predicted a decrease in community relatedness across succession and a pattern of phylogenetic clustering (positive NRI and NTI) in pastures and first succession stages, compared to phylogenetic overdispersion or random patterns in later succession stages and primary forests (negative NRI and NTI for overdispersion and not-significant for random patterns; Fig. 1). This is expected as habitat filtering should be more important in newly opened areas because species are likely to experience environmental adversity (Chazdon, 2008). Similarly, we predicted an increase in phylogenetic diversity across succession, where primary forests and later succession stages will contain more distantly related species by having more niches available (Fig. 1). We also predicted higher values of PD and a stronger pattern of phylogenetic clustering during the dry rather the rainy season (i.e. higher NRI and NTI; Fig. 1). Studying phylogenetic structure and diversity across succession allow the evaluation of ecological forces that drive communities at different points in the assembly process (Letcher et al., 2012), and allow an indirect evaluation of communities’ functional diversity (Faith, 1992).
, indicated by the total branch length spanned by the phylogenetic tree including all the species in a community. On the left, the community has four closely related species, representing low PD and positive values of the net relatedness index (NRI) and the nearest taxa index (NTI). On the right, the community has four distantly related species, higher PD and negative values of NRI and NTI.")
Two possible scenarios of changes in community phylogenetic structure and diversity expected during forest succession, and during two contrasting seasons. Points in the phylogeny indicate the presence of species in a community. Red branches represent the phylogenetic diversity index (PD), indicated by the total branch length spanned by the phylogenetic tree including all the species in a community. On the left, the community has four closely related species, representing low PD and positive values of the net relatedness index (NRI) and the nearest taxa index (NTI). On the right, the community has four distantly related species, higher PD and negative values of NRI and NTI.
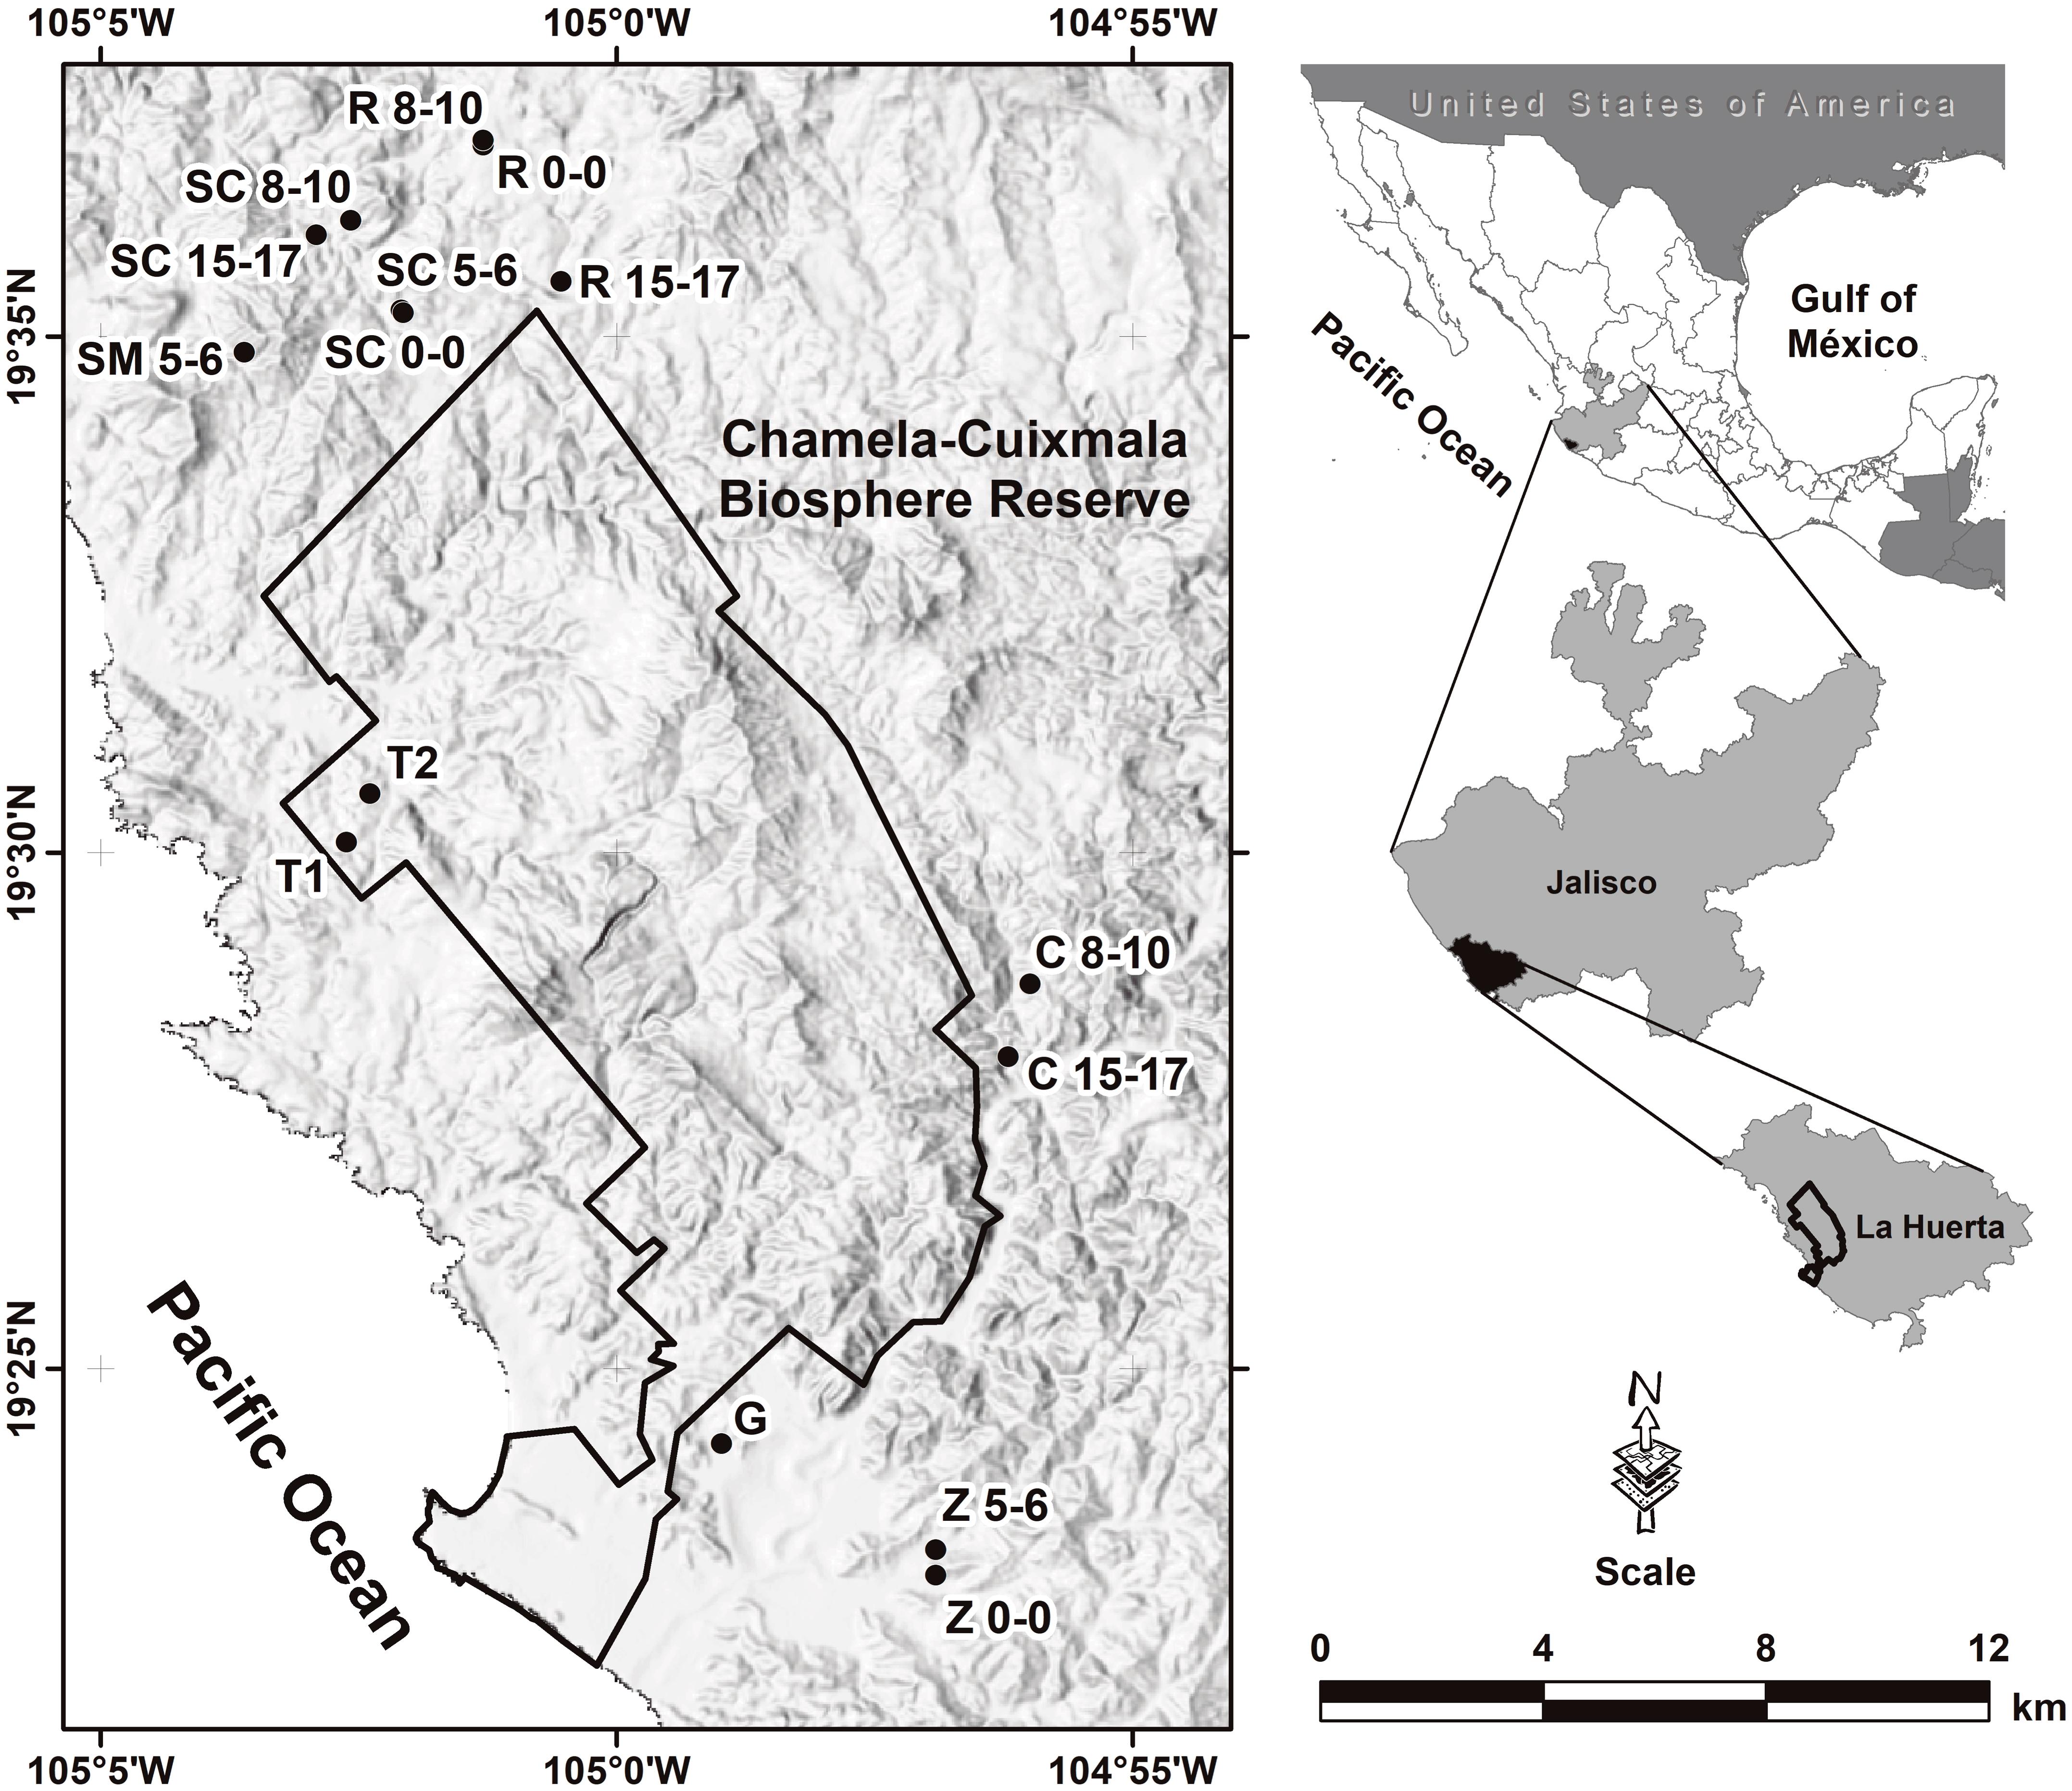
The study was conducted in the Chamela region including the Chamela-Cuixmala Biosphere Reserve, located in the western coast of Jalisco, Mexico (19º30’N, 105º03′W; 0−500 m. asl; Fig. S1), comprising an area of 13,142 ha of conserved TDF (Appendix A). We selected five plots of 1 ha each, representing five vegetation stages of succession: pasture, early (5–6 years of abandonment), young (8–10 years), intermediate (15–17 years), and primary forest (highly conserved forest without human alteration signatures; Fig. S1; Table S1). Plots were replicated three times (15 in total) and were located at least 3 km apart from each other to avoid pseudoreplication. This sample scheme is part of the Tropical Forest Management long-term project (MABOTRO; Martínez-Ramos et al., 2012).
Surveys were conducted by five expert field herpetologists from August 2009 to October 2013 (Appendix A). For the analyses we constructed species presence/absence and species abundance matrices for each 15 plots, separately for rainy and dry seasons and by taxonomic group. In order to display differences in community composition across succession stages and seasons, we performed a Nonmetric Multidimensional Scaling (NMDS) using Jaccard index in vegan package (Oksanen et al., 2019) for R3.6.1 (R Core Team, 2019).
Phylogenetic structure and diversity measuresTo calculate phylogenetic structure and diversity estimations we used a time-calibrated tree from Jetz and Pyron (2018) containing 7239 amphibian species, and one from Tonini et al. (2016) containing 9755 reptile species. Only Rhinoclemmys pulcherrima was discarded because turtles were not represented in the reptile phylogeny (Tonini et al., 2016). The original time-calibrated trees were pruned in the picante package (Kembel et al., 2010) for R to include only species registered in our plots.
In each plot for amphibians and reptiles and for the rainy and dry seasons, we calculated the following abundance-based community phylogenetic structure measures: net relatedness index (NRI) and nearest taxon index (NTI) (Webb et al., 2002) (Appendix A). To determine if communities show phylogenetic clustering or overdispersion, we compared the observed values of NRI and NTI to the patterns expected under null community assembly, using taxa.labels as a model to generate 1000 null communities (Kembel et al., 2010). With the presence/absence matrix we estimated PD (Faith, 1992). To test for spatial autocorrelation we calculated a distance matrix based on the mean pairwise distance (MPD) separating two taxa drawn randomly from different communities with the function comdist. All measures were calculated in picante.
Comparisons among succession stages and seasonsTo compare phylogenetic structure and diversity estimations among succession stages and seasons, we performed generalized linear mixed models (GLMM) with Gaussian distribution in R. The models included succession stage, season and their interaction as fixed factors, plots as the random effect and PD, NRI and NTI as dependent variables. To test for spatial autocorrelation among sampling sites, we performed Mantel tests in vegan between the Euclidian distance among sampling sites and MPD.
ResultsHerpetofaunal communitiesWe registered 1200 individuals from 17 amphibian species and 2835 individuals from 42 reptile species. Species recorded represent eight and 15 amphibian and reptile families respectively (Fig. 2). The most diverse families were Colubridae (18 species), Hylidae (7 species), and Phrynosomatidae and Teiidae (four species each; Table S2). Sampling completeness for each succession stage ranged from 49% to 95% (Table S3), and above 90% when pooling all succession stages.
 based on species’ abundance from 15 plots showing community composition across succession stages and season: a) reptiles during the rainy season, b) reptiles during the dry season, c) amphibians during the rainy season, d) amphibians during the dry season.")
Nonmetric multidimensional scaling (NMDS) based on species’ abundance from 15 plots showing community composition across succession stages and season: a) reptiles during the rainy season, b) reptiles during the dry season, c) amphibians during the rainy season, d) amphibians during the dry season.
NRI decreased across succession during the dry season for reptiles, however, only pastures had significantly higher values than primary forests (z = −3.24, P < 0.05), indicating a more clustered pattern and lower phylogenetic diversity in pastures (Fig. 3a). We did not detect any differences for NRI or NTI during the rainy season (Fig. 3a,c). Contrary to our prediction, no community showed significantly non-random phylogenetic structure relative to random assemblages.
 and nearest taxon index (NTI) for reptiles (a, c) and amphibians (b, d) in each succession stage of the tropical dry forest in the study region for the rainy and dry season. Early forest, EF; young forest, YF; intermediate forest, IF; primary forest, PF. Positive NRI or NTI indicates phylogenetic clustering, and negative values indicates phylogenetic evenness, according to Kembel et al. (2010). Asterisks indicate significantly non-random phylogenetic structure (phylogenetic clustering) relative to random assemblages. NRI and NTI data are reported in standard deviation units. Statistically significant differences among treatments are indicated with letters.")
Net relatedness index (NRI) and nearest taxon index (NTI) for reptiles (a, c) and amphibians (b, d) in each succession stage of the tropical dry forest in the study region for the rainy and dry season. Early forest, EF; young forest, YF; intermediate forest, IF; primary forest, PF. Positive NRI or NTI indicates phylogenetic clustering, and negative values indicates phylogenetic evenness, according to Kembel et al. (2010). Asterisks indicate significantly non-random phylogenetic structure (phylogenetic clustering) relative to random assemblages. NRI and NTI data are reported in standard deviation units. Statistically significant differences among treatments are indicated with letters.
In amphibians, we did not find a consistent pattern of decrease in NRI and NTI (Fig. 3b,d). Although a decrease in NRI can be observed during the rainy season (except for early forests), GLMMs indicated that only early forest had significant higher values of NRI than intermediate (z = −3.69, P < 0.01) and primary forests (z = −3.39, P < 0.01; Fig. 3b). Considering NTI, pastures (z = −2.93, P < 0.05), early (z = 3.23, P < 0.05) and young forests (z = −3.13, P < 0.05) had significantly higher values of NTI compared to primary forests (Fig. 3d). However, during the dry season NRI and NTI increased across succession, but only intermediate (z = 4.02, P < 0.001) and primary forests (z = 3.72, P < 0.01) had significantly higher values than pastures in NRI (Fig. 3b); young (z = 3.09, P < 0.05), intermediate (z = 4.53, P < 0.001) and primary forests (z = 3.69, P < 0.01) had higher values of NTI than pastures (Fig. 3d). Consistent to our prediction, amphibian communities showed significantly non-random phylogenetic structure (clustering) relative to random assemblages in the three first succession stages for both NRI and NTI during the rainy season (Fig. 3b,d). During the dry season, communities of primary forest and all succession stages, except pastures, showed patterns of phylogenetic clustering using both metrics (Fig. 3b,d). Finally, we did not detect differences in NRI or NTI between seasons for amphibians or reptiles.
Phylogenetic diversity among succession stagesDuring the rainy season in reptiles, pastures (z = −3.11, P < 0.05) and intermediate forests (z = 3.54, P < 0.01) had higher values of PD than early forest (Fig. 4a). During the dry season, a tendency towards an increase of PD along succession can be observed from pastures to primary forests, however, only pastures had significantly lower values of PD than primary forests (z = 2.68, P < 0.05; Fig. 4a). We found in amphibians that pastures (z = −2.92, P < 0.05) and young forest (z = −2.84, P < 0.05) had higher values of PD than primary forests in the rainy season (Fig. 4b). We did not detect differences during the dry season. In both amphibian and reptile communities PD was significantly higher in the rainy than in the dry season (reptiles, z=-4.48, P < 0.001; amphibians, z = −2.15, P < 0.05; Fig. 4a,b).
 in (a) reptiles, and (b) amphibians for each succession stage of the tropical dry forest in the study region during the rainy and dry season. Early forest, EF; young forest, YF; intermediate forest, IF; primary forest, PF. Statistically significant differences among treatments are indicated with letters.")
Phylogenetic diversity index (PD; Faith, 1992) in (a) reptiles, and (b) amphibians for each succession stage of the tropical dry forest in the study region during the rainy and dry season. Early forest, EF; young forest, YF; intermediate forest, IF; primary forest, PF. Statistically significant differences among treatments are indicated with letters.
None of the Mantel tests between Euclidian distance and MPD were significant, indicating no spatial autocorrelation (rainy season: amphibians, r = −0.159, P = 0.87, reptiles r = −0.070, P = 0.69; dry season: amphibians, r = 0.031, P = 0.32, reptiles r = −0.160, P = 0.89).
DiscussionContrary to our predictions, we did not detect a consistent pattern of decrease in community relatedness and an increase in phylogenetic diversity across succession for both taxonomic groups. Due to the marked seasonality of the TDF and to the extreme environmental conditions that organisms can experience in deforested areas, differences in NRI between pastures and primary forests in reptiles during the dry season can be explained by environmental filters (Kraft et al., 2014). During the dry season, solar radiation is very intense and few places for shelter or to retain humidity are available. Therefore, species that coexist in pastures might share phenotypic features that allow them to persist in extreme conditions. As the succession progress, phylogenetic distance increases. Thus, unsuitable environmental conditions, such as those of the pastures, probably filter out species that lack adaptations necessary for survival and reproduction (Webb et al., 2002). For example, heliothermic lizards such as Holcosus undulatus, Aspidoscelis lineattissimus, and A. communis are abundant in forested areas, and in ecotones between highly modified and forested habitats, but are less common in pastures since this habitat could exceed their temperature tolerances (Casas-Andreu and Gurrola-Hidalgo, 1993). Primary forests had also four species of snakes (Imantodes gemmistratus, Leptophis diplotropis, Tantilla calamarina, and Crotalus basiliscus), and other species of lizards (H. undulatus and Phyllodactylus lanei), including an iguana (Ctenosaura pectinata), that were not detected in the pastures during the dry season. Conversely, Anolis nebulosus, Urosaurus bicarinatus, and Sceloporus utiformis are dominant species in trees surrounding pastures during the dry season. These species are habitat generalist disturbance-adapted, characterized by a combination of morphological (small size), physiological (thermoconformists), and life-history traits (high fecundity), as well as a fairly generalist diet that allow them to thrive in a wide range of environmental conditions. Differences in PD for reptiles, during the dry season, between pastures and primary forest could be the result of more and diverse microhabitats provided by complex habitats, such as primary and secondary forests under later succession stages, allowing the coexistence of more distantly related species when environmental adversity is higher.
Amphibians showed phylogenetically clustered patterns during the rainy season in the first three succession stages indicated by NRI and NTI. However, the pattern is clearer with NTI, as these succession stages showed significantly higher values than primary forests. This indicates that species are more related from their nearest taxon and therefore, the phylogenetic clustering occur towards the tips of the phylogeny, contrary to NRI which measures deeper divergences (Webb et al., 2002). Communities from the first three succession stages were dominated by species concentrated in Hylidae and Bufonidae, which congregate during the rainy season to mate in ephemeral or permanent water ponds formed mainly in the pastures and early forests. Such is the case of Incilius marmoreus, Triprion spatulatus, Smilisca fodiens, S. baudini, and Trachycephalus typhonius. Conversely, more distantly related species that inhabit intermediate and primary forests are more specialized to live on trees or in the use of forest leaf litter moisture during the rainy season, such as Eleutherodactylus nitidus, Craugastor mexicanus, Agalychnis dacnicolor, and other hylids tree frogs. Moreover, biotic and abiotic conditions required for amphibians to survive (higher levels of humidity, insect abundance, low solar radiation, etc.; Duellman and Trueb, 1994) offered by intermediate and primary forests would capture phylogenetically wider assemblages of species than early succession stages. During the dry season secondary and primary forests showed clustering patterns. It is likely that in pastures, the frequent permanent (artificial) water ponds for livestock promote the coexistence of more distantly related species, avoiding phylogenetic clustering.
Results from PD were not consistent with those of NRI and NTI, showing that primary forests had lower phylogenetic diversity than pastures and young forests. However, these results should be taken with caution because PD do not consider abundance or evenness among taxa, but only the presence or absence of species. Within both taxonomic groups, PD during the rainy season were significantly higher than during the dry season since many amphibians, and some reptiles like Heloderma horridum, several snakes and other species aestivate during the dry season (Secor and Lignot, 2010).
Only few recent studies have evaluated phylogenetic patterns of reptile or amphibian diversity in degraded ecosystems. Our results were similar to those studies as they have highlight the role of niche-based processes (i.e., environmental filtering), explaining structure and diversity patterns of amphibian or reptile communities along successional gradients in fragmented tropical rainforests (Hernández-Ordóñez et al., 2019), converted habitats across the globe (Nowakowski et al., 2018), agricultural landscapes (Ribeiro et al., 2017), seasonal tropical environments at a regional scale (de Araújo Martins et al., 2015), and across large-scale environmental gradients in reptile’s communities (Ramm et al., 2018).
Conservation implicationsThe utility of phylogenetic structure and diversity metrics in conservation biology has been widely discussed in the literature (Faith, 1992; Redding et al., 2008; Cadotte and Davies, 2016; Lean and Maclaurin, 2016), and it has received some important criticism (Winter et al., 2012; Mazel et al., 2018). Despite most studies addressing changes in phylogenetic structure and diversity across succession stages have been implemented in plant communities (Prach and Walker, 2011), studies in animal taxa are also important because can provide insights on how species could respond to direct human disturbances and climate change (Nowakowski et al., 2018). Having more distantly related species in primary and forests in later succession stages may predict ecosystem stability assuring the sufficient ecological strategies in a community to achieve the persistence of the ecosystem under changing conditions (Cavender-Bares et al., 2009). This might occur because phylogetically diverse communities have more potential to fulfill the functional roles in the ecosystem (Flynn et al., 2011; but see Mazel et al., 2018), maximizing resource partitioning. Nevertheless, other habitats with high taxonomic diversity but low phylogenetic diversity could show less functional diversity and probably their evolutionary potential will be low. Pastures become important for the maintenance of phylogenetic diversity in amphibians, probably due to the presence of permanent artificial water ponds. However, pastures could be important as long as primary or secondary forest patches are maintained near water ponds, since amphibians need water and vegetation to survive.
According with our data, we can detect whether lineages are irreplaceable in case of becoming locally extinct, such as some lineages of snakes, the only species of Helodermatidae and Anguidae, as well as tree frogs, that are mainly represented in primary and secondary forests under later succession stages. Finally, our results strengthen the arguments for promoting the conservation and managing of secondary forests under recovery along the TDF distribution. Secondary forests, particularly those in advanced succession stages, provide important resources for wildlife and could be useful in maintaining structural and functional connectivity between protected areas embedded in anthropic landscapes. However, it is important to contemplate that promoting the conservation of secondary forests should not be considered a replacement for the protection of large extensions of undisturbed primary forest that are needed for the long term persistence of reptiles, amphibians and other taxonomic groups (Barlow et al., 2007).
We thank Y. Soto-Sandoval, J. Marroquín-Paramo, J. Rangel-Orozco and N. Lara-Uribe for field assistance, and J. H. Vega-Rivera and the Estación de Biología Chamela for their logistical support. We also tank A. Pyron for sharing the phylogenetic trees used in previous versions of this article, R. Hernández-Guzmán for map in Fig. S1, C. Morán for statistical advice and S. Covarrubias for her photo of A. dacnicolor used in the graphical abstract. Two anonymous reviewers provided useful comments on previous versions of the manuscript. This study was part of the project 2015-255544 funded by CONACyT. Financial support was also provided by the Coordinación de la Investigación Científica, Universidad Michoacana de San Nicolás de Hidalgo.
The following are Supplementary data to this article:

