
The biodiversity knowledge has several deficits. The wallacean shortfall—related to species distribution unknowledge—is one of the most studied shortfalls. It is important to identify gaps and biases in spatial biodiversity knowledge. However, to find out where the main biodiversity deficits are we need to know how the biodiversity spatial sampling changes according to spatial scale. Here we use an extensive dataset of Atlantic Forest primates to test spatial bias as a function of spatial scales and cell-size resolutions. Our findings indicate that the sampling coverage and spatial knowledge of Atlantic Forest primates are biased depending on spatial cell-size resolution and scale. We also show that from a broad-scale perspective (regional and global) primate spatial knowledge is spatially unbiased regardless of cell-size resolution considered. In contrast, in narrow-scale perspectives the knowledge may have or not spatial bias depending on the cell-size resolution. Our results suggest that sampling bias can be present or more pronounced in narrow-scale in a local perspective. Thus, the choice of scale and spatial resolution on ecological studies must consider the potential impacts of sampling bias accordingly to each scale and cell-size resolution.
Current many global patterns of biodiversity are known. However the biodiversity knowledge shortfalls may put noises on them (Hortal et al., 2015). Such knowledge shortfalls are a direct result of the spatial and temporal sampling bias. Some geographic regions are more sampled than others due to the historical patterns of data collection and analysis (Ronquillo et al., 2020). In addition, temporal and spatial sampling biases are strongly influenced by the species detectability, sampling size area, sampling effort (Sheth et al., 2012), and accessibility (Monsarrat et al., 2019). Consequently, these biases can result in inaccurate inferences about biodiversity patterns and unreal conservation and policies tasks (Hortal et al., 2015).
The knowledge about species distributions are a priority task to biodiversity pattern understanding (Gupta et al., 2020). Currently several species occurrence database projects are being developed (Yesson et al., 2007; Hudson et al., 2014). Although large databases shelter a lot of knowledge about biodiversity, there are still gaps and biases to be addressed (Amano et al., 2016). Completeness information (i.e. the percentage of well-sampled communities at a site) becomes extremely important for analysing the composition of communities and the extent of knowledge of biodiversity from narrow-scale perspectives (Boakes et al., 2010; Santos et al., 2019; Sobral-Souza et al., 2021).
There are several factors that play a role in the spatial species distributions both on a large and narrow scale. On a narrow scale, we have the aggregated distribution that occurs when the sampling points are spatially close to each other. Some factors have already been pointed as a causal explanation of the current spatial aggregated distribution of biodiversity data (cities, roads, water bodies, or primary forests) (Almeida et al., 2021; Sobral-Souza et al., 2021). However, on a large scale a random and regular spatial distribution can happen. Random distribution occurs when sampling points are anywhere in the spatial site, that is, when there is no defined spatial pattern (Mentges et al., 2020). A regular distribution occurs when there is a “homogeneous” spacing between the sampling points, generating a sampling pattern of equal distance along the spatial gradient (Brooks et al., 2004).
The knowledge gaps and biases about biodiversity (including completeness index) are scale-dependent (Lobo et al., 2018). The choise of resolution (cell-size) is a priority task to calculate the completeness. The same dataset with different cell-size resolution can indicate different completeness index value (Araujo and Ramos, 2021; Freitas et al., 2021; Lobo et al., 2018), which may generate noise in the analysis of spatial knowledge. Therefore, understanding the completeness index at different size resolutions is an essential task to assess the spatial knowledge of biodiversity and the lack and bias in spatial sampling (Lobo et al., 2018).
Current a series of datapapers of species and/or community occurrences fill gaps in biodiversity knowledge. The AtlanticSeries (available at: https://esajournals.onlinelibrary.wiley.com/doi/toc/10.1002/(ISSN)1939-9170.AtlanticPapers) provides occurrence information of different taxa along the high impacted Neotropical biome, the Atlantic Forest. As the Atlantic Forest biodiversity knowledge is not yet complete such initiatives make it possible to understand the real scenario of Atlantic Forest biodiversity knowledge. The assess of biases and gaps at different scales is now possible to be adress to outline the sampling sites prioritization and highlight which ecological relationships can be established or not with the current quality of existing data (Sobral-Souza et al., 2021).
The Atlantic Forest is one of global hotspots that suffered most from anthropic action and biodiversity loss (Ribeiro et al., 2009; Dirzo et al., 2014). It was historically more sampled than other neotropical forest biomes, as it covers large cities with several research centers (Ribeiro et al., 2009; Tabarelli et al., 2010). The Atlantic Forest historical sampling efforts are correlated with the needs to understanding of natural resources explotation and biodiversity loss over time (Tabarelli et al., 2010). As a result of Atlantic Forest’s habitat loss, currently almost the majority of primate species that are distributed throughout the Atlantic Forest are in some degree of threat according to the IUCN Red List (https://www.iucnredlist.org/). Although historically well sampled the sampling bias of Atlantic Forest biodiversity at different scales are still unknown.
Primates have a well-resolved taxonomy (low Linnean deficit) for which the patterns of diversity and spatial distribution are relatively well understood (Rylands et al., 2012). Primates have a fundamental ecological role as seed dispersers in which they help to regenerate forests (Bufalo et al., 2016; Heymann et al., 2019). This mutualism with plants generated an impulse in the diversification of the group (Gómez and Verdú, 2012) and is likely to drive co-evolution, as recently evidenced for Platyrrhini (Fuzessy et al., 2021). However, today, 75% of primate populations are declining as a result of habitat loss, agriculture, and logging expansion, or due to the direct extirpation caused by hunting and wildlife traffic (Estrada et al., 2017).
Most studies on primates in the Atlantic Forest address issues related to: focused on one or more species as models for testing the effects of habitat loss and fragmentation (e.g.: Chiarello and Melo, 2001; Martinelli, 2014); behavioural studies of a single species or a given primate species group (e.g.: Lyra-Neves et al., 2007); analyses of primate groups (or some species) as dispersers (e.g.: Culot et al., 2017; Passos, 1997); and the effect of large-scale changes (usually due to climatic factors) on their distribution (e.g.: Lima et al., 2019; Raghunathan et al., 2019). Therefore, understanding the spatial knowledge of the Atlantic Forest primate group and how this knowledge changes according to scale and the cell-size resolution is essential to address some macroecological questions properly.
Here, we aimed to analyze the biases and gaps in the spatial knowledge of Atlantic Forest primates at different spatial scales (local, regional and global), based on Euclidean distance between well-sampled sites, and cell-size resolutions. We hypothesize that gaps and biases may present different spatial patterns of aggregation, randomness or scatterness depending of cell-size resolution and spatial scale. We specifically predict that (i) the sampling efforts of primate studies are spatially aggregated in local-scale and high cell-size resolution (1 km²) and not spatially aggregated on regional and global scales and low cell-size resolution and, (ii) the Atlantic Forest sampling coverage varies according to the cell-size resolution.
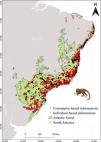
MethodsStudy areaThe Atlantic Forest (Fig. 1) embraces 17 Brazilian states from northeastern to southern Atlantic coast (Ribeiro et al., 2009; Muylaert et al., 2018). This biome is known for its high richness and endemism index, being considered a global hotspot of biodiversity (Myers et al., 2000). However, its original vegetation was extremely modified and fragmented, resulting in only 28% of forest remnants, which are small and disconnected from each other (Joly et al., 2014; Rezende et al., 2018).
Species data
Occurrence records were obtained for the 26 primate species listed by Culot et al. (2019) in the Atlantic Forest. The occurrence records were compiled from published and unpublished sources (Atlantic Primates Occurrence and Atlantic Primates Community) (https://esajournals.onlinelibrary.wiley.com/doi/full/10.1002/ecy.2525#support-information-section), in global biodiversity databases (Global Biodiversity Information Facility (GBIF) and Species Link), and on regional biodiversity sources (Brazilian Biodiversity Information System (SiBBR) and Biodiversity Portal). The Atlantic Primates Occurrence dataset contains individual-based observations of different researches along time and the Atlantic Primate Community is a compilation of sampling data from the community-based studies. We combined all occurrences in a unique database. Afterward, we excluded data without spatial coordinates or species information, as well as duplicate data and data of centroid of the municipality and/or State. We also made taxonomic corrections using The Catalogof Life (https://www.catalogueoflife.org/) database to synonyms search. In total we found 19,771 records and approximately 10,401 records were excluded (Fig. 1).
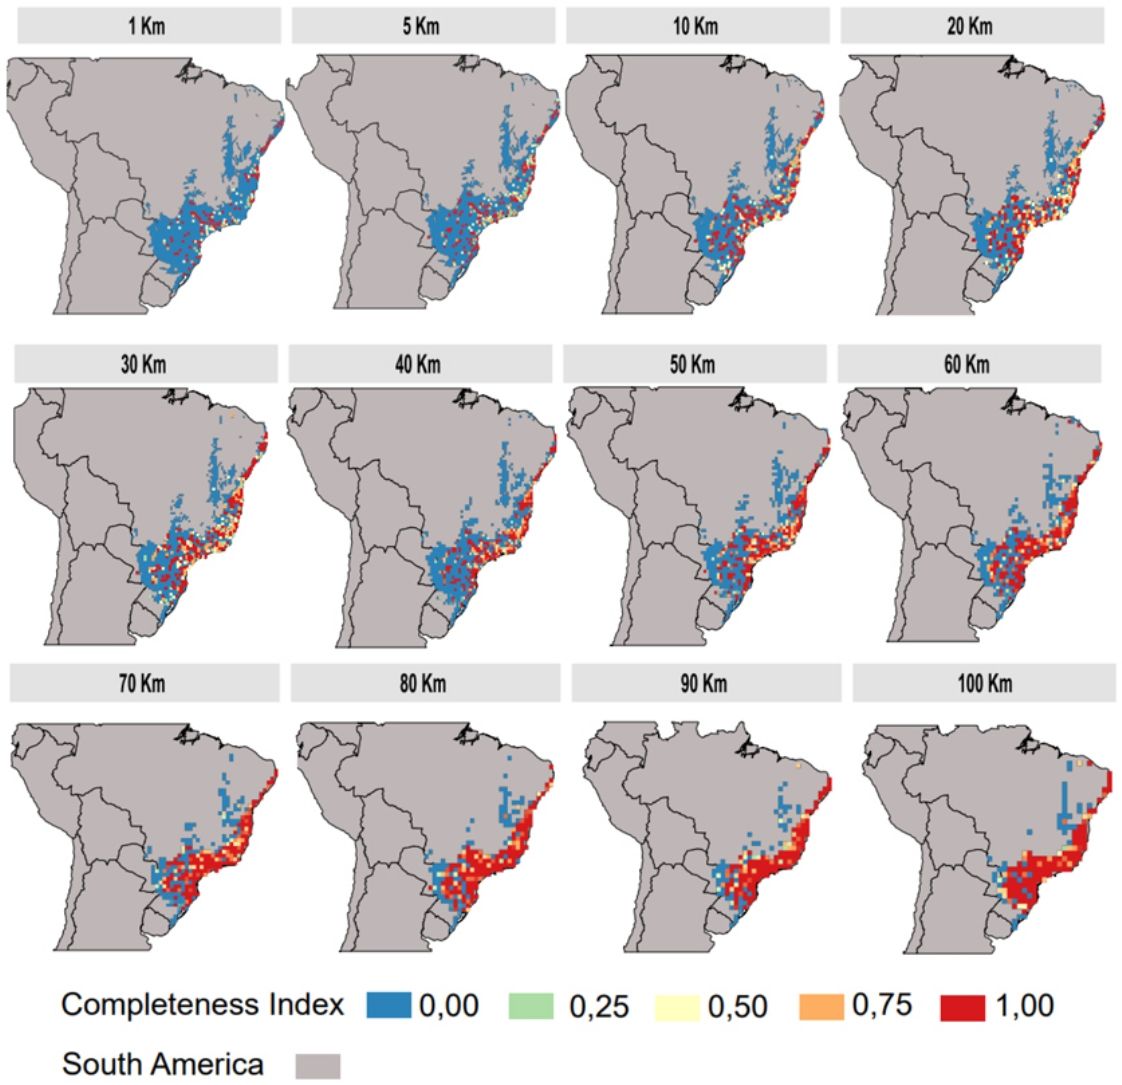
Inventory completeness and cell-size resolutionsWe calculated the primate inventory completeness for Atlantic Forest delimitation based on different cell-size resolutions (100 × 100 km; 90 × 90 km; 80 × 80 km; 70 × 70 km; 60 × 60 km; 50 × 50 km; 40 × 40 km; 30 × 30 km; 20 × 20 km; 10 × 10 km; 5 × 5 km; 1 × 1 km). We used first only information from individual-based occurrences (Atlantic Primates Occurrence, GBIF, Species Link, SiBBR and Portal da Biodiversidade). The inventory completeness for each grid cell (with different cell-size resolution) was estimated by adjusting the species accumulation curve (accumulated number of species by records) to the Michaelis-Menten equation (Clench, 1979; Soberón and Llorente, 1993). The inventory completeness values vary from 0 to 1; values closer or equal to 1 represent the well-sampled sites, whereas values close or equal to 0 as sites with sampling deficit (Lobo et al., 2018). Here, we considered cells as well-sampled when either: (1) they contain more than 20 records (for all databases) (Culot et al., 2019) and/or show an inventory of completeness higher than 0.7 (Francesco Ficetola and Denoël, 2009; Lobo et al., 2018). The completeness analysis was made using KnowBR package from R. Sites available in Atlantic Primates communities database were considered as well-sampled, i.e. with high completeness, based on systematic sampling efforts and similar sampling methods. Thus, our dataset of well-sampled sites contained the high completeness sites of individual-based occurrences sources and all sites of the Atlantic Forest Primates community. The inventory completeness was inferred to each cell-size resolution separately.
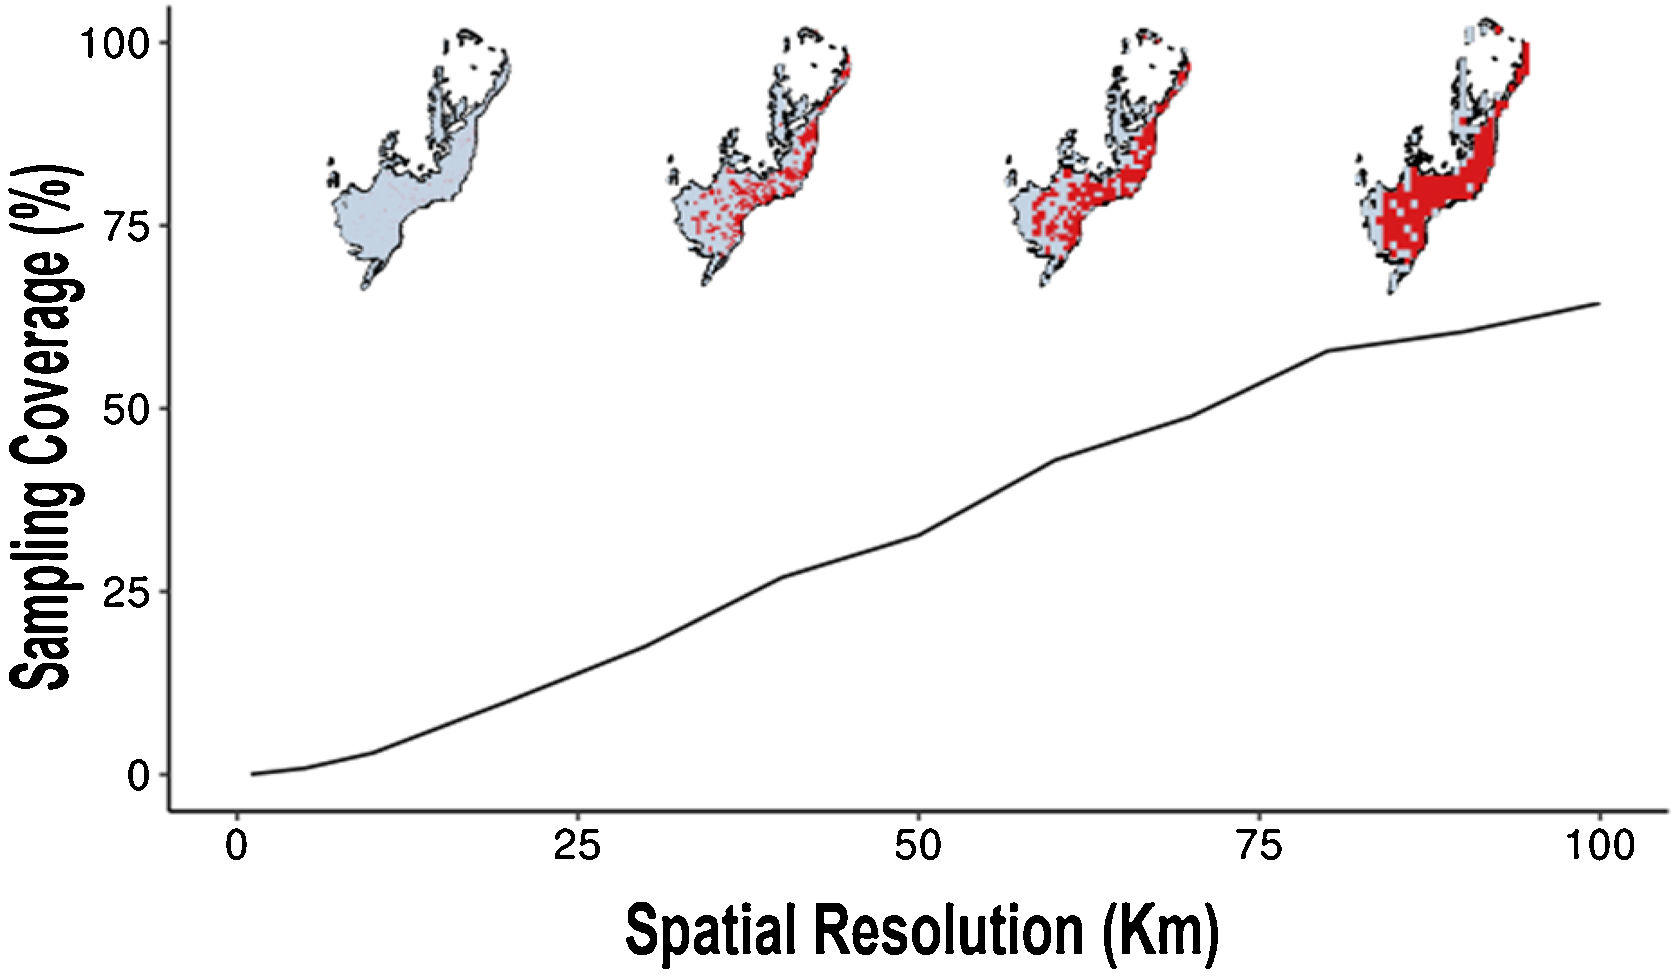
After this, we assessed the Atlantic Forest sampling coverage according to each cell-size resolution. For this, for each resolution, we analyzed the proportion of well-sampled sites in relation to the number of cells of Atlantic Forest.
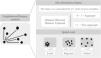
Spatial bias and spatial scale analysisHere, we consider scale as the Euclidean distance between well-sampled sites, a spatial scale of sampling interval. We also consider resolution as synonym of cell-size. The scale can be define using different distance interval between sampling sites (Lima et al., 2020), as local scale (distance between the most nearest neighbor sites), regional scale (distance between intermediate neighbor sites) and global scale (distance between most furthest neighbor sites). So, here we estimated the Atlantic primates spatial bias for different scales and cell-size resolutions. We use the Nearest Neighbor Analysis, which tests the Euclidean distances between a well-sampled site and its nearest neighbor (as sampling interval) (Fig. 2) and how close or far they are compared to a null model. The null model was built randomizing occurrences (the same number occurrences of the primates dataset) through all Atlantic Forest boundaries considering a random distances between the points. This procedure was made 1000 times. The Euclidean distances between the well-sampled sites (nearest neighbors) were standardized to range from 0 to 100%, so that distances <25% of nearest sites were classified as local scale, distances between 25%–75% of neighbors sites as regional scale, and >75% of neighbors sites as global scale (biome scale) (Fig. 2). The distance considered to define each scale class (local, regional and global) varies according to the cell-size of the grid. To test whether the well-sampled sites are aggregated in space, we calculated an index based on the mean of the distances from the nearest neighbor to the well-sampled sites (observed distance) standardized by the expected value if the points were randomly distributed in space (expected distance – mean distance of the null models), then (distance observed/expected distance). The nearest neighbor distance was calculated for each neighborhood order (for the first nearest neighbor, then for the second nearest neighbor, to the nth order – maximum number of well-sampled site) to build a XY plot (X-axis is the index and Y-axis is the scale (neighbor sampling Euclidean distance). Thus, points between 0–1 would be aggregated data, above 1, non-aggregated distribution. In addition, this approach makes it possible to compare the different resolutions, since it generates a standardized value for all resolutions. We run these analysis using KnowBR, tidyverse, cvar and raster R packages.
Results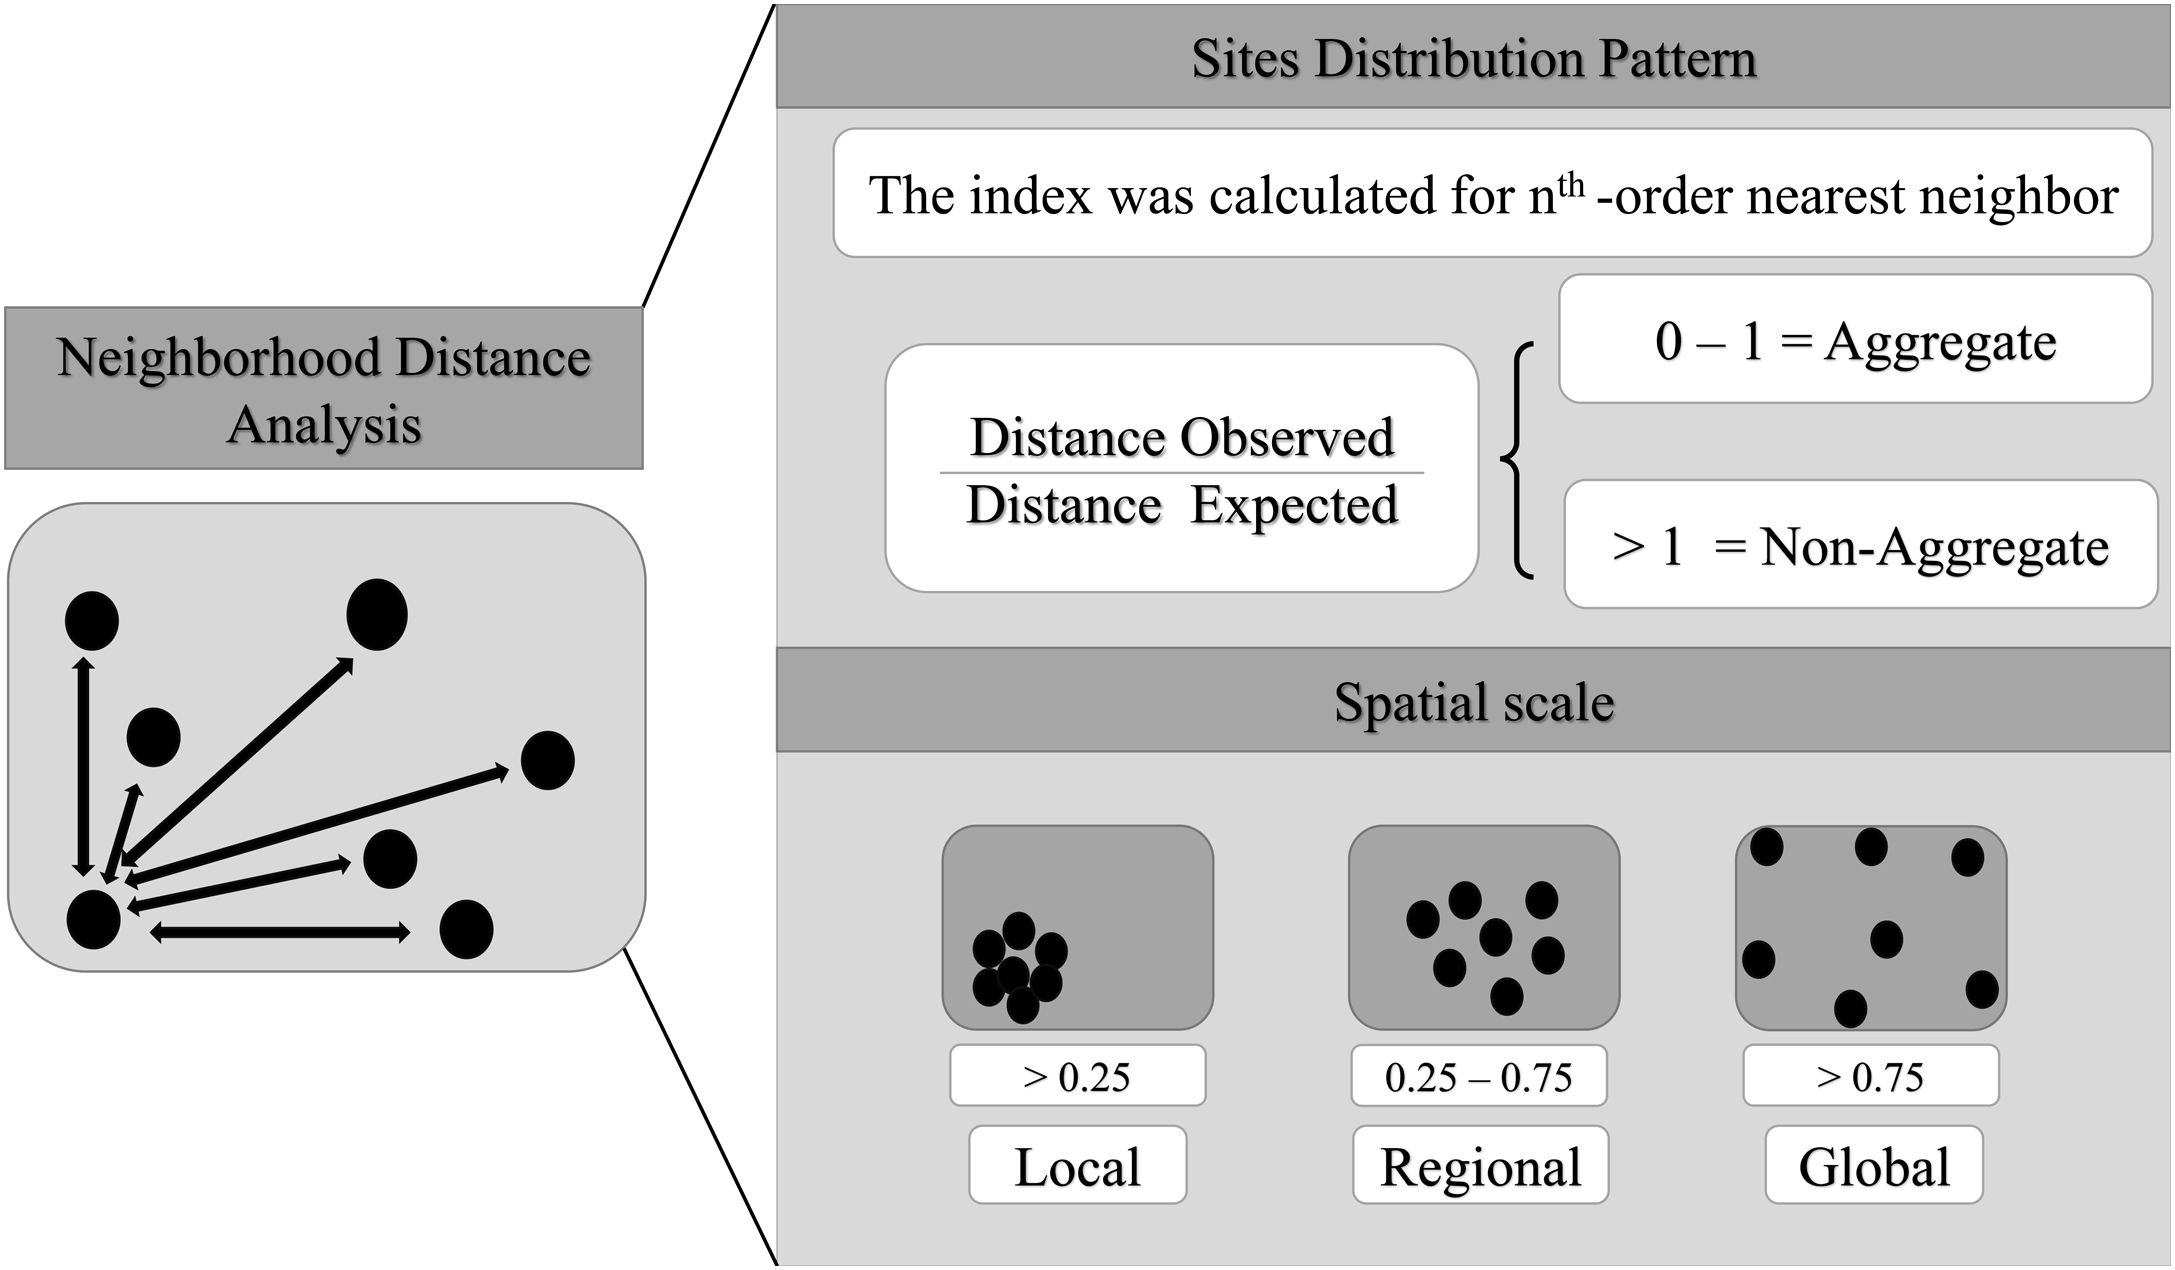
The species occurrence list compiled by Culot et al. (2019) contains 7363 sampling sites of which 1415 are from the Atlantic Primate Community and 5948 from Atlantic Primate individual occurrence records. The occurrences from GBIF, Species Link, SiBBR and Biodiversity Portal totaled 2077 records, after cleaning and were within the spatial limits of the Atlantic Forest (Fig. 1).
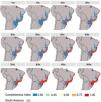
The inventory completeness results highlight that the central region of the Atlantic Forest is well-sampled independent of cell-size resolution (Fig. 3). However, the São Francisco region and the ecotone zones with other Neotropical biomes does not have studies in any of the cell-size resolutions addressed. The southern and northern region of Atlantic Forest are well-sampled depending on the cell-size resolution studied (Fig. 3).
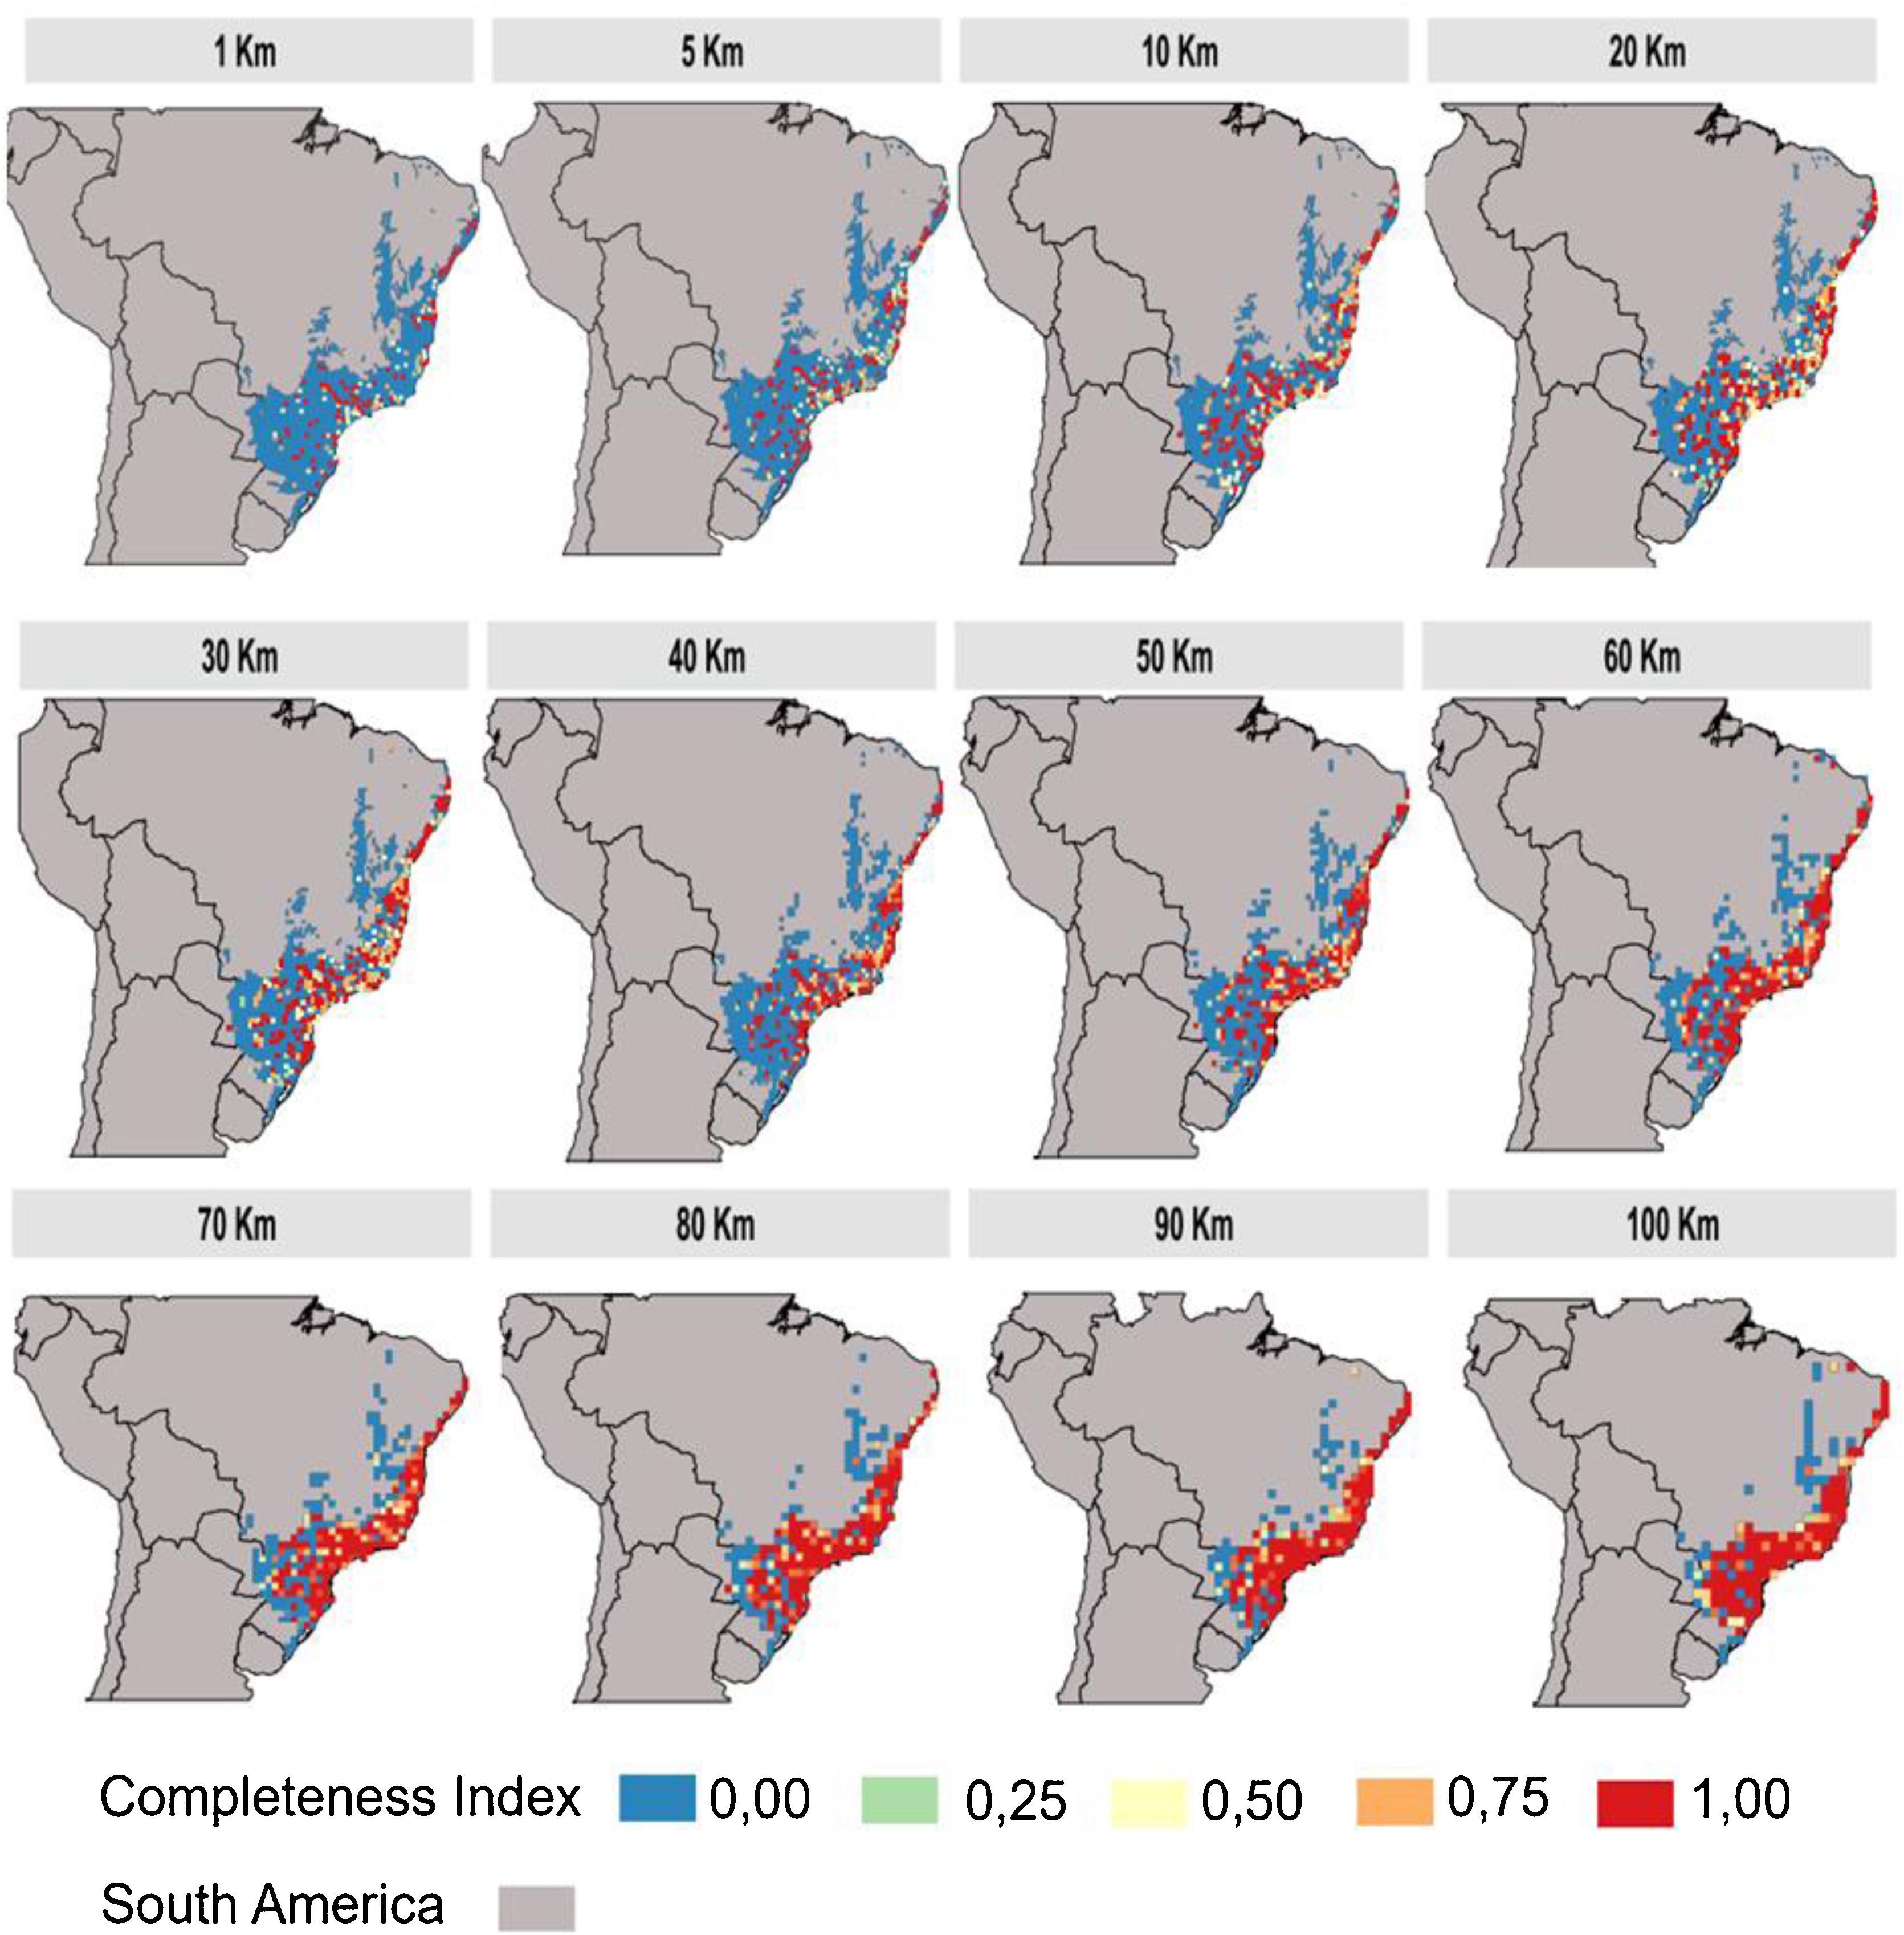
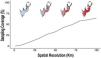
At the 100 km of spatial cell-size resolution, the Atlantic Forest had 65% of sampling coverage (Fig. 4). For other cell-size resolutions when the spatial resolution increases the sampling coverage decreases. For example, the sampling coverage of 90 km of cell-size was approximately 60.5%, a sampling coverage greater than the 1 km cell-size resolution (Fig. 4). Well-sampled sites of Atlantic Forest primate inventory represent only less than 3% of sampling coverage of Atlantic Forest at spatial resolutions below 10 km (10 km, 5 km and 1 km, respectively, Fig. 4). These findings indicate that the spatial resolution directly influences the inventory completeness, the number of well-sampled sites and the sampling coverage of the Atlantic Forest primates.
Regarding the spatial patterns of the well-sampled sites, we found that the data have different biases depending on the spatial resolutions and the scale. At resolutions from 20 km up to 100 km, there are no biases regarding spatial scales, as in these resolutions the distribution pattern of well-sampled sites does not differ from the random distribution (Fig. 5). However, some resolutions (70 km; 50 km; 30 km) showed aggregation bias at large-scale (global; Fig. 5). For spatial resolutions below 20 km, data is aggregated at the local scale, but not at the regional and global scales (Fig. 5).
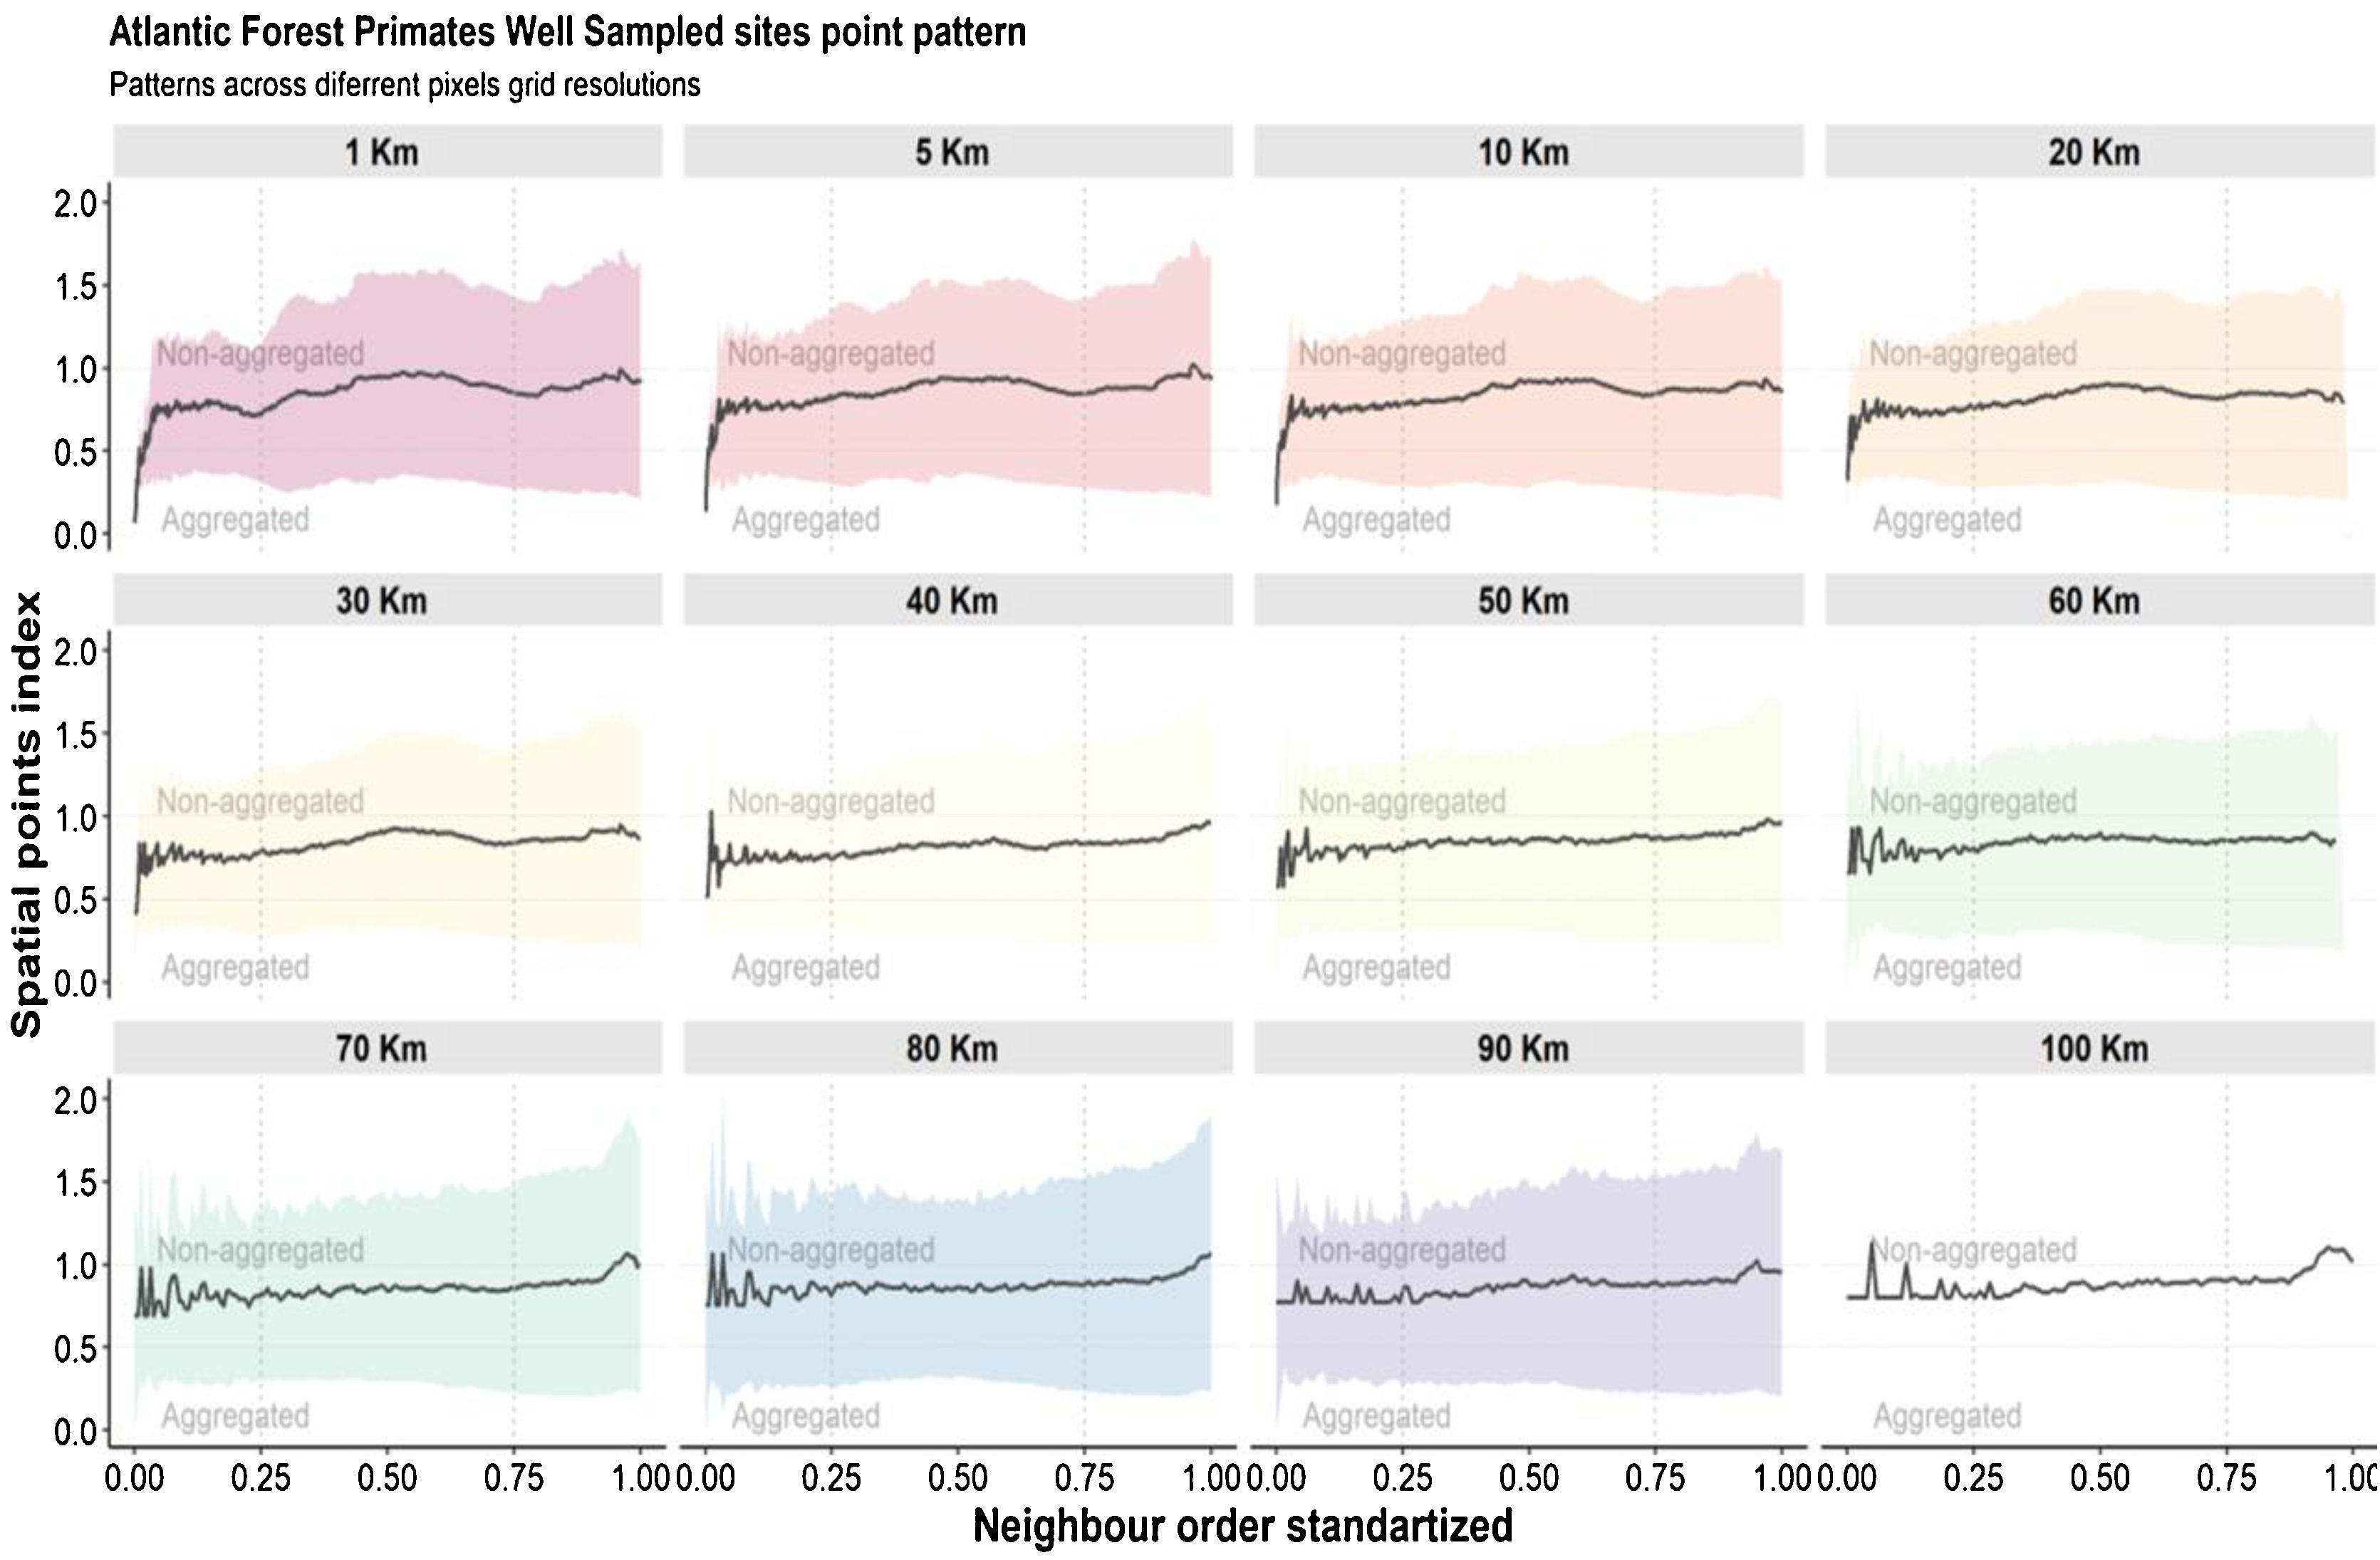
Aggregation index across scale. The black line is values aggregation index and the background shadow is the standarized deviation (according to the expected value—null model). The spatial index (distance observed/expected distance) is shown in Y-axis. The X-axis values represent the scale—distances 0.25 were classified as local scale, 0.25–0.75 as regional scale, and >0.75% as global scale (biome scale).
We found that the spatial knowledge of Atlantic Forest primates has biases that vary according to the study scale and the chosen spatial cell-size resolution. At low cell-size resolutions (100 km - 50 km) and medium cell-size resolution (40 km - 20 km) the well-sampled sites cover approximately 70% and 50% respectively of the Atlantic Forest surface with almost no spatial bias at all scales studied (local, regional and global—see discussion below). However, at high cell-size resolution (10 km - 1 km) the well-sampled sites for primates cover less than 3% of Atlantic Forest surface with aggregated distribution toward local scale and random at the regional and global scale. Thus, our findings also suggest that in broad-scale perspectives (regional and global) the primate’s spatial knowledge is unbiased. In contrast, at narrow-scale perspectives, the knowledge may have bias, depending on grid cell resolution.
The community species composition directly reflects scale-dependent community assembly processes (Pearson and Dawson, 2003). From a broad-scale perspective, community assemblies are mainly affected by environmental filtering (most climate conditions). In contrast, community assembly processes are driven by density-depending processes on a narrow scale (such as biotic interactions and landscape effects) (Cavender-Bares et al., 2009). Bias in data collection can strongly affect ecological studies, having different impacts on different scales. For the Atlantic Forest primates, our results indicate that the data available can be used on regional and global scales projects at a broad range of cell resolution based on climate conditions, with less concern about sampling bias. However, for studies addressing process at local scales, with cell resolution of up to 20 km (i.e. habitat loss and fragmentation), it is necessary to be aware of the impact of spatial bias in sampling effort in these resolutions.
The spatial aggregation of narrow-scale data is due to the lack of well-sampled sites for the entire length of the Atlantic Forest (Sobral-Souza et al., 2021). Historically, samples of different taxonomic groups were carried out to sample as many species as possible (Hortal et al., 2015). This predilection may have caused a sampling bias (following the premise of the species-area theory) in which it prioritized places with larger fragments since these habitats should have more species (Connor and McCoy, 2001). In the Atlantic Forest, the largest fragments renmants are spatially clustered (Ribeiro et al., 2009; Sobral-Souza et al., 2021) and as the primate inventories is forest-dependent there is an aggregation of primate well-sampled sites that, in a broad-scale, has a similar pattern of Atlantic Forest renmants.
The use of low cell-size resolutions at global scales could generate over-aggregation or non-aggregated effects, that is, this effect consists in that at each randomization the transition region with other biomes can lose or gain the well sampled points. These effects are possibly generated by the choice of delimitation of the Atlantic Forest, that is, considering only the cells (pixels) that contain 100% of their area covered by the Atlantic Forest excluding cells covered also by other biomes. An alternative to solve the transition factor between biomes is to consider different percentages of the Atlantic Forest cover by pixels, to check for changes in this pattern. Another possibility would be the use of high-resolution cells (10 km) at regional scales since the pixel is smaller so the strength of this factor ends up buffered. Yet, using medium resolution cells (20 km) at any scale (local, regional or global) would be considered the most suitable for macroecological studies with the primate groups (Fig. 3) since the effects of both local and global scales do not directly interfere in the results of this specific resolution.
The central region of the Atlantic Forest is well sampled for having extensive conservation units (e.g.:Serra do mar), and these conservation units are spatially aggregated (Sobral-Souza et al., 2021). Unlike well-sampled areas, the São Francisco region and the ecotone zones need to be more sampled. The possible explanation for the lack of sampling is the accessibility to these sites (Zwiener et al., 2021) and the occurrence of open vegetation (excluding the majority of Atlantic Forest primate species). For those sites that are well-sampled depending on the cell-size resolution used or with intermediate inventory completeness (e.g.: southern and northern regions of the Atlantic Forest) making an effort for these areas to increase the number of sampling at the site becomes extremely important.
In summary, our findings open the opportunity for new studies assessing the priority areas for future sampling effort in a way to decrease spatial bias and the Wallacean shortfall. Additionally, future studies should focus on the assessment of the amount of forest habitat and deforestation within sites that contain high completeness, as these processes are important to maintain species and the quality of the information of such sampling sites. More, we also highlight the importance of understanding the inventory completeness and the spatial bias based on different scale and cell-size resolution as a form to validate the macroecological inferences.
Conflict of interestThis work submitted to Perspectives in Ecology and Conservation is an original unpublished work, and is not being considered for publication elsewhere. We also wish to confirm that there are no known conflicts of interest associated with this publication and there has been no significant financial support for this work that could have influenced its outcome. We confirm that the manuscript has been read and approved by all named authors.
All authors have made substantial contributions to the conception, interpretation, writing, review, and editing of the manuscript.
We thank Dr. Domingos Jesus Rodrigues and Dr. Thiago Junqueira Izzo for suggestions along manuscript building. We also thank two anonymous reviewers and Prof. Dr. José Alexandre F. Diniz-Filho for the critical manuscript revision. We thanks the Macroecology and Biodiversity conservation Lab (MacrEco) participants. NBS thanks the National Council for Scientific and Technological Development (CNPq) for the master's scholarship. TSS thanks the PROAP/UFMT (coordination of support to postgraduate studies at the Federal University of Mato Grosso) for financial help. MCR thanks to FAPESP (processes #2013/50421-2; #2020/01779-5; #2021/08534-0; #2021/10195-0) and National Council for Scientific and Technological Development - CNPq (processes #442147/2020-1; #402765/2021-4; #313016/2021-6) for their financial support.