


The third largest Biodiversity Hotspot of the world, Mesoamerican forests are declining due to human pressures. Based on species distribution models calibrated for 1224 native tree species in Mesoamerica, we identified high-value forest conservation areas at the resolution of a 10km×10km cells using the Zonation Reserve Selection software, and investigated whether these high-value forest conservation areas are well represented by the World Database on Protected Areas network. We had three key findings. First, dry forest is the least protected biome in Mesoamerica (4.5% protected), indicating that further action to safeguard this biome is warranted. Secondly, the poor overlap between protected areas and high-value forest conservation areas found herein may provide evidence that the establishment of protected areas may not be fully accounting for tree priority rank map. Third, high percentages of forest cover and high-value forest conservation areas still need to be represented by the protected areas network. Because deforestation rates are still increasing in this region, Mesoamerica needs funding and coordinated action by policy makers, national and local governmental and non-governmental organizations, conservationists and other stakeholders.
Mesoamerican forests are the third largest among the of the 34 global biodiversity hotspots. This global hotspot with about 226,004km2 of forest remaining (Gardner et al., 2009; FAO, 2011), provides a land bridge linking North and South America, it is home to nearly 5000 endemic plant species and harbors about 8% of the world's biodiversity (Myers et al., 2000; Conservation International, 2011). Although, Mesoamerican forests are one of the most endangered ecosystems in the tropics (Sánchez-Azofeifa et al., 2014) due to high rates of forest loss and fragmentation (Chacon, 2005), there is still considerable opportunity for conservation action.
Given that most future scenarios project high levels of forest clearance and fragmentation in Mesoamerica (Calvo-Alvarado et al., 2009), spatial conservation prioritization approaches could help direct forest loss away from important areas. Spatial prioritization approaches use spatial analysis of quantitative data to identify priority areas for conservation and to provide support for effective conservation planning and management (Wilson et al., 2009). Prioritization can be based on scoring or on complementarity. The scoring approach identifies areas with the high scores (e.g. species richness) as priority areas for conservation (Pressey and Nicholls, 1989). This method, however, is inefficient when areas with the highest scores support similar groups of species (Moilanen et al., 2009). Complementarity-based approaches, such as Zonation (Moilanen et al., 2009), produce a hierarchical prioritization of the conservation value of a landscape. These values are often used to design an optimal configuration of a comprehensive network of priorities areas for biodiversity conservation (Moilanen et al., 2009).
Priority rank of a landscape may be also useful to identify potential new protected areas (PA) or evaluate the efficiency of existing PA networks (Moilanen et al., 2009). PA networks are a primary strategy to conserve forest biodiversity. Rodrigues et al. (2004) suggested that current PAs are insufficient to represent biodiversity, but did not identify where additional PAs should be located to improve conservation targets. For Mesoamerican forests, there is no map of areas with exceptional and irreplaceable concentrations of tree species – which we will refer herein to as high-value forest conservation areas (FCAs) – and no assessment of whether such areas are well protected.
One impediment to such a map is the generally low quality, incompleteness, and spatio-temporal bias of the observed richness data (Cayuela et al., 2009). Species distribution modeling (SDM) can partly overcome this problem by predicting the distribution of individual species by relating sites of known occurrence (and absences, if available) with environmental predictors such as climate, topography or landcover (Guisan and Zimmmerman, 2000). SDMs outputs are presence probability maps of each target species that can be also converted into presence–absence maps (binary maps) using a threshold. The use of SDM for spatial prioritization conservation has growing rapidly in recent decades (Elith and Leathwick, 2009, and references therein). Reserve selection algorithms can take advantage of SDM outcomes to prioritize sites based on expected ability of each site to support multiple species (Moilanen et al., 2009). Using SDM results, reserve selection algorithms can assign a conservation value to each cell ranging from 1 (representation goals cannot be met without that cell) to zero (the cell is not needed to meet representation goals) (Moilanen et al., 2009).
The goals of this study were: (1) quantify how well the PAs of Mesoamerica are protecting the different forest types present in the area; (2) describe map of tree priority rank and identify FCAs; and (3) evaluate if there are conservation gaps in the PAs of Mesoamerica in relation with these FCAs, and propose priority forest conservation areas (PFCAs) that would efficiently represent tree species that are not protected in the existing PA networks. To accomplish these goals, we used SDMs and the complementarity-based algorithm in Zonation software. Finally, we assessed the relationship between FCA and the PA network to identify potential tree conservation gaps.
Material and methodsThe geographic range for this study is the Mesoamerican region, which extends from Panama to southern Mexico, including the states of Colima, Jalisco, Quintana Roo, Yucatan, Campeche, Tabasco, Veracruz, Chiapas, Oaxaca, Guerrero, and Michoacán (Fig. 1). Mesoamerica is a region of great geographical, ecological, climatic and cultural biodiversity with an area of ca. 1,130,019km2. This small region encompasses all subtropical and tropical ecosystems from central Mexico to the Panama and it is considered a center of origin and corridor for terrestrial species (CCAD, 2002; Conservation International, 2011). Mesoamerica also encompasses five biomes, more than 60 forms of vegetation and 41 ecoregions – including pine forests, dry forests and rainforests with annual precipitation of more than 7m (CCAD, 2002). During the last 30 years, great efforts have been made to conserve representative samples of their ecosystems. More than 3800 PAs, including National Parks and wilderness areas, were declared in the region (CCAD, 2002; IUCN and UNEP-WCMC, 2013).
 used to capture the complete response curves of the target species, the geographic distribution of the World Database on Protected Areas (WDPA) network (B) and the geographical distribution of WWF Terrestrial Ecoregions map (representing the moist, dry and coniferous forest biomes) (C) in Mesoamerica.")
Study area representing the whole American continent (A) used to capture the complete response curves of the target species, the geographic distribution of the World Database on Protected Areas (WDPA) network (B) and the geographical distribution of WWF Terrestrial Ecoregions map (representing the moist, dry and coniferous forest biomes) (C) in Mesoamerica.
We obtained 45,032 presence–absence records for 2793 tree species present in Mesoamerica from the International Forest Inventory Network (BIOTREE-NET, Cayuela et al., 2012). We also downloaded 742,385 presence-only records of the same tree species from the Global Biodiversity Information Facility (GBIF, www.gbif.com) over the whole American continent to encompass the entire distribution range of each species.
We selected eight environmental variables influencing the distribution on tropical trees in the study area (Benito et al., 2013): mean diurnal temperature range, minimum temperature of coldest month, precipitation of wettest month, precipitation of driest month, precipitation seasonality (Hijmans et al., 2005), human footprint (Sanderson et al., 2002), average and standard deviation of the normalized difference vegetation index (NDVI), derived from the Global Inventory Modelling and Mapping Studies (GIMMS) for the period 1981–2006 (Tucker et al., 2005), and topographic diversity, calculated from the SRTM digital elevation map (USGS, 2004). We obtained the World Database on Protected Area (WDPA) from the Protected Planet database (IUCN and UNEP-WCMC, 2013). This dataset is considered the most complete global spatial database on terrestrial and marine PAs available and includes all nationally designated (e.g. National Parks) and internationally recognized protected areas (IUCN and UNEP-WCMC, 2013).
We used GlobCover version 2.3 (GlobCover, 2009) to map forest extent across Mesoamerica. GlobCover provides consistent information on land cover across the globe at a 300-m pixel resolution, and a measured accuracy of 77.9% (GlobCover, 2009). According to our previous analysis, six forest classes occurred in the study region (supplementary Table A.1). We overlapped this forest extent map with the WWF Terrestrial Ecoregion map (Olson et al., 2001) to produce a map of three broad forest types (moist broadleaf, dry broadleaf, and coniferous). We intersected WPDA with the forest type maps to calculate the percent of protection of each forest type.
Supplementary material related to this article can be found, in the online version, at doi:10.1016/j.ncon.2015.02.001.
We followed the recommendations of Benito et al. (2013) to prepare the dataset for reliable species distribution modeling: (1) removed duplicate records; (2) set a minimum distance of 30km between consecutive presence points for each species to reduce the potential effects of spatial autocorrelation and sampling bias, and (3) discarded species with <30 records. As a result of this process, a total of 249,090 records of 1224 species were used to generate SDMs.
We used Random Forest (Breiman, 2001) to build species distribution models (SDMs) required to reach our objectives. Random Forest is an ensemble classifier based on decision trees able to fit complex nonlinear responses from high-dimensional data (Breiman, 2001). This algorithm has showed its suitability to fit accurate models for Mesoamerican trees, performing better than 18 other SDM algorithms (Benito et al., 2013). We used the default configuration of Random Forest, which generates 500 bootstrapped random subsets of predictors and cases to generate a single regression tree for each subset. To produce a result for a single case (a given cell), the algorithm computes the mode value for that case across the complete set of regression trees. To fit the SDMs we used the R package ‘dismo’ (Hijmans et al., 2013).
To capture the complete response curves of the target species and avoid working with truncated ecological niches, the modeling area comprised the whole American continent (Fig. 1A). The spatial resolution was 5′ (∼10×10km) and the total number of cells was 590,998. Once the SDMs were built, the results were clipped to the Mesoamerican region (Fig. 1B). The number of cells (10×10km grid cell) used for further analyses in Mesoamerica was 12,245.
To evaluate the SDMs we calculated AUC (Fielding and Bell, 1997) using the ‘evaluate’ function of the ‘dismo’ package. To do so, we applied k-fold partition with five groups and 5000 pseudo-absences.
Identification of FCA and tree conservation gapsWe used the reserve-selection software Zonation (version 4) (Moilanen et al., 2009) to produce a hierarchical prioritization of cells. Zonation starts with all cells tentatively ‘reserved’ and iteratively removes cells that are least needed to maintain core areas of each species. At each step, the Zonation algorithm minimizes biological loss by removing the least-needed cells (e.g. low probability of occurrence for the species with the smallest remaining ranges) remaining in the tentative solution whereas the most important cells are kept until the end. As a result, Zonation produces a hierarchy of cell removal throughout the landscape based of the priority rank of sites, accounting for complementarity (Moilanen et al., 2009). Cells receive a score between 0 and 1; values close to one indicate cells removed in the last state of the process whereas values close to 0 indicate cells removed early.
We applied the basic core-area Zonation on each species’ predicted distribution (species predicted solution) in Mesoamerica to prioritize nested core sets of cells of all species; we used it to identify patterns of FCAs across Mesoamerica. We considered cells within the top 15% of priority rank as FCAs, the most efficient reserve network for representing trees, ignoring threats, connectivity and variation in cost of conserving land. We chose this target to reflect performance of WDPA in Mesoamerica at levels as low as the current extent of the world's protected areas (ca. 13% of land area – Bertzky et al., 2012). We considered FCAs outside the WDPA network a gap for tree conservation (priority FCAs, PFCAs).
Because species occurrences were not available for all 12,245 cells, the efficiency of the species predicted solution could not be evaluated. Therefore, we selected 6340 cells with species occurrences to evaluate how well Zonation, using predicted distributions from SDMs, prioritized sites that contained known species locations. Specifically, we conducted 2 runs of basic core-area Zonation on these 6340 cells, namely a direct solution using species’ occurrences, and representing priority rank, and a surrogate solution using predicted distributions.
We used the Species Accumulation Index, SAI (Rodrigues and Brooks, 2007), to evaluate the efficiency of the predicted solution. SAI was expressed as: SAI=(S−R)/(O−R), where S represents the number of species represented in a set of sites using the surrogate (predicted solution), O represents the largest number of species that can be represented in the same set of sites (direct solution) and R represents the mean number of sites in the same number of randomly selected sites. We accumulated cells in a random order (1000 times) and at each step we calculated the number of species represented in the randomly selected cells. These values were used to calculate the mean value as R and a 95% CI on R. SAI varies from −∞ to 1; negative SAI indicates a worse than random result, 0 indicates random performance, and a positive SAI is a measure of efficiency; e.g. SAI of 0.7 indicates that the surrogate was 70% as effective as the optimal solution in its ability to improve on random selection of sites. We calculated SAI at 10%, 15%, 20%, 25%, 30% and 35% of the landscape hypothetically reserved. Finally, we used the mean of these six SAI values as an overall estimate of surrogate performance. Fig. S1 describes the steps taken to build SDMs and to identify FCAs and PFCAs in Mesoamerica.
Supplementary material related to this article can be found, in the online version, at doi:10.1016/j.ncon.2015.02.001.
Flowchart of steps taken to build species distribution models (SMDs) (dark grey boxes), to assess the priority rank solution based on SMDs for species representation (light grey boxes), and the identification of Forest Conservation Aras (FCAs) and Priority Forest Conservation Aras (PFCAs) in Mesoamerica (black boxes).
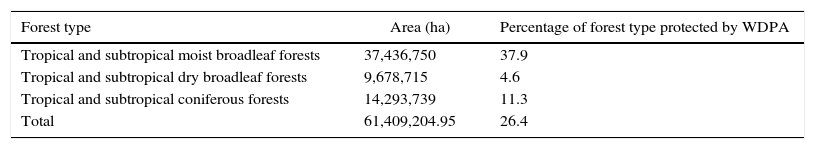
About 26.4% of Mesoamerican forests were represented in the WDPA network. Moist forests were the best represented (37.9%), whereas <4.6% of dry forests were represented in the WDPA (Table 1).
Description of the percentage of forest-protected area by the World Database on Protected Areas (WDPA). Forests were classified according to the WWF Terrestrial Ecoregions map (Global 200 Ecoregions dataset).
| Forest type | Area (ha) | Percentage of forest type protected by WDPA |
|---|---|---|
| Tropical and subtropical moist broadleaf forests | 37,436,750 | 37.9 |
| Tropical and subtropical dry broadleaf forests | 9,678,715 | 4.6 |
| Tropical and subtropical coniferous forests | 14,293,739 | 11.3 |
| Total | 61,409,204.95 | 26.4 |
SDMs performed well, with average AUC of 0.91 (range 0.72–0.99), and therefore, SDMs of all species were used to calculate priority rank.
Considering the 6340 cells with species occurrences, the direct solution required 71 cells (1.1%) to represent 100% of species at least once, compared to 2046 cells (32.2%) for the random solution (Fig. 2). The surrogate solution, using predicted distributions from SDMs, performed well, with average SAI of 0.94. That is, selecting cells with the highest priority rank from the predicted solution represented Trees 94% as efficiently as the direct solution compared to random selection of sites.
, and for the solution using the proportion of any species’ predicted distribution (species predicted solution). The random solution and the 95% confidence interval (in gray) are also showed.")
We then applied the surrogate to all 12,245 cells to identify FCAs. Higher priority rank and FCAs according both solutions occurred in moist forests of Panama and Costa Rica, in dry and coniferous forests of Mexico, and in moist and coniferous forests of Nicaragua. Secondary peaks of high priority rank were observed in moist forests of Panama and Mexico (Fig. 3A). Most FCAs occurred in moist forests of Panama and Costa Rica, in dry and coniferous forests of Mexico, and in moist and coniferous forests of Nicaragua. Secondary peaks of high priority rank were observed in moist forests of Panama and Mexico (Fig. 3B).
, forest conservation areas (FCAs) (B) and priority forest conservation areas (PFCAs) (C) in Mesoamerica. The green and black cells in (C) indicate areas already represented by the current protected areas network and PFCAs in Mesoamerica, respectively.")
Biogeographical patterns of tree priority rank (A), forest conservation areas (FCAs) (B) and priority forest conservation areas (PFCAs) (C) in Mesoamerica. The green and black cells in (C) indicate areas already represented by the current protected areas network and PFCAs in Mesoamerica, respectively.
A poor overlap between FCA and PA cover was observed. Of the 1837 FCA cells, 1031 (56.1%) cells were not represented by protected areas – priority forest conservation areas (PFCA). The spatial distribution of these PFCA showed that the highest number of these cells was located at dry and coniferous forests of Mexico and moist forests of Panama (Fig. 3C).
DiscussionIn our knowledge, this is the first study identifying high-priority conservation areas of tree species across Mesoamerica. Despite the large investment in protected areas in Mesoamerica, results indicated that most FCA is poorly protected. Only 4.6% of dry forests and 11.3% of coniferous forest are covered by PAs, a result that is consistent with previous analyses in different parts of America (Portillo-Quintero and Sánchez-Azofeifa, 2010); thus these forests require more conservation action. Tropical dry and coniferous forests support many endemic species and relict taxa and also these forests are regarded as one of the most threatened of all key tropical forests (Sánchez-Azofeifa et al., 2014). The intensive anthropogenic disturbance is one of the main causes of tropical dry forest loss. About, 72% of the tropical forests have already been converted to urban or agricultural uses (Portillo-Quintero and Sánchez-Azofeifa, 2010). The consequences of this action are mainly for wood extraction, and cattle expansion (Fajardo et al., 2005), resulting in the highest rates of deforestation of dry tropical forests in the world (Portillo-Quintero and Sánchez-Azofeifa, 2010). Similar to dry forests, other Mesoamerican forests also face high deforestation rates (Chacon, 2005).
Although the 26% of forests covered by PAs (Table 1) is higher than the Conservation on Biological Diversity (CDB) target of at least 10% of the major ecosystem types (Schmitt et al., 2009), many studies suggest that the 10% goal is not sufficient to maintain viable population of native species, represent ecosystems diversity and increase resilience of ecosystems to environmental change (Noss et al., 2012). The 10% target – like the 17% target at Nagoya in 2013 – is not grounded in ecological analysis, but rather reflects what is considered socially and economically acceptable.
More importantly, even with 26.4% of forest habitat in the proposed PA network, most of areas identified as FCA were not protected, which suggest that more efforts are necessary to fill these gaps in Mesoamerican forests. Tropical forests are still underrepresented by PA (Portillo-Quintero and Sánchez-Azofeifa, 2010). For example, Mexico harbors the largest extent of the American tropical dry forests (38% – 181,461km2), nonetheless, only a 0.2% of its extent is protected (Olson et al., 2001; Portillo-Quintero and Sánchez-Azofeifa, 2010).
In the view of our results, we believe that our analyses provide additional insights into the conservation needs for Mesoamerica by identifying priority areas for forest conservation. We acknowledge, however, that priorities areas for conservation are not always designed with the scale at which tree priority rank were measured. We also recognize that conservation prioritization often takes place at smaller extent and finer grain sizes. Nevertheless, most of the trees occurring in Mesoamerica are widely distributed across the continent, requiring a trans-frontier program. Thus, conservation policies must address common responsibilities of the Mesoamerican countries using a large-scale approach. Rather than use this coarse results for a spatial prioritization conservation plan in Mesoamerica, we believe that conservation policy-makers could use FCA as windows to schedule the implementation of fine scale conservation activities, such as development of conservation policies or expansion of PA network (or other form of protection) (Wilson et al., 2009). New PA based on such information may play a key role for halting biodiversity loss while acting as corridors that attempts to assure gene flow and migration between priority areas (Dulloo et al., 2008).
Maps of FCA may be also useful for ecological restoration. Restoring tropical forests has become a priority because they are becoming increasingly rare, have the third highest forest cover loss, and contain high levels of species diversity and endemicity, where its conservation is essential (Sánchez-Azofeifa et al., 2014). Interactive maps of priority rank, FCA and PFCA are available in KML application for Google earth format.
Significant progress toward tropical biodiversity conservation can be achieved by improving species and habitat representation by conservation actions. Our results have three key implications for conservation of tree diversity in Mesoamerica. First, dry forest is the least protected biome in Mesoamerica and had the highest deforestation rate in recent decades (Hansen et al., 2013). Thus, urgent actions to protect this biome are required. Secondly, the poor overlap between PAs and FCAs found herein may provide evidence that the establishment of PAs may not be fully accounting for tree priority rank map to enhance the performance of PAs network. Third, FCAs provide an efficient way to expand the PA network. Efficiency is important given limited funding for conservation and on-going deforestation.
Conflicts of interestThe authors declare no conflicts of interest.
This study was supported by project BIOTREE-NET (BIOCON08_044) funded by Fundación BBVA.

