


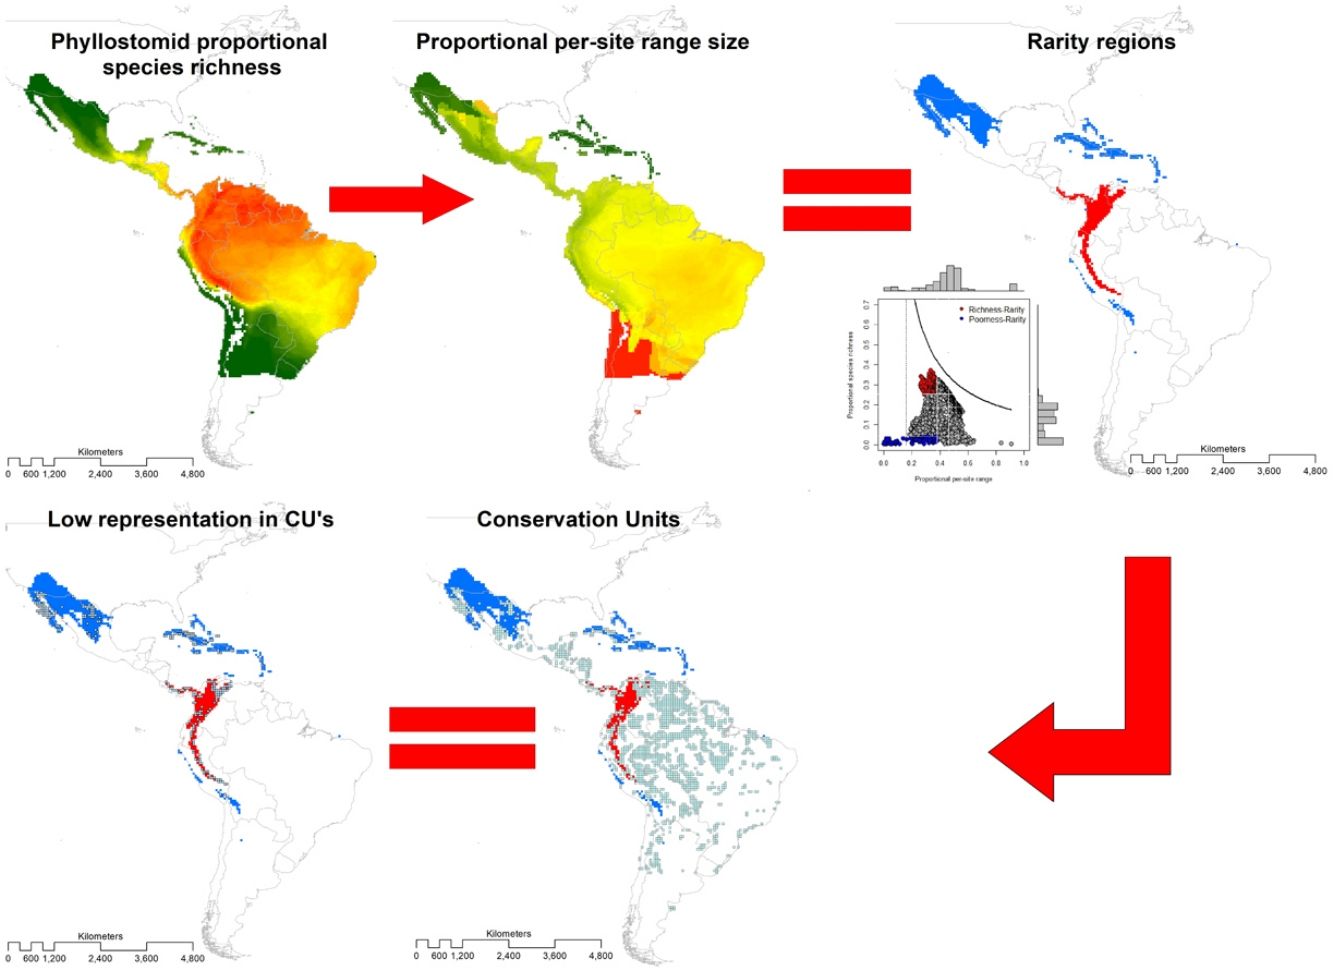
Area-based strategies for conservation include defining species richness and rarity hotspots. However, excluding vulnerable species (e.g., with restricted distribution and categorized as threatened), in establishing such hotspots may limit their representativeness, so the convenience of asserting them has been widely debated. To inform conservation assessments for the New World leaf-nosed bats (Chiroptera: Phyllostomidae), we identified hotspots based simultaneously on species richness and rarity of 214 species. We projected species range maps on a 0.5° × 0.5° longitude-latitude grid, from which we built a presence-absence matrix with 6951 sites. Using range-diversity plots, we described richness-rarity hotspots (sites with high species richness and presence of rare species) and poorness-rarity hotspots (with low species richness and presence of rare species). We assess the representativeness of the hotspots within established protected areas using the World Database on Protected Areas. The richness-rarity hotspot was located in the Andean zone from Peru to Panama within which 46 species of phyllostomid bats are distributed and 37% of its surface is protected. While the poorness-rarity hotspot was located in the northern region of Mexico and the Caribbean with 50 phyllostomid bats species and 19% of its surface protected. We hope that our analysis represents a relevant tool for the conservation of phyllostomid bats, which provide several ecosystem services and are currently facing different threats derived from anthropogenic activities.
Species vulnerability to extinction is primarily determined by their range size, habitat specificity, and local abundance (IUCN, 2019), a triad that produces different forms of rarity (Rabinowitz, 1981). Although species range size may contain biases associated with the methods for its construction (see Burgman and Fox, 2003), this variable can be measured with less uncertainty compared to habitat specificity or local abundance, which may be affected by data availability and sampling bias (Yu and Dobson, 2000). Indeed, data about species abundances is not easy to obtain (Figueiredo and Grelle, 2009), thus scientists are forced to search alternatives for a reliable evaluation that can be correctly applied in conservation plans. Range size can be used as a proxy of abundance, due to the positive relationship with this variable (Lawton, 1993) that is, in turn, negatively associated with vulnerability to extinction (Harnik et al., 2012). Another characteristic positively associated with range size that may influence extinction risk is diet (Boyles and Storm, 2007; Saldaña-Vázquez et al., 2021), which tends to be similar between closely related species and thus show strong phylogenetic signal (Datzmann et al., 2010; Monteiro and Nogueira, 2011; Olalla-Tárraga et al., 2017). Range size has therefore been used in the selection of priority sites for conservation, and it is part of the criteria used for the establishment of Key Biodiversity Areas (KBA) by the International Union for Conservation of Nature (KBA Standards and Appeals Committee, 2020).
Another essential element for the selection of priority sites for conservation is species richness. Together, richness and rarity can be used simultaneously to identify hotspots for conservation (Myers et al., 2000), which can help ensuring the conservation of the greatest number of species at the lowest cost. Furthermore, although hotspots definition includes endemic species, they do not always incorporate the most vulnerable species based on their geographic rarity (Ceballos and Ehrlich, 2006). This may be because endemism and geographic rarity, although being related terms, are not always positively correlated. For example, the hairy fruit-eating bat (Artibeus hirsutus) is an endemic species to Mexico, but since their range size is equivalent to 22% of the Mexican land surface, it is not considered as a restricted or endangered species (SEMARNAT, 2010). In addition, since endemism is contingent on a particular geographical unit (e.g., country), there can be species that are geographically rare but distributed in two or more such units, such as the amber fruit-eating bat (Dermanura rava) that occurs in three countries but with a small geographic range, thus being considered neither as endemic nor as an endangered species (Solari, 2019).
Both, species richness and range size are used to describe geographic patterns of biodiversity (Arita et al., 2012, 2008). The richness and distribution information of species within a region, which is usually contained and organized in a presence-absence matrix (PAM), can be displayed in the range-diversity plots (RD-plots) proposed by Arita et al. (2008). These plots have been useful to identify areas of importance for conservation, by simultaneously combining the species richness and their geographic rarity. This conceptual and methodological proposal has been applied to terrestrial and aquatic vertebrates (Vilar et al., 2017; Villalobos et al., 2013a). Also, combined with ecological niche models, these RD-plots have been used to assess changes in the distribution and alpha and beta diversity of plants, amphibians, and birds, under climate change scenarios (Prieto-Torres et al., 2020).
The New World leaf-nosed bats (Order Chiroptera; family Phyllostomidae), with 11 subfamilies recognized (Baker et al., 2016), are one of the most diverse and ecologically important groups within mammals due to their role as seed dispersers, pollinators, and arthropod population controllers (Rex et al., 2010). Their flight capability and their wide ecological niche have allowed them to colonize different areas throughout their evolutionary history, and at present, they are distributed from the southern United States to the northern area of Chile and Argentina. They have a high variation in range size in comparison to other families within the superorder Noctilionoidea (Rojas et al., 2018). Currently, they face greater threats derived from human activities, such as habitat loss, with a higher rate of deforestation in the tropics (Meyer et al., 2015b).
Despite all the knowledge we have about the threats that Neotropical bat populations face (Nassar et al., 2020), the identification of priority areas for their conservation has not been evaluated on a continental scale. Therefore, the challenge of conserving biodiversity requires, with an increasing urgency, transnational and global actions based on international agreements and new rules for social and economic development. Considering the importance of conservation of rare species, but also regions with high richness, the present study aims to determine the global priority areas for the conservation of phyllostomid bats by simultaneously analyzing their richness and rarity.
MethodsThe present study is based on the geographic ranges (extents of occurrence EOO; Gaston, 2003) of 214 species of leaf-nosed bats (Phyllostomidae), of which 212 were obtained from Rojas et al. (2018) and two from the International Union for Conservation of Nature (https://www.iucnredlist.org/). We overlaid these ranges in geographic space on a grid of 0.5° × 0.5° latitude and longitude, and obtained the distribution of richness (Graves and Rahbek, 2005). The range size of the species with a single record started from a radius of 30 km (Rojas et al., 2018), thus, the estimated area of these species is restricted to c.a. 2800 km2. This is the minimum reported area for the species of Phyllostomidae family. Therefore, we chose a 0.5° × 0.5° grid as the minimum range size for the family Phyllostomidae. At a coarse resolution, the probability of underestimating the range of the species or the extension of protected areas increases, while at a finer resolution it could overestimate the protected area (e.g., Ficetola et al., 2014).
Then, we constructed a PAM, with the grid cells (sites) in the columns (N = 6951) and the species in the rows (S = 214). The sum of the rows corresponded to the species range size (ni) and the sum of the columns to the species richness per site (sj). The sum of the ranges in each site constituted the dispersion field (Rj), which represents the summation of range sizes of all species present at that site (Arita et al., 2012; Graves and Rahbek, 2005). This information can be depicted in per site range-diversity plots (RD-plots by sites), which describe the similarity between sites based on the shared species using the proportional values of richness and range size per site (Arita et al., 2012, 2008).
For the determination of rarity hotspots, we used RD-plots by sites. We calculated the average range size for each site (n¯j) by dividing its dispersion field (Rj) by the species richness of that site (sj). We obtained the proportional per-site range size (n¯j*) by dividing the average range size by the number of sites or cells (N). To obtain the proportional value of species richness within sites (s¯j*), we divided the average species richness at each site (s¯j) by the number of total species (S). The ratio of total species richness and the average species richness at the sites resulted in the Whittaker Beta values (βω = S/s¯) (Whittaker, 1960). We described two hotspots using the frequency distribution of the proportional richness (s¯j*) and the proportional range size per site (n¯j*): 1) richness-rarity hotspot, constituted by the sites within the fourth quartile of proportional richness and from the first quartile of the proportional range size per site; and 2) poorness-rarity hotspot, that includes the sites within the first quartile of both data sets (Villalobos et al., 2013b, 2013a).
We determined the rare species by using the proportional range size of each species (ni*), dividing the range size by the total number of cells of the grid (ni/N). The frequency distribution of these values was divided into quartiles, and we denominated as rare the species whose proportional ranges were found in the first quartile (Gaston, 1994). This determination of rarity is congruent with the criteria for the selection of Key Biodiversity Areas (KBA) of the IUCN (IUCN, 2016). Then, we assessed the presence of rare species in both hotspots.
To assess the representativeness of the rarity hotspots within already established protected areas, we used the World Database on Protected Areas (WDPA) that includes all protected areas in the world declared from 1981 to 2019 (IUCN and UNEP-WCMC, 2021). We denominated as Conservation Units (CU) those cells with a minimum surface of 10% of the protected area inside, and we defined representativeness as the proportion of protected areas within each rarity category (poorness-rarity and richness-rarity). Based on previous studies that used null models for testing if overlapping between conservation units and the species' geographical range is different than expected by chance (Lisón et al., 2015; Sánchez-Fernández and Abellán, 2015), we use a null model for testing whether our hotspots are over or under-represented by the Conservation Units. For this purpose, the location of all CUs within the rarity quartiles was randomized up to a total of 999 times. Under the null hypothesis, the CU overlap should be lower than expected if the proportion of randomized values is equal to, or greater than, the observed values at a 5% significance level (P-value 0.05). Within each rarity hotspot, we counted the number of Protected Areas that are within the management categories applied by the IUCN (Dudley, 2008).
Finally, we described the representativeness of the species within each rarity hotspot, according to their taxonomy, diet, and category in the IUCN Red List (IUCN, 2018). To address taxonomic changes, we used three main databases: the Integrated Taxonomic Information System (ITIS, https://www.itis.gov), the ASM Mammal Diversity Database (MDD, https://www.mammaldiversity.org/index.html) and BatNames (Simmons and Cirranello, 2019, www.batnames.org), last consulted on November 17, 2020. The taxonomic and nomenclature arrangement for the species of the family Phyllostomidae followed Baker et al. (2016). Diet data was obtained from MammalDIET v. 1.0 (Kissling et al., 2014). We carried out analysis using raster and letsR (Hijmans, 2014; Vilela and Villalobos, 2015) packages from R software (R Core Team, 2019); the R code from Arita et al. (2012) and ArcGis software version 10.4.1 (Environmental System Research Institute (ESRI), 2017).
ResultsSpecies richness and range size patternsSpecies richness was concentrated in the tropical region of the New World, between 12° N and 12° S with 24% of the species evaluated ( s¯* = 0.24, standard deviation (SD) = 0.05), and decreased towards the extremes of the distribution of the Phyllostomidae family at subtropical (between 12°–23.45° N and 12°–23.45° S, s¯* = 0.13, SD = 0.07), and temperate (>23.45° N and >23.45° S, s¯* = 0.02, SD = 0.03). The proportional range size per site showed a decreasing South-North pattern (Fig. 1), with species at the southern temperate region occurring, on average, in 68.2% of total cells ( n¯ * = 0.682, SD = 0.19), while those in the north temperate region occurring, on average, in 18.9% of all cells ( n¯ * = 0.189, SD = 0.16). The average proportional species richness was 34 species ( s¯ * = 0.158 or 15.8% of the species), resulting in a Beta diversity value of 6.29 (βω = S/s¯ = 214/34). The average species range size was 1104.6 cells (n¯* = 0.158 or 15.8% of total cells). Fifty-three of 214 species were considered rare, based on the quartile method, while 13 of them fell into zones of intermediate richness, and were not included in any of the rarity hotspots.
Rarity hotspots and scatter plot (right) where it can be seen that the rarity sites (blue dots) were found mainly in the Northern Hemisphere. The dotted lines indicate the first and fourth quartiles (black lines) and the median (grey line).")
The poorness-rarity hotspot included 774 cells distributed in the northern region of Mexico and the Caribbean (Fig. 2). Within its limits, 50 species belonging to eight subfamilies were found, 23 of them were exclusive to this region, including 11 rare insular species. Frugivorous (22) and omnivorous (14) species dominated and we only found one carnivorous and two sanguivorous species (Fig. 3). Twenty-six species were distributed in the continent, 16 had insular ranges, and eight were distributed both on the continent and on islands. Regarding its conservation status according to the IUCN Red List, the poorness-rarity hotspot contained 5.6% of the Data Deficient species (DD), 57.1% of the Near Threatened species (NT), 14.3% of the Vulnerable species (VU), 33.3% of the Endangered species (EN), and 100% (only one species) in Critically Endangered category (CR). We found eight unique species with conservation priorities due to their threat category: Phyllonycteris aphylla, (CR), Leptonycteris nivalis and Chiroderma improvisum (EN), Choeronycteris mexicana, Leptonycteris yerbabuenae, Stenoderma rufum, Sturnira angeli and Sturnira paulsoni (NT), each with more than 35% of their range within this poorness-rarity hotspot. Species belonging to subfamilies Lonchorhininae, Carolliinae, and Rhinophyllinae were absent in the poorness-rarity hotspot.
. Blue dots correspond to zones of low species richness or Poorness-rarity (the first quartile for proportional species richness and first quartile for proportional per-site range size) and red points are rarity sites within zones of high richness or Richness-rarity (the fourth quartile for proportional species richness and first quartile for proportional per-site range size). The colors on the RD-plot correspond to the geographic area shown on the map (right).")
RD-plot by sites within the range of the family Phyllostomidae (left). Blue dots correspond to zones of low species richness or Poorness-rarity (the first quartile for proportional species richness and first quartile for proportional per-site range size) and red points are rarity sites within zones of high richness or Richness-rarity (the fourth quartile for proportional species richness and first quartile for proportional per-site range size). The colors on the RD-plot correspond to the geographic area shown on the map (right).
, and red list categories for the 214 Phyllostomidae species unique within the richness-rarity and poorness-rarity hotspots, species found in both hotspots (Shared), and species outside the hotspots (None).")
Subfamilies, diet category (carnivorous, CAR; frugivorous, FRU; insectivorous, INS; nectarivorous, NEC; omnivorous, OMN; sanguivorous, SAN), and red list categories for the 214 Phyllostomidae species unique within the richness-rarity and poorness-rarity hotspots, species found in both hotspots (Shared), and species outside the hotspots (None).
The richness-rarity hotspot was composed by 309 cells, with 154 species from 10 subfamilies, including 29 rare species. This hotspot was located in the Andean zone from Peru to Panama, with a greater number of cells in the Colombian Andean region (Fig. 2). It included all the carnivorous (seven) and all sanguivorous (three) species of the family. In this hotspot, 127 species were exclusive. Frugivory was the most common diet, with 75 species including 15 rare species. Species found in this hotspot represent more than 70% of the total frugivorous species within the family, 69% of the omnivorous species, and 60% of the insectivorous species. The richness-rarity hotspot contained 71.5% of the VU species, 57.1% of the NT species, 64% of the DD species, 60% of the species not evaluated (NE), and 79% of the LC species of IUCN categories (Fig. 3).
Proportionally, the richness-rarity hotspot harbored the largest number of species in any risk category, including 10 exclusive species, 21 species requiring further investigation (DD), and six that have not been assessed due to recent naming or discovery. The 10 exclusive species were: Sturnira nana (EN), Ectophylla alba, Lophostoma occidentalis, Platyrrhinus ismaeli, Platyrrhinus matapalensis, Rhinophylla alethina (NT), Choeroniscus periosus, Lonchorhina orinocensis, Platyrrhinus chocoensis, and Vampyressa melissa (V), five of them (one EN, two V, and two NT) with more than 50% of their range within this richness-rarity hotspot. Only the Macrotinae subfamily was absent in the richness-rarity hotspot.
Conservation units (CU)Within the range of phyllostomid bats, we identified 1794 CUs. Only 259 of them were found inside the limits of the rarity hotspots: 114 in the richness-rarity and 145 in the poorness-rarity hotspot (Fig. 4). Proportionally, 37% of the extension of the richness-rarity hotspot was protected, whereas in the poorness-rarity hotspot was about 19%. In the richness-rarity hotspot, the proportion of CU was significantly different from the expected value (p = 0.001), whereas in the poorness-rarity hotspot, the proportion was not different from the expected under a random location of CUs (p = 1). According to the IUCN categorization of protected areas, in the poorness-rarity hotspot 41 of the CU were international and 104 national, mostly category VI (Table 1). Among the international ones, 31 were located in Mexico and the rest were found in island countries such as Cuba, Jamaica, and Dominican Republic. In the richness-rarity hotspot, we found two international CU, and the rest of them had national management, with a greater presence in Venezuela (31), Peru (30), and Colombia (28).
 within the Richness-rarity (red) and Poorness-rarity (blue) regions.")
Description of the CU found in the rarity hotspots following the IUCN categorization. I, Strict protection; II, Ecosystem conservation and protection; III, Conservation of natural features; IV, Conservation through active management; V, Landscape conservation; VI, Sustainable use of natural resources; Not Applicable, World Heritage Sites and UNESCO MAB Reserves; Not Assigned, the data provider has chosen not to use the IUCN categories; Not Reported, An IUCN management category is unknown and/or the data provider has not provided related information.
| Poorness-rarity | Richness-rarity | Total | |||
|---|---|---|---|---|---|
| Categories | International | National | International | National | |
| I | 0 | 0 | 0 | 1 | 1 |
| II | 0 | 22 | 0 | 69 | 91 |
| III | 0 | 1 | 0 | 4 | 5 |
| IV | 0 | 10 | 0 | 4 | 14 |
| V | 0 | 1 | 0 | 0 | 1 |
| VI | 0 | 57 | 0 | 21 | 78 |
| Not applicable | 30 | 0 | 2 | 0 | 32 |
| Not assigned | 0 | 0 | 0 | 3 | 3 |
| Not reported | 11 | 13 | 0 | 10 | 34 |
| Total | 41 | 104 | 2 | 112 | 259 |
| 145 | 114 | ||||
Only the richness-rarity hotspot presented protected areas in category I (areas of strict protection). Most of its surface fell into category II, with 22% of its area distributed mainly in Colombia and Venezuela. In the poorness-rarity hotspot, category VI was the most represented (7% of its area, 89% located in Mexico).
Two of the most important elements in the designation of areas of conservation importance are rarity (in any of its definitions) and species richness (KBA Standards and Appeals Committee, 2020). In addition, it has been found that the pattern of restricted-range species richness is different from the pattern of general species richness (Ceballos and Ehrlich, 2006; Lennon et al., 2004). Therefore, an approach based on richness alone may not be adequate for robust biodiversity conservation. In response to this concern, we have identified two priority hotspots for the conservation of phyllostomid bats that consider both species richness and rarity, using macroecological tools. Potentially, more than 80% of all species can be found within these hotspots.
The richest sites were found in South America, mainly in the northwestern arc, which includes Venezuela, Colombia, Ecuador and Peru, including a large area within the Colombian mountain range, a region with high precipitation rates and complex topography. In contrast, the sites with the lowest species richness of phyllostomid bats coincided with regions of greater aridity, such as the southern United States, northern Mexico and the Caribbean, corresponding to regions of low productivity, where bat species present are those that possess traits (e.g., greater mobility and larger body size) that have allowed them to adapt to extreme conditions (Conenna et al., 2021). This pattern is consistent with previous studies on the distribution of species richness of terrestrial vertebrates, including bats (Moura et al., 2016; Tello and Stevens, 2010). The 11 subfamilies recognized for Phyllostomidae (Baker et al., 2016), were distributed within both rarity hotspots proposed here. Macrotinae was distributed only in the poorness-rarity hotspot whereas Lonchorininae, Carolliinae, and Rhynophyllinae were distributed only in the richness-rarity hotspot, with the rest of subfamilies being distributed in both. As such, both hotspots can be considered complementary for representing the complete taxonomic (and phylogenetic) scope of Phyllostomidae, which represents an important element in systematic conservation planning (Margules and Pressey, 2000).
Sites with per-site range size values lower than the average, were only found in the poorness-rarity hotspot (blue dots on the left in Fig. 2), also indicating that sites share less species with each other in comparison to sites within the richness-rarity hotspot, which could imply some problems for conservation planning since it will require a larger area to include all the species. In addition, the coverage of Conservation Units in both rarity hotspots are disproportional, with a significantly lower percentage in the poorness-rarity hotspot (19%) compared to the richness-rarity hotspot (37%). This supports the need to carry out reactive conservation strategies in the poorness-rarity hotspot, where there is little general attention on its conservation (Lisón et al., 2020). Using endemism and the threat of extinction of plant species, Myers et al. (2000) identified 25 biodiversity hotspots. However, even though the poorness-rarity hotspot represents the sites with the lowest proportional ranks (below the average for the entire family), this hotspot does not fall within any of the 25 proposed by Myers et al. (2000). This indicates that if conservation efforts were to focus on these hotspots, some range-restricted phyllostomid species would be left out.
The richness-rarity hotspot is one of the areas with the least historical impacts associated with deforestation and land-use change, mainly due to its complex topography and its globally recognized ecological relevance, since it is located within two important hotspots: Tropical Andes and Chocó/Darien (Myers et al., 2000). Here, the presence of paramilitary guerrillas, who used the forests as protection and refuge, made it possible for the forests to remain in a good state of conservation, a phenomenon known as "Gunpoint conservation" (Álvarez, 2003; Dávalos, 2001). However, after the disappearance of these armed groups, intense deforestation began, to convert the forests into illicit crops. Deforestation currently affects a high percentage of protected areas (Clerici et al., 2020; Murillo-Sandoval et al., 2020).
In the two hotspots delimited in the present study, bat populations are threatened by environmental pressures of urbanization, but also by mining, which threatens the roost of several species and contaminates surface water sources. Furthermore, the construction of wind farms endangers migratory species, although there is no evidence of the effects on phyllostomid populations in the poorness-rarity hotspot. Therefore, it is necessary to carry out studies on the anthropogenic threats to the populations of phyllostomid bats in both hotspots, which are globally irreplaceable because they contain unique threatened species (Rebelo, 1994). For example, in the poorness-rarity hotspot, we found the only critically endangered phyllostomid species (Phyllonycteris aphylla) and three other Near Threatened insular species. Also, this hotspot is the habitat of one endangered nectarivorous migratory species (Leptonycteris nivalis), which is ecologically and economically important across its range (Bogan et al., 2017). The richness-rarity hotspot has three species in the Vulnerable category, two of them are range-restricted species (Choeroniscus periosus and Platyrrhinus chocoensis). One more species is migratory (Leptonycteris curasoae). The presence of these species in richness-rarity hotspot makes the conservation a priority regardless of the number of conservation units required for this purpose. In addition, it presents important irreplaceability values of priority areas for terrestrial vertebrates (Burbano-Girón et al., 2022). Therefore, the use of conservation tools based on spatial complementarity is highly recommended (e.g., Moilanen et al., 2005) to assign new protected areas, such as Privately Protected Areas and Archipelago Reserves, that may contain species not represented in the existing areas (Ortiz-Lozada et al., 2017).
There is a higher proportion of migratory and hibernating phyllostomid species in the poorness-rarity hotspot (Burke et al., 2019), therefore an assessment that considers seasonal protection and persistence of species in protected areas over time is required (e.g., Cabeza and Moilanen, 2001). Studies emphasize the importance of some regions to conserve routes and roost of North American migratory species (Gómez-Ruíz et al., 2015; Menchaca et al., 2020). Thus, it is important to consider the concepts of migratory connectivity in planning conservation strategies to avoid generate islands of conservation (see Chetkiewicz et al., 2006; Webster et al., 2002). In addition, the richness-rarity hotspot is immersed in a region with high phylogenetic diversity of bats, including species from different lineages and characterized by highlands and mountains (Bogoni et al., 2021) where the persistence of species has been predicted to shift in response to climatic change. Indeed, the maintenance of suitable habitats for bats is an essential task to ensure the use of highlands as a refuge in the face of current climate change (Gonçalves et al., 2021).
Less degraded areas with less human impact can become protected areas within the category I (Dudley, 2008), a category that was only present in one site within the richness-rarity hotspot. However, in a study based on the irreplaceability of species and their endemism, an important portion of North America consisting mainly of desert areas, including the poorness-rarity hotspot, was defined as an area of low human impact (wilderness) with high potential for proactive conservation (Mittermeier et al., 2003), which could favor the creation of protected areas with category I.
The highest percentage of NE and DD species was found in the richness-rarity hotspot (60% and 64% respectively), habitat of many globally threatened species (Frick et al., 2020). In contrast, the poorness-rarity hotspot has the highest percentages of CE, E, and NT species (100%, 33%, and 57%, respectively). Many of them were insular species with higher conservation priorities (Conenna et al., 2017). Although it is recommended to increase the protected area in both types of hotspots, it is important to point out that conservation strategies must address two main issues: the lack of information for the species (in richness-rarity hotspot) and the low representativeness of threatened species within protected areas (in poorness-rarity hotspot).
Although a different method is required to delineate research priorities within each hotspot (e.g., regional GAP analysis), based on our results, we were able to observe that the richness-rarity hotspot requires a greater effort to fill knowledge gaps about its species. In addition, the rate of species discovery is expected to be higher in the Tropic compared to North America (Moura and Jetz, 2021). In contrast, the poorness-rarity hotspot, which has much more information regarding its expected richness (Meyer et al., 2015a), should be considered a priority for conservation, due to its greater presence of species at risk. This implies the need for greater efforts in the planning of conservation strategies and policies, as has also been proposed by other authors (Frick et al., 2020).
Given the continental extension of the species ranges in the Phyllostomidae family on which this study was based, it is feasible to use the family as a conservation surrogate for other groups at the same scale and extension, since it has been observed that, at a greater extent, the richness of a given taxon may be congruent with the richness of another (Hess et al., 2006). This is supported by congruence with priority regions of other groups, such as non-flying mammals, amphibians, and birds (Albuquerque and Beier, 2015; Arita et al., 1997; Villalobos et al., 2013a). Furthermore, the local occurrence of leaf-nosed bats depends on other elements not included in this study given its broad scale focus, such as roost and food availability, forest cover, and other microclimatic variables (Gorresen and Willig, 2004; Stoner, 2000; Tschapka, 2004), so an analysis of the threats associated with these elements at a finer scale is necessary. Moreover, the use of range maps (i.e., extents of occurrence) for the prioritization of areas should be taken with caution since they can depict regions where species do not actually occur at the local scale, limiting the effectiveness of range-based prioritization. Therefore, range maps are a useful resource to explore prioritization at broad spatial scales, where they can provide a first step towards informing conservation actions (Villalobos et al., 2013a), but loose reliability for a local scale assessment where finer information (e.g., actual presence, local abundance) is needed (Hurlbert and Jetz, 2007).
We emphasize that other types of rarity are also important in prioritizing species conservation, since it has been observed that a significant portion of ecologically rare mammal species are in categories of Least Concern, or have not been evaluated because the vulnerability criteria followed by the IUCN is mainly based on geographic rarity (Loiseau et al., 2020). Therefore, there are species with a wide range but ecologically rare, that are not taken into account when conservation strategies are being planned. The identification of these species is also a priority action within the conservation plans.
Our results should be treated with caution since highly vulnerable species were excluded of our hotspots due to their distribution in regions of intermediate species richness, such as Musonycteris harrisoni (VU) and Lonchophylla mordax (NT). Thus, this work is a first approach to help in the choice of where the conservation of phyllostomid bats should be a priority, mainly for the geographically rarest species. Areas not included in our analysis, are feasible for conservation too, mainly in Mexico, where most of the endemic species are distributed outside of our rarity hotspots (Ceballos, 2007).
Finally, several authors have demonstrated that the use of species richness as the only criterion for the global conservation of species is inefficient; a high number of species are not taken into account, many of which are endemic species or have restricted distribution, or are threatened (Veach et al., 2017). Thus, the priority areas for conservation and research that have a greater representation of species, do not always coincide with the regions with the greatest species richness (Albuquerque and Beier, 2015). Therefore, it is essential to evaluate the complementarity of the protected areas within the priority hotspots for conservation described here. Even though the number of Conservation Units was lower in the richness-rarity hotspot, the number of areas required to protect the largest number of species may be lower compared to the poorness-rarity hotspot.
ConclusionsThe use of macroecological tools in conservation biology facilitates area-based objectives without detracting from elements associated with species vulnerability, such as range size, and emergent properties of communities, such as species richness. Using these methods, we were able to delimitate two hotspots for the conservation of phyllostomid bats at a continental level. Each one is comprised by different species and has different research and conservation needs. In addition, given that this study involved narrow-ranged species, both hotspots have a high irreplaceability value, highlighting the importance of conserving range-restricted species whose local extinction could represent a serious global threat. These results represent a first approach for the determination of priority sites for bat conservation, a subject that has been scarcely addressed. It does not intend to be a decisive method, because it does not contemplate socio-political aspects necessary to carry out adequate conservation strategies. However, it should be considered as the prelude to focus research and conservation efforts on such an ecologically important and diverse taxon as family Phyllostomidae.
Declaration of interestsThe authors declare that they have no known competing financial interests or personal relationships that could have appeared to influence the work reported in this paper.
JDC-V thanks the Mexican National Council for Science and Technology(CONACyT) for the doctoral scholarship (388807) and Karla P. Borges Jesús for her valuable support, comments and criticisms of this work. We also thank the editor and the valuable comments and suggestions made by two anonymous reviewers that improved the manuscript.

