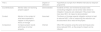
Many biodiversity conservation projects struggle to demonstrate the impact of their actions. Existing project management guidelines inadequately address the issue of planning projects in a project portfolio (a programme) and how to aggregate data across portfolios, so monitoring systems are often weak. Based on a literature review and personal experience, I define Five Steps to Conservation Impact: 1. Planning — develop a shared vision and measurable goals and objectives (with project goals and objectives linked to higher-level programme goals and objectives); 2. Common indicators — identify indicators common to projects and the programmes they contribute towards to allow aggregation of results; 3. Monitoring — collect data to measure indicators (wherever possible using harmonised monitoring protocols to enhance data sharing); 4. Interpretation — present data in a format of use to programme managers and other decision makers (presenting trends in ways that demonstrate outliers, through maps and dashboards); 5. Action — use data to evaluate progress and make adaptive management decisions. These steps differ from other project management guidelines by linking common goals with common indicators and measuring aggregated conservation impact. Enabling conditions for success include: senior managers are willing to establish a results-based management culture; attribution is considered an aspiration not a hindrance; capacity and tools are in place. If organisations design projects with goals, objectives and indicators that are shared across the portfolio, and counterfactuals are identified wherever possible, then monitoring impact is feasible. Making impact monitoring the norm, however, will require a culture change within the conservation community.
Biodiversity continues to decline due to human activity (Díaz et al., 2019). Conservation and sustainable development projects show local successes but often fail to deliver impact at the larger scales required to reduce threats and reverse trends (Waeber et al., 2016; Johnson et al., 2017).
Ultimately, conservation can be deemed a success only if biodiversity is in a better state than before the intervention, or if threats and pressures have been reduced. There is a growing movement to improve results-based management of conservation projects to ensure informed decisions are made based on evidence derived from data analysis and evaluation (Dicks et al., 2014; Stephenson et al., 2017a). Project managers and other stakeholders (e.g. local communities, NGOs, government agencies, donors, businesses) all need to know the impacts of their interventions (if and how they achieved their goals and improved the state of biodiversity), and their outcomes (if and how they realised their objectives and reduced threats) (see CMP, 2013, for definitions). In turn, they need to identify which strategies and actions worked well and which worked less well so they can learn and adapt for the future (sensu Sutherland et al., 2018). The same approach is needed whatever the type of project, from rehabilitating a protected area (PA) to recovering a threatened species to sustainable resource management or restoration, whether the work is led by governments or civil society or companies.
However, measuring conservation impacts and outcomes remains elusive. Many governments struggle to provide data for reporting their delivery of global biodiversity goals (Bubb, 2013; Stephenson et al, 2017a), reflecting broader gaps and biases in data availability worldwide (Tittensor et al., 2014; Stephenson et al., 2017b). Conservation project monitoring is often inadequate due to weak plans and indicators, short-lived monitoring schemes and a general lack of capacity and appropriate budgeting for data collection and use at relevant scales (Stephenson et al., 2017a, 2017b). It is also rare for projects to assess counterfactuals against which to compare results and to estimate what conditions would have been like in the absence of conservation action (Ferraro and Pressey, 2015; Hoffmann et al., 2015; Adams et al., 2019). In turn, weak planning and monitoring limit potential for sustainability, knowledge sharing and systematic learning, which are among the essential enabling conditions for scaling up conservation (Murcia et al., 2016; GEF IEO, 2019). Challenges occur across stakeholders and scales, with large, multi-million dollar multilateral programmes encountering similar problems (limited time-series data, difficulties in establishing counterfactuals, lack of consideration of scaling up in monitoring systems, etc.) (GEF IEO, 2016; Begovic et al., 2017). Many companies are unable to monitor their sustainability and the impacts of their supply chains on the environment (O’Rourke, 2014).
The challenges of weak project monitoring are greatly compounded by the fact most impact will not be the result of a single project but a suite of activities and projects within or across institutions, either framed under a single programme or multiple programmes (where a programme is defined as a group of two or more projects). Most organisations operate a portfolio approach, often with projects managed or co-managed by different partners. While some larger agencies such as the Global Environment Facility put in place systems to track scaling up across portfolios (GEF IEO, 2019), having a suite of projects adds a level of complexity that many governments and NGOs struggle to deal with (Stephenson et al., 2015a). As a result, many people fail to translate organisational goals into project activities (Wahlén, 2014). Although numerous standards, tools and approaches exist for project management (e.g. CMP, 2013; Schwartz et al., 2017; Battisti, 2018), they do not clearly explain how to set hierarchical objectives and monitor impacts from projects to programmes, making it difficult to assess cumulative impact.
Based on a literature review, and my personal experience of helping improve impact monitoring in several NGOs, international organisations and companies, I argue that the solutions to improve and mainstream impact monitoring already exist. Key principles, developed for both environmental organisations and the public sector, can be used as the basis to ensure a project or programme measures the extent to which it makes a difference. In this article I summarise the key steps needed to measure conservation impacts and outcomes, and the main enabling conditions required.
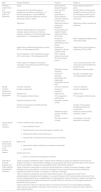
The Five Steps to Conservation ImpactThe Five Steps to Conservation Impact proposed are applicable to multiple stakeholders implementing different types of projects at different scales. Throughout the description, a hypothetical programme with two projects (conserving elephants in Africa by a fictitious NGO) is used as an example (Table 1), and issues to consider in other types of project are highlighted (Table 2). These steps differ from most other project management guidelines by explicitly linking common goals with common indicators and using data to measure aggregated impact across portfolios. There is also greater emphasis on considering counterfactuals and interpreting and using data for decision-making.
A mock-up of the Five Steps to Conservation Impact in a hypothetical programme (Conserving the elephants of Tanzania) and its constituent projects (Rehabilitating Ruaha National Park; Conservation of Wildlife in the Serengeti Ecosystem), managed by a fictious NGO, Wildlife International, under its African Elephant Programme. Programme goals and objectives are adapted from Stephenson and Ntiamoa-Baidu (2010). As with all project management cycles, the steps are generally applied in order, but not necessarily from 1 to 5 (e.g. an existing project may review existing data — step 5 — as a precursor to developing new goals and objectives — step 1; if indicators cannot be identified easily in step 2, project staff may need to go back to step 1 and revise their goals to make them more measurable).
| Step | Programme/NGO | Project 1 | Project 2 |
|---|---|---|---|
| Develop a shared vision and measurable goals and objectives | Goals | Goals linked to programme goals | Goals linked to programme goals |
| Programme Goal: By 2025 elephant populations are stable or increasing in 10 priority landscapes in TanzaniaWildlife International Goal:No threatened mammal species go extinct in Africa. | Goal: By 2023, elephant populations in Ruaha National Park have returned to 2000 levels. | Goal:By 2025, priority species (elephants, rhinos and lions) in the Serengeti are thriving and local communities benefit from ecotourism. | |
| Objectives | Objectives linked to programme objectives | Objectives linked to programme objectives | |
| Elephant habitat effectively conserved to increase range & enhance connectivity between populations (including transboundary populations) in 14 landscapes by 2025 | At least 2000 ha of elephant habitat restored in Ruaha NP by 2021. | ||
| Ruaha NP managed more effectively by end of project | SNP management effectiveness improved by 2025 | ||
| Illegal killing of elephants reduced by at least 30% in 12 landscapes by 2024 | Poaching of elephants in Ruaha halted by 2022. | Illegal killing of priority species reduced by 75% by 2022 | |
| Human–elephant conflict reduced by at least 40% in pilot sites in 18 landscapes by 2023 | HEC incidents reduced by at least 50% during life of project | ||
| Public support for elephant conservation increased in 20 landscapes by 2025 through increased benefits. | Local communities within 5 km of the park accrue benefits from wildlife tourism. | ||
| Objectives unique to project | Objectives unique to project | ||
| Ruaha NP boundary demarcated with stakeholder participation by end 2021. | By 2020, all domestic dogs vaccinated against rabies. | ||
| Identify common indicators to allow results aggregation | Common indicators | Common indicators | Common indicators |
| Number of elephants | Number of elephants | Number of elephants | |
| Habitat cover | Habitat cover | Habitat cover | |
| PA management effectiveness | PA management effectiveness | PA management effectiveness | |
| Reported incidents of HEC | Reported incidents of HEC | ||
| Number of local people benefitting directly from conservation | Number of local people benefitting directly from conservation | ||
| Additional project-specific indicators include | Additional project-specific indicators include | ||
| Boundary markers in place | Percentage of local dog population vaccinated. | ||
| Collect data to monitor indicators | Common methods used across sites:
| ||
| Analyse and present data in a format of use to decision makers | Maps show:
| ||
| Use data to evaluate progress and make adaptive management decisions | Types of question answered by data in reports:Are we meeting our goals and objectives and having any tangible outcomes or impacts? Which strategies are working well and which less well? What are the lessons learned and adaptive management being applied within and between projects? | ||
| Types of decisions made based on data from reports:Replicate or multiply successful strategies; Adapt strategies that are less effective or tackle the blockages to their success.Share key lessons;Adapt the programme portfolio to harness our strengths or meet new challenges. | |||
| Types of question answered by evaluation reports:What impact is the programme having? Is the project/programme designed and managed in a manner that aligns to WI’s best practices and policies? How can the project/programme be managed better and implemented to improve outcomes, impacts, and efficiency, and demonstrate more credibly the evidence for results? What can we learn from this programme that can benefit WI and its partners? | |||
| Types of decisions made and responses taken to evaluation:Numerous but include adapting strategies, improving plans and systems, changing human resources, etc.; learning from evaluations also shapes the future project portfolio. | |||
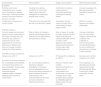
Some examples of issues to consider in monitoring a diversity of project types. The principles explained in the Five Steps to Conservation Impact can be applied to all projects, regardless of scope, targets, scale or stakeholders.
| Small projects | Policy projects | Supply chain projects | Marine/aquatic projects |
|---|---|---|---|
| Examples | |||
| Building small-scale infrastructure (e.g. a ranger post); Developing a species action plan; Training key stake-holders; Short-term research. | Creating the enabling conditions for community-based natural resource management; Lobbying for wildlife trade controls. | Certification to improve sustain-ability of commodity production; Creating bio-diversity offsets. | Conserving pelagic fish; Managing wetlands habitats for people and nature. |
| Issues to consider | |||
| Limited time or resources to monitor impact | The action is far removed from the site of conservation impact | Infeasible to monitor impact on every farm or small holding in large supply chains | Difficult to monitor species and habitats underwater |
| Potential solutions | |||
| Focus on goals and indicators based on what is achievable in the scope of project time and resources (e.g. actions or responses may be more appropriate to monitor than pressures or states);Use a theory of change to predict impacts from those actions. | Rely on theory of change to predict impacts;Specify which individuals and organisations are expected to change | Rely on theory of change to predict impacts;Conduct impact evaluations of randomly selected sub-set of sites to verify approach;Use satellite-based remote sensing to monitor sites under certified production | Use proxy indicators (e.g. fish catch rates instead of absolute fish numbers);Test suitability of environmental DNA monitoring techniques for some indicators;A strong theory of change is also essential. |
| Examples of tools or guidance | |||
| Dickson et al. (2017) | Dickson et al. (2017) | O’Rourke (2014), Milder et al. (2015) | Danovaro et al. (2016), Valentini et al. (2016) |
| Examples of common indicators | |||
| No. of buildings constructedNo. of anti-poaching patrols and area coveredNo. of action plan objectives or research recommendations implementedNo. of people applying skills learned to conservation. | No. of conventions ratified or legislation adopted/ changedNo. of company policies adoptedAmount of money allocated/investedNo. of species affected by policy Extent policies are implementedEnvironmental and social impacts of implemented policies. | Area/no. of farms under certified productionProportion of market share of commodities from sustainable sourcesArea of supply chain under protectionArea protected as offsetsManagement effectiveness of areas protected. | Fish caught per unit effortSpecies diversity (determined through eDNA)Dragonfly Biotic IndexOcean Health indexWater Quality Index |
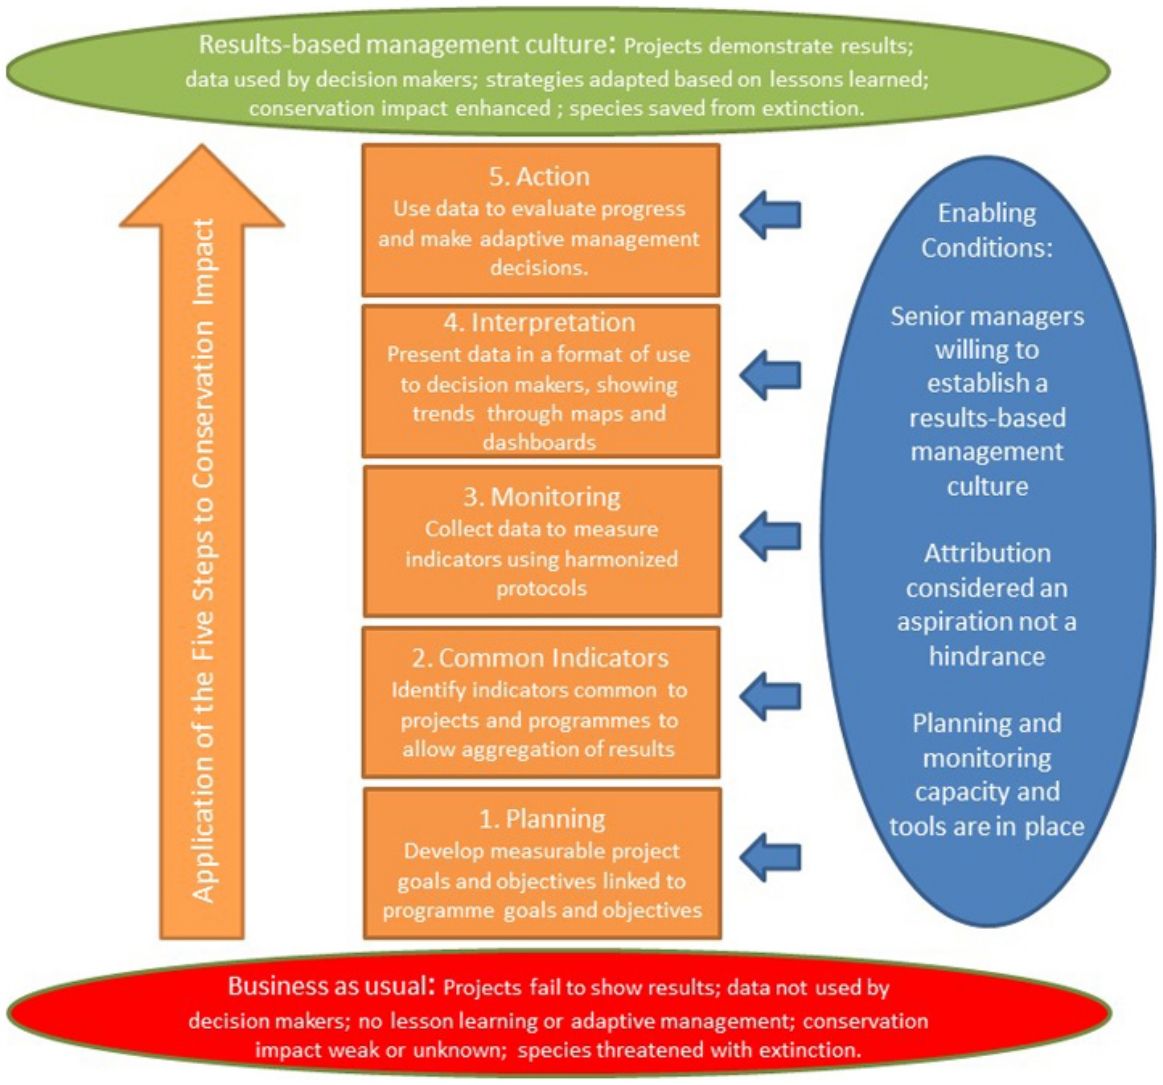
You cannot measure impact if you do not know what impact you are trying to achieve. Good planning is therefore a prerequisite of good monitoring. Most planning systems encourage an inspirational vision with a measurable goal (defining the state of biodiversity) and objectives (often defining threats to be reduced), based on a conceptual model of the main issues and how they relate to each other. These elements of a strategy should include a theory of change, preferably elucidated through a set of results chains (or pathways to impact) to demonstrate the logic of how you expect a given action to lead to a specified output onto a specified outcome and then a specified impact (CMP, 2013). Key issues in setting goals and objectives include the identification and engagement of stakeholders in the planning process and the consideration of root causes in addition to proximate threats. But the key element for ensuring the roll up and aggregation of results and the eventual measurement of impact is that project goals and objectives must link to higher-level programme goals.
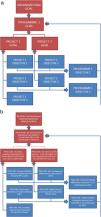
Therefore, the formulation of the goal of the project should reflect and share language with that of the programme. An example of such a goal hierarchy is demonstrated in Fig. 1 and Table 1.
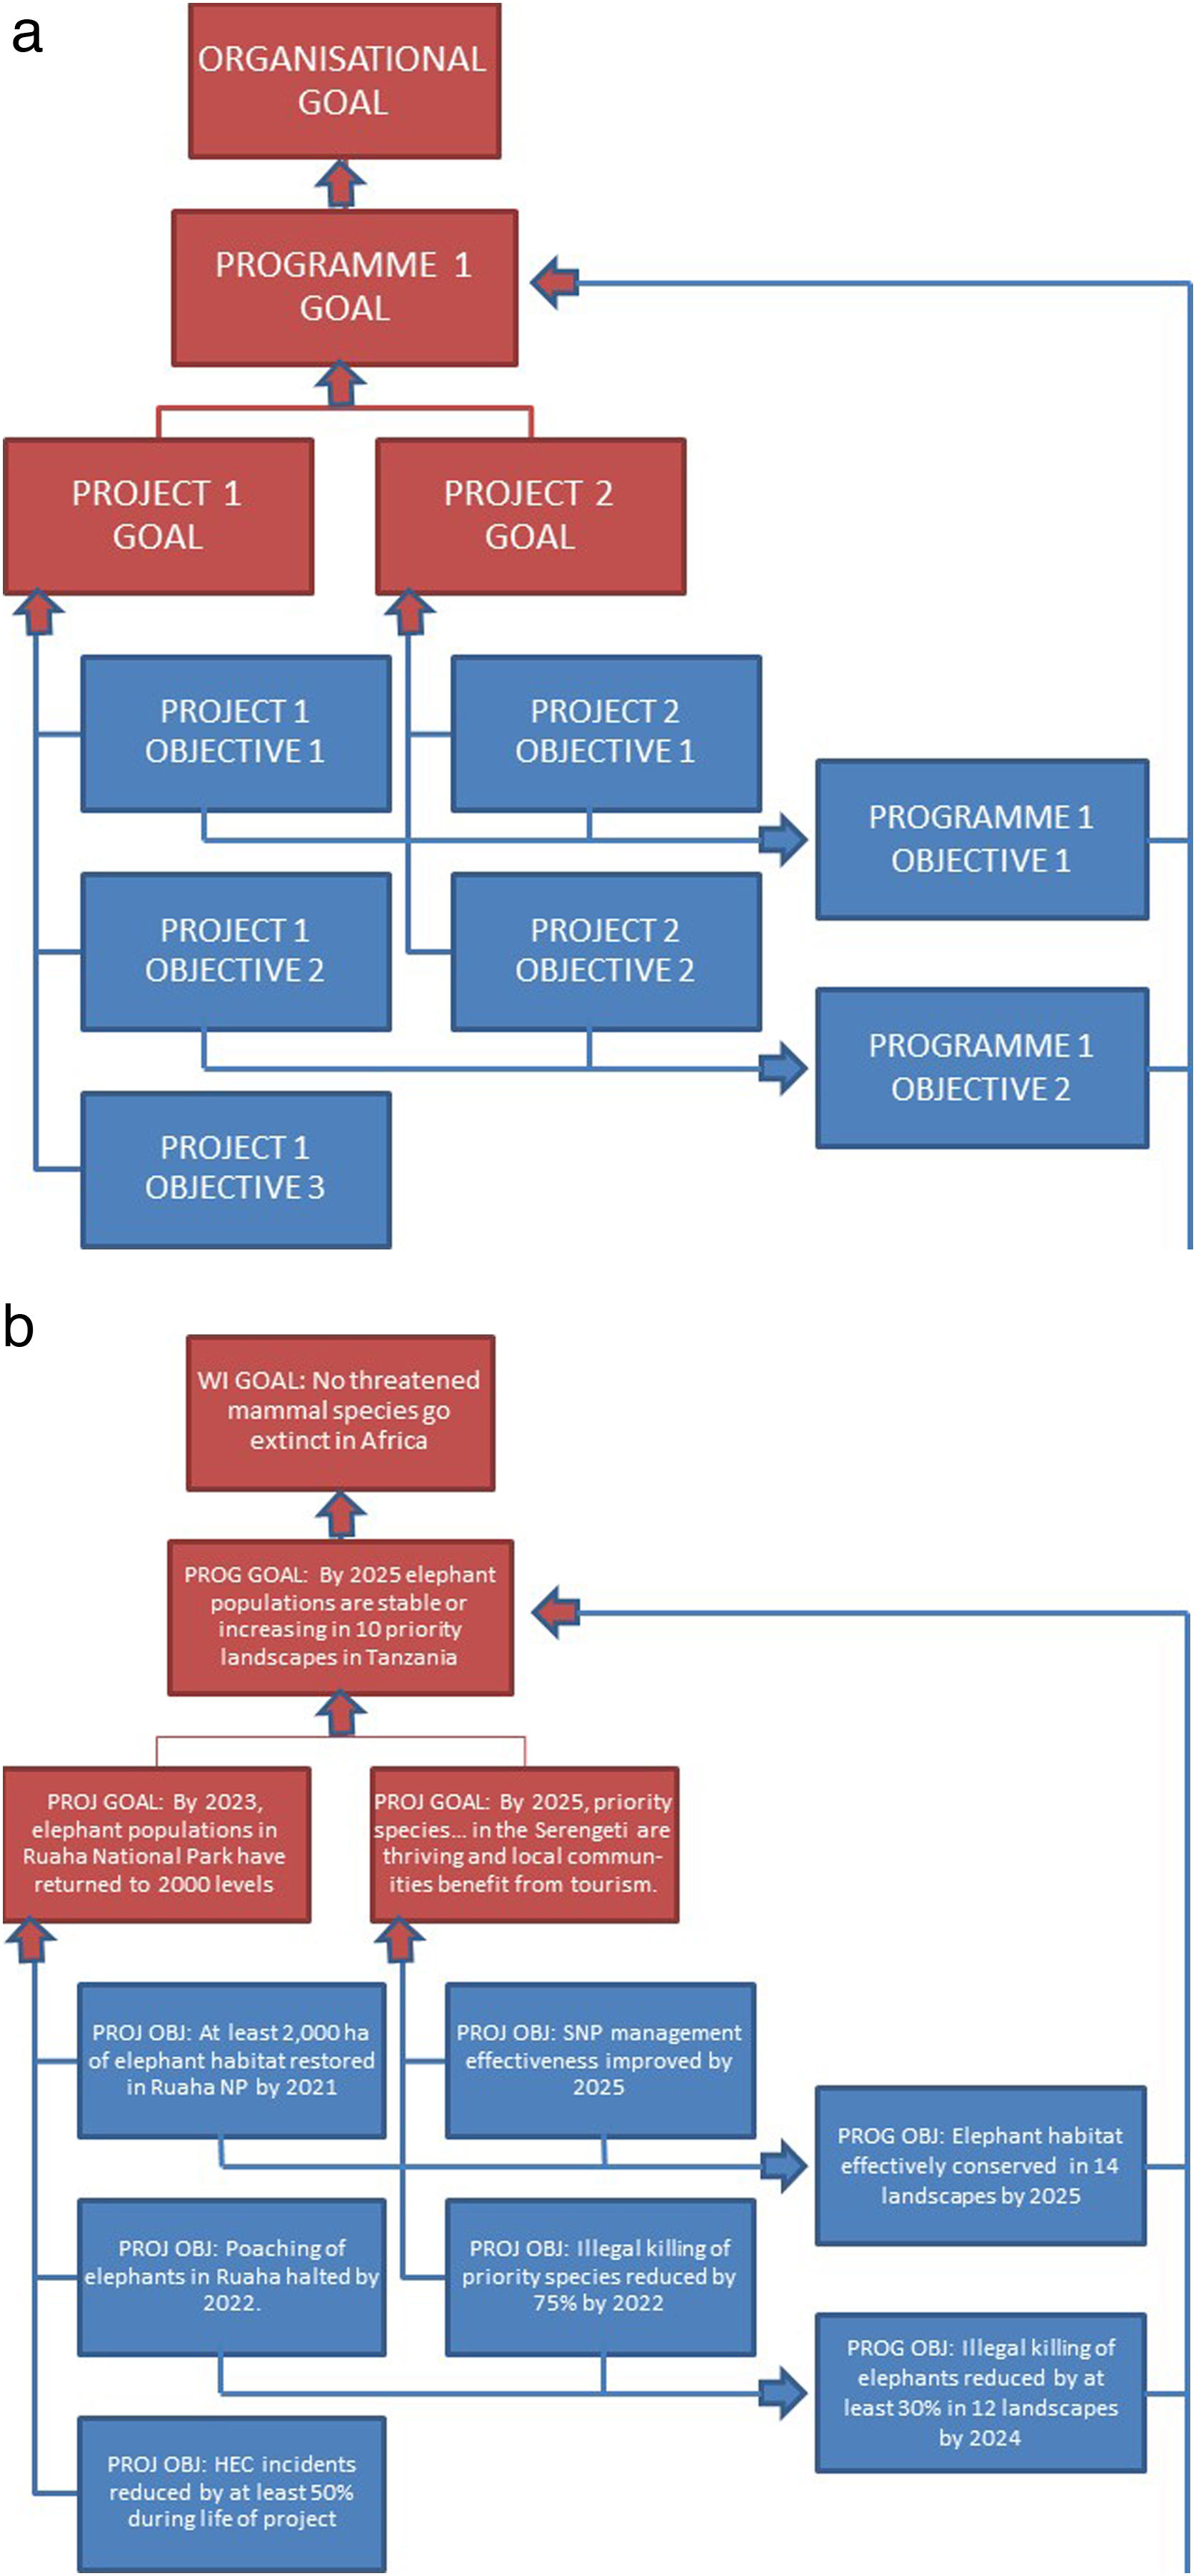
Diagram showing (A) generic goal and objective hierarchy, (B) an example from the hypothetical elephant programme. If common indicators are used to monitor the same types of goal and objective at project level then data can be aggregated to demonstrate programme impact and organisational impact.
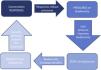
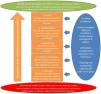
Project indicators will need to be chosen to measure the goals and objectives identified in step 1 following best practices for indicator development (e.g. CMP, 2013). This includes the need to ensure the indicators will provide measures of change in the timeframe relevant to the project. The conservation community has widely adopted the pressure-state-response-benefit (PSRB) model of interlinked indicators for biodiversity monitoring (Sparks et al., 2011). The relationship between the indicators (Fig. 2) ensures they create a more complete picture of what is happening in the project and why. The types of indicators in this model are:
- •
Pressure indicators: monitoring the extent and intensity of the causes of biodiversity loss that responses aim to address (e.g. habitat loss, levels of exploitation or offtake, nitrogen deposition rate, invasive species, climate change impacts).
- •
State indicators: analysing the condition and status of aspects of biodiversity (e.g. species abundance and diversity, habitat extent and quality).
- •
Response indicators: measuring the implementation of policies or actions to prevent or reduce biodiversity loss (e.g. PA coverage, PA management effectiveness, area under sustainable management, funding).
- •
Benefit indicators: quantifying the benefits that humans derive from biodiversity (e.g. livelihoods, fuelwood availability, populations of utilised species). Benefit indicators may also represent an impact if the project has a benefit-related goal (Brichieri-Colombi et al., 2018).
Relationship between PSRB indicators. Adapted from Sparks et al. (2011).
The key to ensuring the eventual measurement of aggregated impact is that at least a small sub-set of the indicators are chosen from a suite of common indicators used by all of the projects contributing to the same programme goals and objectives. For example, if the state indicator for the elephant programme is the number of elephants in Tanzania, the state indicator for the project in Ruaha National Park needs to be the number of elephants in the park. If a programme-level pressure indicator is the number of incidents of human-elephant conflict (HEC), the project indicator is the number of HEC incidents in Ruaha. Note that most of a project’s indicators will likely be unique to the project to monitor project-specific objectives that have no direct link to programme objectives (in this instance, for example, the Ruaha project has an indicator concerning boundary markers in place, which is not relevant to the programme). If the programme was developed after some of its constituent projects were established (a regular occurrence in NGOs, especially if new funding is secured), programme-level indicators may need to be identified retroactively, with relevant common indicators identified from existing project indicators.
In turn, the common indicators used to monitor a programme’s progress against its goals can be harmonised where appropriate with higher-level global indicators. Many government agencies and NGOs use common measures that are aggregated to show contributions towards the Aichi Biodiversity Targets of the Strategic Plan for Biodiversity 2011–2020 and the UN Sustainable Development Goals (SDGs) (Bubb, 2013; Tittensor et al., 2014). In our fictional example, the NGO goal of ‘no threatened mammal species go extinct in Africa’ could be measured over the long-term with the IUCN Red List Index (which is also an indicator of Aichi Target and SDG delivery). Recent studies comparing species’ status with predicted or calculated counterfactuals (Hoffmann et al., 2015; Akçakaya et al., 2018) demonstrate how conservation impact action can be estimated with such indicators (assuming monitoring is continued long enough to measure change). In addition, common indicators can monitor scaling up “at the project as well as portfolio level” (GEF IEO, 2019).
Sometimes it is useful to convert indicators into relative scores, such as 0–4 for no progress to high progress, to allow comparisons across sites (e.g., UNEP-WCMC, 2018). However, this can lose detail and the chance to aggregate raw data. The approach can tell you that two out of three projects have increasing elephants, but not that elephants have increased across the programme by x%.
Since some pressure and state indicators will show results only after several years, projects need to have key performance indicators (KPIs) against annual goals to provide some intermediary measures of progress. The KPIs monitoring the performance of projects and programmes will answer the question: how well did organisations deliver on what they set out to do? Some agencies use a performance KPI scoring system, such as WWF’s Conservation Achievement KPI (Stephenson and Reidhead, 2018), where the degree of delivery of an intermediary result for the year is scored. For example, if the Ruaha project staff trained one community in HEC mitigation last year instead of the three they had planned to train, they would score 33% against the intermediary result for HEC.
Monitoring — collect data to measure indicatorsProject indicators need to be measured regularly. A suite of methods and protocols are available, especially for state and pressure monitoring (e.g. Wilson et al., 1996; Birdlife International, 2006; Sutherland, 2006). There are increasing numbers of technological solutions to enhance data collection, from camera traps to environmental DNA sampling, but tools need to be chosen that are appropriate to local capacity, budgets and needs (Stephenson, 2019). Data collection should follow best practices for ensuring robust sampling design, statistical power and consistent replication of methods (da Silva Dias et al., 2017; Stephenson, 2019).
National governments generally collect their own biodiversity data (at least the key elements of relevance to them) but, in some cases, also use global data sets managed by NGOs or international organisations for certain indicators (e.g. the IUCN Red List of Threatened Species managed by IUCN; the Living Planet Index managed by WWF and ZSL; Protected Planet managed by UNEP-WCMC). These data are then used to report against indicators at the national level in National Reports to CBD, the Convention on Biological Diversity (https://www.cbd.int/reports/), and at the global level through synthesis analyses (Secretariat of the Convention on Biological Diversity, 2014; Tittensor et al., 2014). Only by collecting data on common indicators that are relevant at the site, national and global levels are we able to scale up monitoring, aggregate and disaggregate data and demonstrate progress against global goals such as the Aichi Targets.
If governments, NGOs and the private sector use similar indicators, and in many cases the same ones as for CBD and SDG reporting, they will also be able to use common monitoring protocols and collect data in a systematic, standardised way. Standardised monitoring protocols used widely include the Spatial Monitoring and Reporting Tool (SMART; http://smartconservationsoftware.org) to monitor pressures, the IUCN Red List categories and criteria (IUCN, 2012) to assess species status, and Important Bird and Biodiversity Area monitoring (BirdLife International, 2006). More protocols are also being introduced to monitor often-neglected species such as invertebrates and plants (e.g. Van Swaay et al., 2015; Borges et al., 2018).
Data collected in the same way are easier to store in the same (or interlinked) national, regional and global databases and, in turn, are easier to share among partners. For example, if all the elephant PAs in the fictional programme used SMART, poaching levels could be compared across sites, and compared with other agencies also using the tool, nationally, regionally and globally. Similarly, if population data were collected systematically, they could be shared through the African Elephant Database (sensu Thouless et al., 2016) and the Living Planet Index.
Partnerships, such as those between governments, NGOs and academic institutions, are widely encouraged to support data collection (Lindenmayer et al., 2012; Stephenson et al., 2015b; Vugteveen et al., 2015). Local communities can also play a role and citizen science projects are expanding in biodiversity-rich countries.
Monitoring should be implemented at least as long as the project. However, as noted by Lindenmayer and Likens (2010), many projects are funded for only one to three years, a timeframe too short to monitor ecological change. An internal review of WWF programmes found that, due to the time taken to implement work and for species and habitats to recover, it took an average of 10 years for interventions to result in an impact (Sheila O’Connor and PJS, unpublished data). Therefore, wherever possible, monitoring should continue for a relevant period after a project ends. If feasible, data should also be collected at similar sites not subject to conservation interventions to establish counterfactuals (see below). This will need to be factored into project budgets.
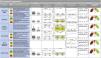
Interpretation — present data in a format of use to managers and other decision makersProgramme managers and other decision makers and policymakers need data in formats that are easy to interpret and act on. Each project or programme should identify which questions it wants the data to answer and how it would like the data to be presented. Trends over time are the key to any meaningful analysis, presented in ways that demonstrate outliers (good or bad) in terms of scale or rate of change. The spatial presentation of data in map form is a powerful way to understand what is happening where. Dashboards that present data in various graphic forms are widely used in the corporate sector (e.g. Eckerson, 2010; Kerzner, 2013) and have been proposed as tools to visualise biodiversity data that monitor NGO goals and Aichi Targets (e.g. Han et al., 2014; Stephenson et al., 2015a). A system developed by WWF (Stephenson and Reidhead, 2018; Fig. 3) collected data through a standardised report format and summarised it in rows: a performance KPI score (showing delivery of annual goals), a summary of achievements and challenges (putting data into context) and then a suite of common PSRB indicators. By aligning common indicators across programmes, reading down columns allows managers to identify outliers (high or low performing programmes) for each measure, facilitating the identification of priorities and decision-making that leads to action. For example, data presented in dashboards that demonstrated the species declining fastest influenced WWF decisions on resource allocation (Stephenson et al., 2015a). In some cases, the development of decision triggers (Foster et al., 2019), defining the level of a measure at which action needs to be taken, can enable data use in adaptive management.
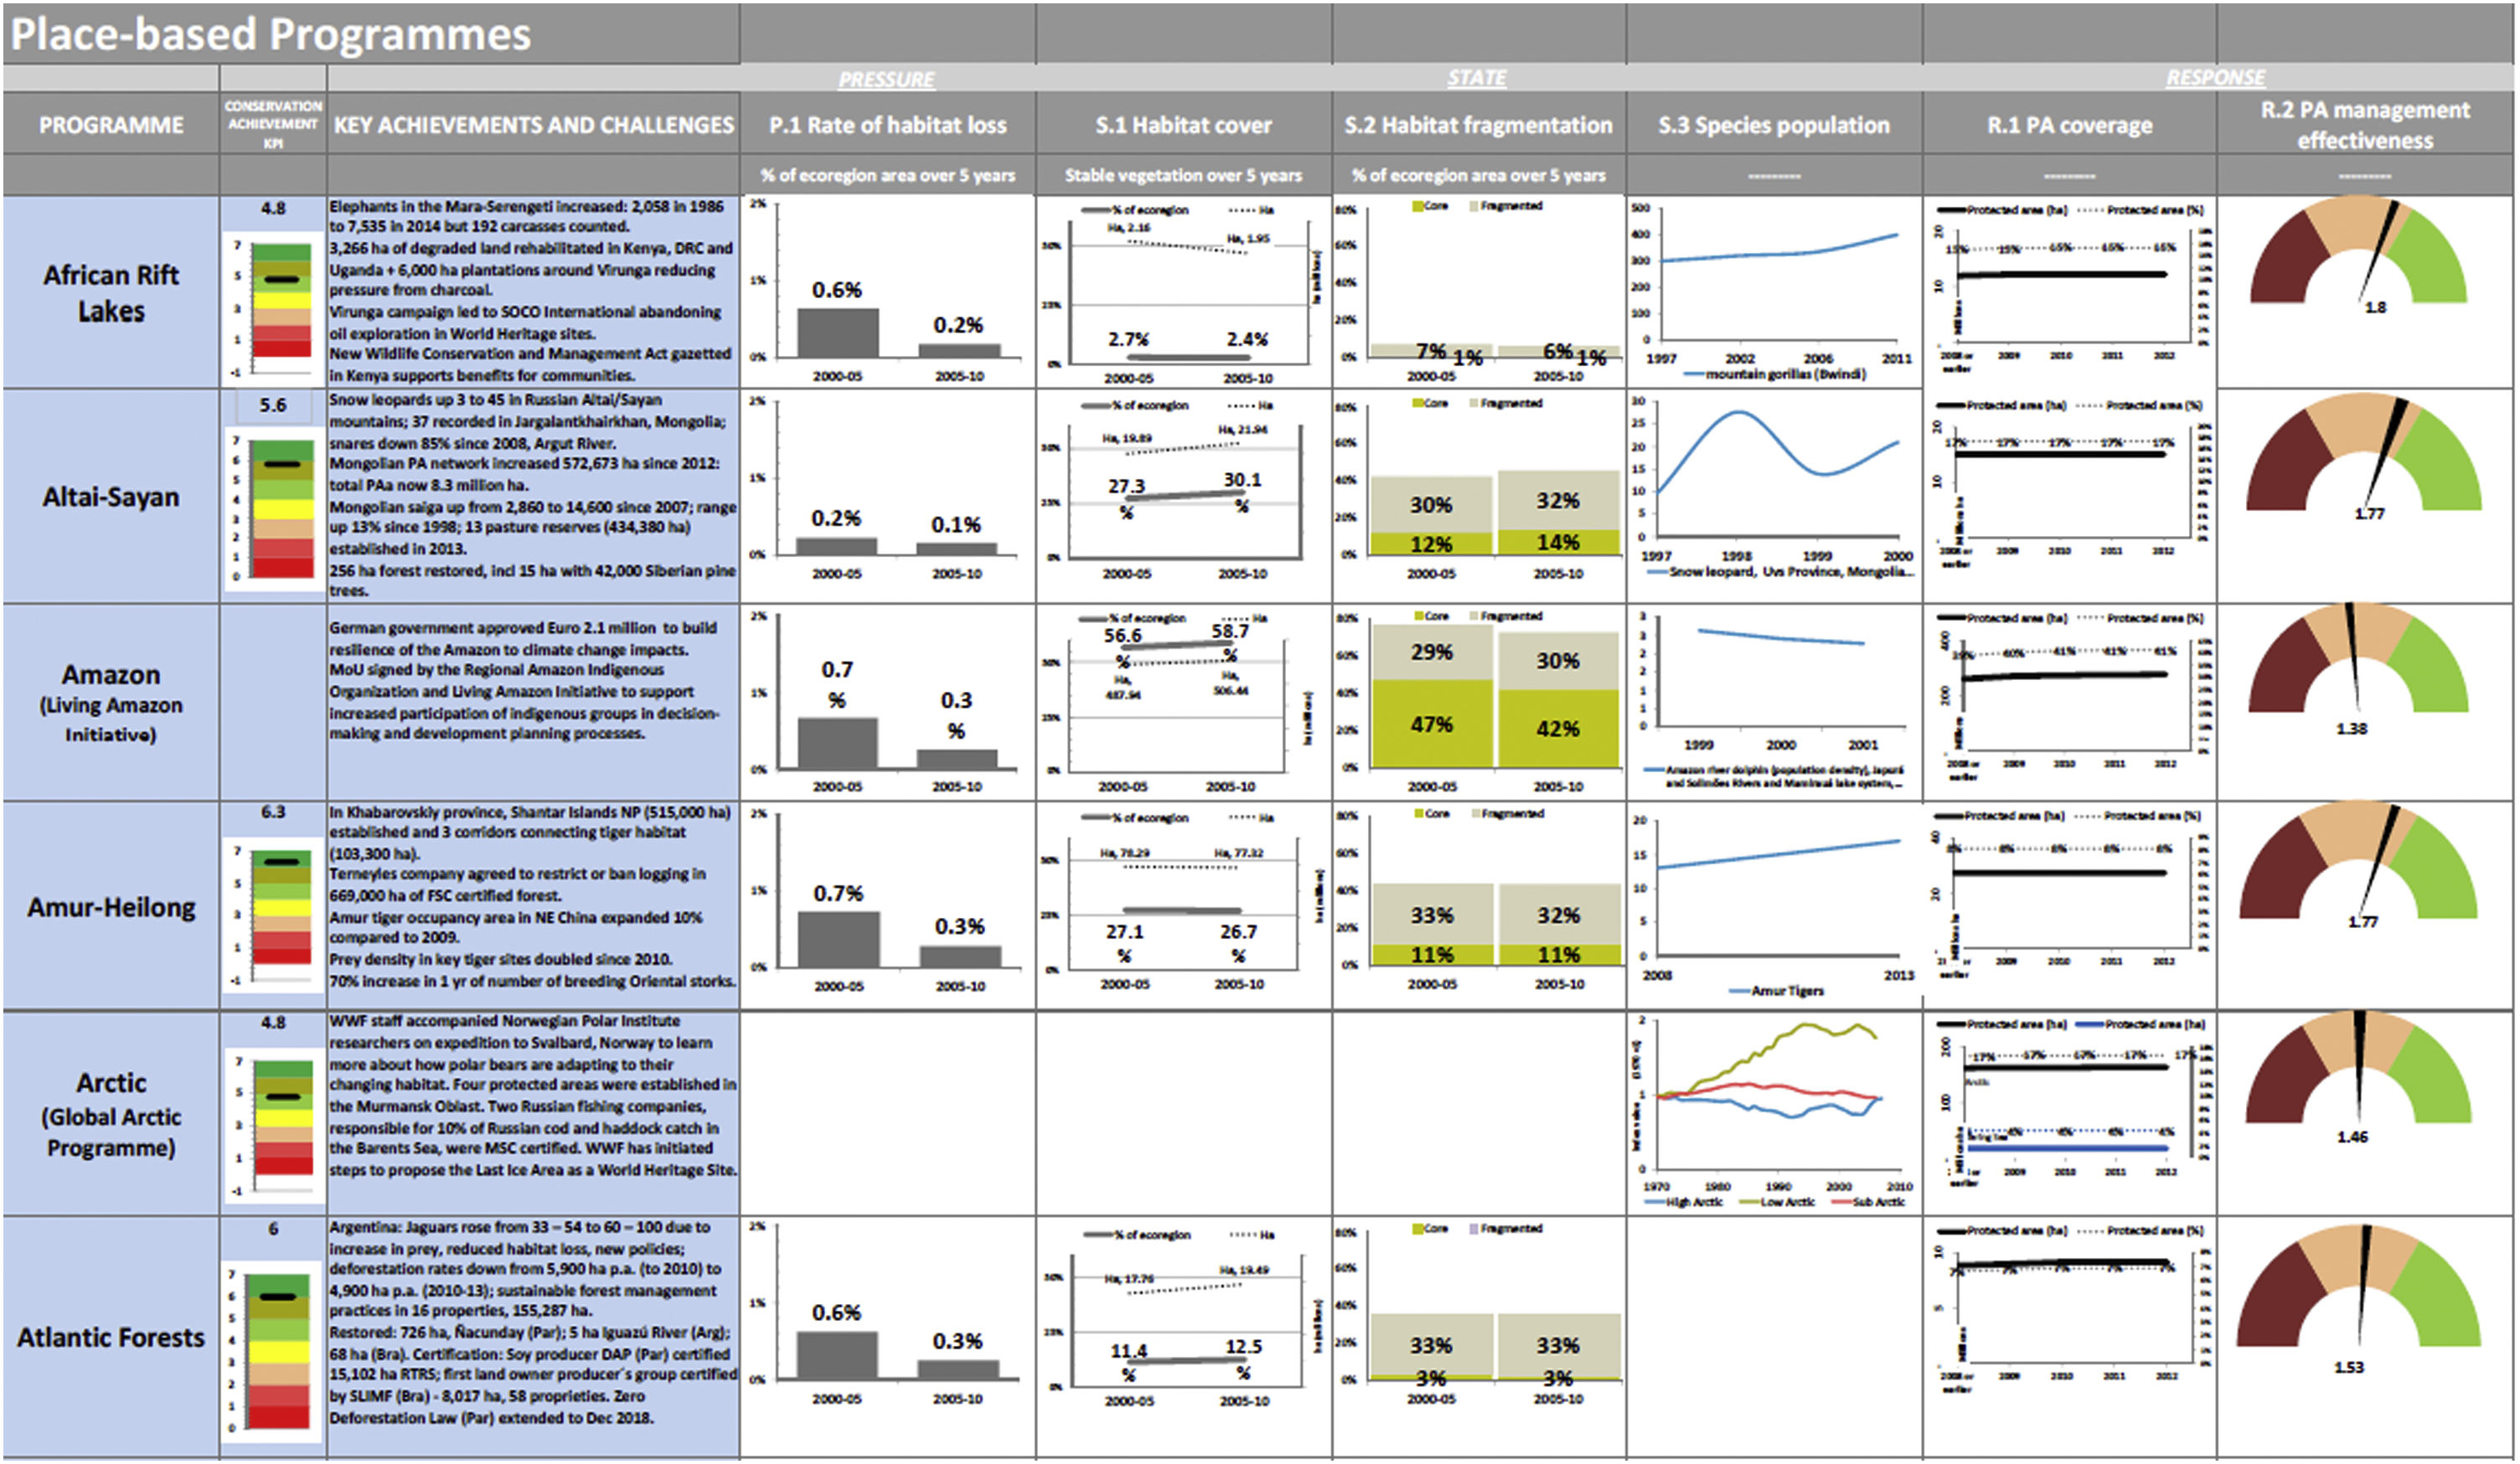
An example of a dashboard to present indicator data. From Stephenson et al. (2015a).
Every project team should use monitoring data on a regular basis, formally and informally, to assess and evaluate progress and make decisions for adaptive management (e.g. redefine objectives, implement new actions and approaches, adapt planning assumptions). While widely advocated in conservation, however, adaptive management is rarely applied in practice (Gillson et al., 2019). There is a tendency for project staff to save data for use in written reports, yet project teams should also discuss the information as it comes in and schedule regular meetings for such analyses.
Formal evaluations are a key element of project cycle management. Evaluations use appropriate methods (e.g. UNEP, 2008; Mascia et al., 2014; Moore et al., 2018) to assess efficiency of delivery of outputs, effectiveness of delivery of intermediate results and outcomes, and impact on conservation targets. Potential adaptive management responses to evaluations are numerous, but include altering strategies, improving plans and systems, and changing human resources. Learning from evaluations should also help shape the future project portfolio. For example, if elephants continued to decline in the Ruaha project site but increased in the Serengeti site, the management team would need to compare strategies and external factors to see what lessons from the successful Serengeti project could be applied to the less successful Ruaha project, or what additional external factors might need addressing (perhaps through a change of objectives). Similarly, if HEC mitigation in the hypothetical elephant programme was far more successful in one project than another, managers could exchange lessons and identify what needs changing.
A project evaluation will go a long way in assessing delivery. However, ultimately, at least for large-scale projects or programmes, conservation policy and practice will be much better informed through impact evaluations (the systematic process of measuring the intended and unintended causal effects of conservation interventions, with emphasis on long-term impacts on ecological and social conditions) and systematic reviews (the review of existing research findings to assess evidence regarding the impacts of conservation interventions) (Mascia et al., 2014). Currently, impact evaluations are far less common in environmental projects than in sectors such as health, education, agriculture and development (McKinnon et al., 2015; Cameron et al., 2016). By using counterfactuals, impact evaluations provide the ultimate method of establishing whether a project had a significant influence on the state of biodiversity or a reduction in threats. It can also facilitate learning and promote accountability (McKinnon et al., 2015; GEF IEO, 2016).
Learning can be facilitated in various ways. Peer review of project reports (having project managers or monitoring staff review each other’s reports) can be productive and facilitate lesson sharing. No-one should ever write a report that just gets filed. Every report writer should receive feedback from, at least, their line manager and, at best, a cohort of their peers, and have opportunities to discuss lessons and decide on responses. The tendency is for these responses to await the final project evaluation, but that may be too late. Feedback should be constant and iterative.
Projects with special considerationsProjects should follow the Five Steps to Conservation Impact regardless of their scope and scale since, like many project cycle standards (e.g. CMP, 2013), the principles and practices apply to all. However, some types of project present specific challenges and certain factors need to be considered (Table 2).
Small- and medium-sized projects (those with budgets under US$100,000 that last 1–5 years) may be too short-lived, or have insufficient capacity or budget, to make it feasible to monitor state indicators. Pressure indicators, or even response indicators, are likely to be more appropriate. However, a strong theory of change will help define the expected impact (e.g. a project focused on building a new ranger post in a gorilla reserve could measure how anti-poaching effort is increased, by monitoring numbers and range of patrols, but in a short timeframe and limited budget may not be able to measure any resultant change in poaching or gorilla populations, although both would be expected in the theory of change).
Very large projects (that cover landscapes or seascapes with multi-million dollar budgets lasting multiple years) should have a more substantial budget for monitoring, yet the geographic scale involved may mean monitoring efforts focus on defined target sites or species populations rather than the whole landscape (e.g. a conservation programme across the Amazon will not be able to monitor jaguars everywhere, but could monitor them in key sites where recovery is planned).
Policy-focused projects (working to change opinions, laws, regulations, strategies, multilateral environmental agreements, etc.) are often implemented far away from the conservation targets concerned. While a direct change in biodiversity state may be harder to monitor or attribute than in other projects, the key is to ensure the project objectives specify which individuals, groups, organisations or policy fora are expected to change so relevant indicators (probably at the response level) can be selected. As with small projects, policy projects will need to rely more on theories of change to explain impact.
Some business projects relating to biodiversity may be similar to policy projects.
For example, efforts to reduce the impact of supply chains on biodiversity often occur through policies and standards (e.g. voluntary certification standards) developed far from the sites. Monitoring will need to be focused on a clear theory of change around identified actors. The key will be to conduct impact evaluations at a selection of sites to ensure policies and standards being applied lead to the desired effects (e.g. certification of a farm producing a key product might be expected to enhance biodiversity, but only occasional impact evaluations will verify this). Site-level evaluations should be complemented with “analysis at larger spatial and temporal scales to evaluate cumulative effects and interactions of farms with surrounding areas” (Milder et al., 2015).
Marine or aquatic projects (conserving biomes where target species and habitats are mostly underwater and hard to monitor) need to choose indicators that are relevant to that context. In coastal waters or shallow lakes some species such as reef fish or sirenians, and habitats such as seagrass beds and mangroves, may be countable, but in deep-water environments proxy indicators may be more feasible (e.g. fisheries catch rates as a proxy for fish populations).
Enabling conditions for impactThere are three key enabling conditions for using the Five Steps to Conservation Impact.
Senior managers are willing to establish a results-based management cultureFor adaptive management to work, it is vital that managers support organisational monitoring standards and reporting systems (Stephenson et al., 2015b). However, there is often a paucity of institutional support for monitoring (Lindenmayer et al., 2012). Not everyone appreciates data since the trends may not reflect the messages they want to send. For example, many people perceive the need to report positive results to their line managers or donors. Wahlén (2014) found that “organisational and managerial pressure to report success is greater than donor pressure”, a reality I have also witnessed. Organisations need to address this by developing a results-based management culture that creates the space to fail, encouraging people to learn and share lessons (Redford and Tabler, 2000). Identification of problems (such as project objectives and results not being met), and the adaptation of strategies and policies to try to rectify them, should be seen as strengths, not weaknesses.
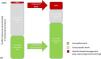
Creating a results-based management culture also means circumventing common excuses that prevent data use. Some people continue to perceive monitoring as “blind data gathering” (Noss, 1990), diverting resources from conservation action. But all action and no monitoring means we have no idea if we attained what we wanted to. Conservation activities that are poorly planned and monitored will deliver fewer successful conservation outcomes and impacts than those that are planned well, monitor progress and adapt in response to lessons learned. A return on investment in planning and monitoring will be a higher proportion of successfully implemented conservation actions (Fig. 4).
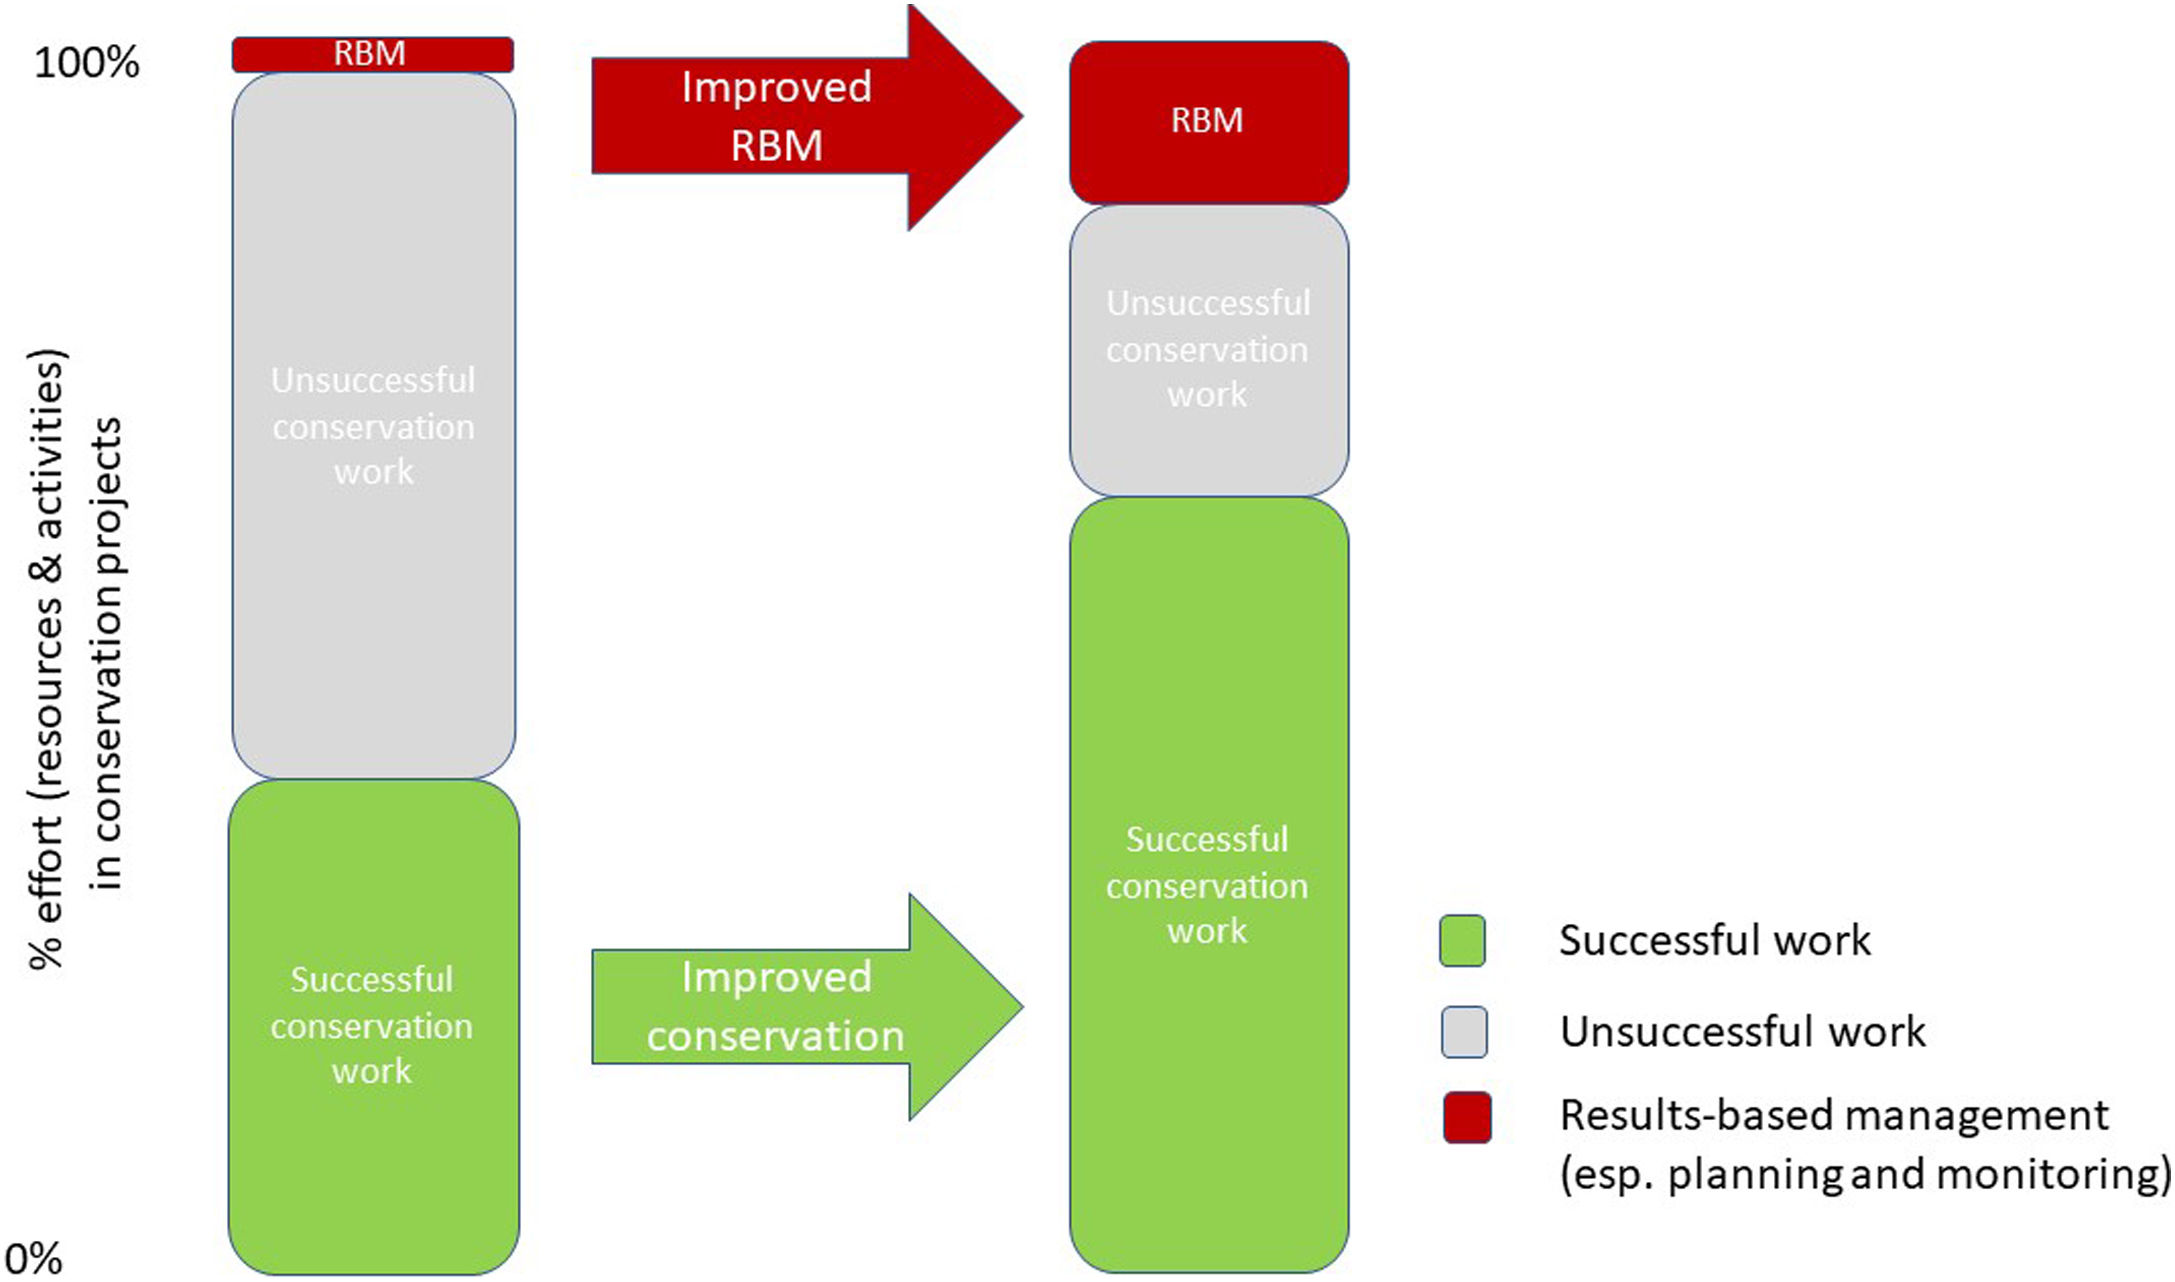
Graphic to explain the theory of change behind results-based management (RBM). Investment in RBM, especially planning and monitoring, will lead to a higher proportion of successful conservation actions and an improved return on investment. Note that the proportions assigned to different categories of effort are only indicative and are not meant to propose a specific level of RBM as that will vary between projects. (Adapted from Foundations of Success and WWF, Conservation Measures Partnership).
Some managers do not see a value in collecting data if their staff cannot prove change was a result of the organisation’s work. There are three main ways to provide an appropriate assessment of attribution depending on the level of resolution available, through what I term the “Three Cs of Attribution” (Table 3): counterfactuals — you can provide evidence of the impact of your actions by demonstrating what happened where conservation was not applied; context — by relating your results to your theory of change you can show that what was expected to happen is happening, suggesting the impact of your actions; and comparison — if you look at similar projects applying similar strategies and demonstrating similar results, you can assume the impact of your actions.
The three Cs of attribution.
| The C | Degree of attribution | Hypothetical example from Wildlife International elephant programme | |
|---|---|---|---|
| Counterfactuals | Monitor sites not receiving project support | Demonstrated | Incidents of HEC are monitored at project sites conducting mitigation and at similar sites where no mitigation measures are employed. If the project sites have less HEC, its impact is demonstrated |
| Context | Monitor in the context of what was expected to happen in the project’s theory of change | Assumed | The theory of change expects mitigation actions to lead to reduced HEC, and so measuring the reduction can be assumed to be a result of the project. |
| Comparison | Compare project results with those of similar projects. | Inferred | Other HEC projects using the same techniques also show reduced HEC, so the project’s impact can be inferred. |
Impact evaluation methods use counterfactuals to compare project sites with sites where no interventions were made (Ferraro and Hanauer, 2014; Gertler et al., 2016). This approach should be the norm, at least for large-scale projects and programmes, as “the differences between the observed conditions and the counterfactual conditions are, by definition, the impacts that we seek to understand” (Ferraro and Pressey, 2015). Sometimes the counterfactual can be a simple measure, especially if collected remotely (like habitat cover or wetland extent), and can provide the necessary extra data without incurring huge costs. By using the context approach from the Three Cs of Attribution, and looking at a project’s theory of change, in some cases lower-level results can be used to make assumptions and lay the basis for some degree of attribution. Additionally, if more than one step in the results chain is measured, it could show interlinkages between PSRB indicators. Comparison can also extend to neighbouring project sites. If a project nearby experiences a dip in habitat cover or water levels due to climatic factors at the same time as your project, it may be easier to demonstrate change due to external rather than project factors.
Capacity and tools are in place to plan and monitor projectsAdoption of project management tools and building capacity for their use contributes to project success (Golini et al., 2015; Brooks, 2017), especially if adapted to the local context (Thapa et al., 2014). However, capacity for planning and monitoring in the conservation sector remains weak (Barlow et al., 2016; Stephenson et al., 2017a), especially in high biodiversity countries in Africa and Asia (Stephenson et al., 2017b).
Steps to Conservation Impact 1 and 2 need to follow a structured approach to project design. The Conservation Measures Partnership’s Open Standards for the Practice of Conservation (CMP, 2013) offer a series of guidelines and tools to take users through the project cycle. Other models (e.g. Andrews et al., 2013; Kapos et al., 2008; Cook et al., 2014; Dickson et al., 2017), or combinations of models (Battisti, 2018), exist. Every organisation will need to decide which system to follow and then build internal capacity for its use to ensure projects are planned and monitored properly, and the data used in reporting, learning, and decision-making for adaptive management. Whichever system is followed, however, the Five Steps to Conservation Impact need to be incorporated and emphasised, otherwise impact may remain elusive. Assigning an appropriate portion of project budgets for planning and data collection is also obviously key. Organisations might consider building national or regional hubs of monitoring expertise comprised of staff who can help projects in-country.
DiscussionThe conservation community must plan and monitor project portfolios better in order to measure impact. The principles defined here are not unique to conservation. Reviews of collective impact from the business sector and social sciences have drawn similar conclusions about the need for a shared vision, common measures, a structured delivery mechanism and collaboration between stakeholders (Hanleybrown et al., 2012; Kania and Kramer, 2013; Christens and Inzeo, 2015). Many elements of the Five Steps to Conservation Impact (including identification of stakeholders, developing conceptual models, gathering and interpreting data) are present in other conservation-related monitoring guidelines (e.g. Fancy et al., 2009; Biodiversity Indicators Partnership, 2011; CMP, 2013; Vugteveen et al., 2015). However, the issue of how to link sites or projects across a portfolio, and the importance of common indicators, are not dealt with adequately.
Many managers want to monitor impact but are not prepared to invest in the capacity required to make it happen. I have been asked by several organisations to develop systems that are both ‘light’ (quick and easy) and ‘meaningful’ (facilitating decision-making), which sums up the general desire of managers to have more information but not have to work hard to collect it. Yet the lighter the system the less meaningful the results it produces. While monitoring should generally be as “simple, robust and cheap” as possible (BirdLife International, 2006), systems need to be appropriate and scale dependent. Small projects might only be able to monitor low-level results (such as outputs), but large projects should strive for monitoring higher-level results, such as outcomes and impacts (Dickson et al., 2017).
Stakeholder engagement is essential. Equitable participation of data providers and users, including local communities, is central to the adaptive management process and can lead to better results and sustainability (Jacobson et al., 2009; Danielsen et al., 2014). Presenting results in formats of use to decision makers facilitates adaptive management (Han et al., 2014; Stephenson et al., 2015a) but, in order to work, communication of results needs to be “timely, include concrete recommendations at relevant spatial scales and be oriented to a wider range of actors who make decisions on biodiversity actions” (Geijzendorffer et al., 2017). Efforts to take account of the differing ways scientists interact and share information with each other and with project managers and policymakers may also enhance communications (da Rocha and da Rocha, 2018).
We need to learn from our experiences of trying to measure conservation impact and share lessons. As well as understanding how planning and monitoring approaches work in different situations, we need a better understanding of the costs of conservation (Waldron et al., 2017) and the costs of monitoring (Juffe-Bignoli et al., 2016). Therefore, project managers should track budget allocations to help determine what it costs to deliver and to monitor delivery. More use of systematic reviews (sensu Mascia et al., 2014) would also help us understand better how and if certain conservation strategies work.
There is no quick and easy solution to improve monitoring. However, the Five Steps to Conservation Impact complement other project management guidelines and help managers aggregate data across project portfolios by placing more emphasis on the need for common goals, common indicators and structured data collection and use. Their application means that, with some concerted effort and a willingness to move beyond the basic norms, organisations can demonstrate palpable contributions to global biodiversity conservation.
We need a culture change, where results-based management and evidence-based decision-making become the rule, not the exception. If key stakeholders (governments, international organisations, NGOs, local communities, businesses and donors) created the right enabling conditions and followed the same basic planning steps, we would be closer to measuring project performance and goal delivery. This would facilitate adaptive management, ultimately enhancing the efficiency, effectiveness and impact of biodiversity conservation.
Declaration of interestsThe authors declare that they have no known competing financial interests or personal relationships that could have appeared to influence the work reported in this paper.
I am grateful to numerous colleagues at IUCN and WWF, and within the IUCN SSC Species Monitoring Specialist Group and Biodiversity Indicators Partnership, for many discussions over recent years as we try to crack the nut of impact monitoring for conservation. Stephanie Mansourian, the journal editor and two anonymous referees provided very useful feedback to help improve the manuscript. This research did not receive any specific grant from funding agencies in the public, commercial, or not-for-profit sectors.