The principal strategy used to deal with animals recovered from trafficking operations is to release them back into nature. Our goal was to test the feasibility of using vocalizations to determine the origins of the recovered birds. We used ecological niche modeling to predict the potential distributions of four species: Crypturellus soui, Diopsittaca nobilis, Sicalis flaveola, and Thamnophilus doliatus. Modeling was performed with MaxEnt, which uses geographic coordinates from known specimens and local abiotic variables. To test the resulting model, we examined whether the vocalizations could be correctly classified into generated patches using a multinomial regression. An efficient call classification would support the niche models and indicate the existence of a spatial acoustic structure that could be used to determine a bird's geographic origin. The models adjusted well to our data, giving AUC values between 0.88 and 0.94. While T. doliatus calls showed a clear acoustical structure in which the majority of their calls were correctly classified among the model patches, the three remaining test species presented intermediate patterns in which only calls from a single patch were correctly classified. The method appears to be best applied to species not demonstrating vocal learning, despite the fact that the calls of C. soui showed intermediate effectiveness in classifying their origins. While vocal plasticity could lead to low classification efficiency, it also may aid the re-adaptation of reintroduced birds, making our methodology efficient when it matters the most, or when the cost of releasing individual birds outside of their original ranges would be high.
Wildlife trafficking is one of the largest and most profitable illegal activity in the world, ranking only behind illegal weapons and drugs. It is estimated that this commerce generates from 10 to 20 billion dollars annually (RENCTAS, 2002), with birds being among the main contraband items. Over 2600 bird species (27% of all existing species) were recorded in international trade documents between 1970 and 1990 (Gulx et al., 1997). In Brazil there are at least 295 bird species currently being traded as pets (Nobrega Alves et al., 2013), and 130 species in Peru (Daut et al., 2015). Wildlife commerce has largely contributed to the extinction of the Glaucous Macaw Anodorhynchus glaucus and Spix's Macaw Cyanopsitta spixii (Marini and Garcia, 2005), and certainly exerts negative pressures on wild populations of other bird species. In fact, habitat destruction and animal trafficking are two of the main factors influencing bird extinctions (Marini and Garcia, 2005).
Concerns about the impact of wildlife trade united 80 countries in 1973 in establishing rules to control and regulate the commerce of wildlife species, which resulted in the Convention on International Trade in Endangered Species of Wild Fauna and Flora – CITES. Many governments (including Brazil) have gone well beyond CITES, prohibiting all wild animal trade within their national territories. Governmental agencies in these countries (such as IBAMA in Brazil) invest human and monetary resources in surveillance to arrest illegal dealers and rescue animals, including birds. As a consequence of these actions, a single small facility designed to receive apprehended birds (CETAS) in Paraiba State receives 5000 animals annually! If, on the one hand, these measures have long-term inhibiting effects on the illegal trade in animals and can reduce negative impacts on the local fauna – they can also lead to short-term problems, such as what should IBAMA do with all the birds it seizes from wildlife traffickers?
In light of the ethical issues involved, there are only three basic ways to handle recovered birds: (1) return them to their natural habitats; (2) keep them in captivity; or, (3) sacrifice them (IUCN, 2000). Returning them to nature is by far the most widely used strategy, and is most often adopted by wildlife regulatory and management agencies. When not carried out properly, however, this option brings little benefit to the birds involved – and can even harm local bird populations (Efe et al., 2006; Marini and Garcia, 2005). Side effects include high mortality rates of the released animals, the risk of invasive situations, the transmission of diseases and parasites, and the hybridization of otherwise genetically distinct races or subspecies (IUCN, 2000).
In spite of the difficulties involved in identifying the populations of origin (or subspecies) to which recovered individuals belong, returning seized birds to nature represents the most appropriate option, as it would allow them to fulfill their biological role. If, however, these birds are released outside of their original population ranges they may compromise native populations through the introduction of exotic genes. Evolution can be defined as a dynamic process in which the proportions of specific genes change within a population over time. Thus, although present in other populations of the same species, the introduction of geographically exotic genes may compromise the delicate evolutionary history of a local population and act against the conservation of unique historical evolutionary processes.
In order to truly safeguard the genetic lineages of birds, one must determine the origins of captured individuals before releasing them. With this in mind, the Brazilian Institute of the Environment and Renewable Natural Resources (IBAMA, 2008) determined that recovered specimens could only be reintroduced into the natural environment if the original capture site was known. Considering that evolutionary processes occur locally and result in local genetic differences, there is an urgent need for methodologies capable of efficiently and inexpensively determining the origins of birds recovered from illegal traders. Such methods would avoid the continued confinement or useless sacrifice of captured birds and promote their release back into the wild. The use of genetic markers is not currently feasible because of a lack of genetic data on most wild bird populations, the fact that genetic characterizations require invasive procedures, and because the genetic characterization of a species throughout its distribution range would be very expensive. For these reasons, it is not yet possible to use large-scale genetic information to determine the geographical origins of individual birds.
Although a genetic approach is not currently feasible for determining release locations, ecological considerations offer a promising option for determining the spatial distributions of many organisms. It has been known for some time that different species use different portions of any given environment because of habitat differences or past competition (Elton, 1927). These spaces are called niches, and can be defined as the multivariate space in which a given species persists (Hutchinson, 1957). Once it has been recognized that the environment in any geographic space is spatially heterogeneous, it is reasonable to conclude that different species will occupy different portions of it – being ultimately determined by biotic or abiotic environment characteristics (see a review in Soberón and Nakamura, 2009). If we can understand how habitats are used by a species, we may have a handle on potential areas to release recovered birds.
The distribution of a species can now be estimated based on environmental niche characteristics. Ecological Niche Modeling uses the locations of known occurrences of a target species to model its environmental niche – and then uses that model to project its potential geographical distribution (Costa et al., 2008; Costa and Schlupp, 2010; Marini et al., 2010; Pearson and Dawson, 2003; Peterson, 2003, 2001; Peterson et al., 2002, 2007; Peterson and Kluza, 2005). The areas of high probability pointed out by ENM represent places in which the climate is most favorable to the target species. The distribution of suitable habitats, as well as how those habitats are isolated from one another, are the cornerstones of evolutionary divergence (Schluter, 2000), as environmental isolation should produce morphological, genetic and/or acoustical differences among populations.
Although it is possible to use both genetic and morphological data to assess differences between isolated populations, the use of acoustical data may also represent a promising approach as: (1) there are large amounts of accumulated data currently available online (approximately 170,000 recordings of South American Birds; de Araújo and Marques, 2013) that can be easily accessed from the websites of the Macaulay Library, Fonoteca Neotropical Jacques Vielliard, Xenocanto, or Wikiaves; (2) acoustical methods are minimally intrusive, with no necessity of handling or capturing any bird (in the wild or in captivity); (3) acoustical analytical methods are easily implemented in software such as R or Raven; and, (4) the costs of recovering and storing bioacoustic data are much lower than the costs required for acquiring and holding specimens, skins, or genetic data.
Considering the Brazilian scenario, we propose here: (1) to use the geographical coordinates of known occurrences of target species to build hypothetical geographical population structures based on ENM; (2) use bioacoustics to test the validity of those ENM predictions; and, (3) determine if there is enough information contained in bird calls to allow the geographic identification of captured specimens. Although this paper restricts itself to Brazil, we believe many countries that prohibit illegal trading in birds face similar problems, so that this methodology may offer an inexpensive and efficient alternative to identifying the origins of recovered birds and allow their successful release to nature.
Materials and methodsTarget speciesFour species were chosen based on their phylogenies and call characteristics: Diopsittaca nobilis (non-Passeriformes) and Sicalis flaveola (oscines-Passeriformes), whose vocalizations show greater influences of learning components, and Crypturellus soui (non-Passeriformes) and Thamnophilus doliatus (Suboscines-Passeriformes), whose vocalizations show strong genetic components (sensuMarler, 2004). These species have wide distributions with favorable spatial structures for this type of investigation (several suitable habitat patches surrounded by unsuitable environments), and sound recordings are available for them.
C. soui belongs to the family Tinamidae. It inhabits both humid and dry environments, such as the edges of dense forests, dry forests, sandbanks, etc. It occurs from Mexico to Bolivia and Brazil (including the states of Espirito Santo, Rio de Janeiro, Minas Gerais, and Mato Grosso). These birds are adapted to terrestrial life, and their flights tend to be short and heavy. Their song is composed of a mild chirp with a tremulous tone with rising long sequences and descending whistles (Sick, 1997; Fig. 2). The learning component of the Tinamidae call is virtually nonexistent (Bertelli and Tubaro, 2002).
D. nobilis belongs to the family Psittacidae. It has a wide distribution that includes Venezuela, Suriname, Guyana, and Brazil (Mato Grosso State) to Bolivia, inhabiting savanna formations and forest borders (Collar, 1997; Sick, 1997). Most parrots have large vocal repertoires (de Araújo et al., 2011; de Moura et al., 2011), and we selected the flight call of this species (sensu Moura et al., 2011) for the study because it encodes species-specific information (de Araújo, 2011; de Araújo et al., 2011). The flight call of D. nobilis species is composed of two notes with similar structures, with an upward modulation followed by a downward modulation (Fig. 1). Parrots are known to be open-ended learners that can alter their vocalizations throughout their lives (Salinas-Melgoza and Wright, 2012).
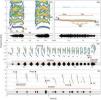
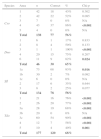
Sonograms of the target species indicating the vocal measurements used in the analyses. FI, initial fundamental frequency; FF, final fundamental frequency; FP, fundamental frequency of the first peak; FUP, fundamental frequency of the last peak; Fmax, maximum fundamental frequency; Fmin, minimum fundamental frequency; NM, number of modulations; DN1, duration of first part; DN2, duration of the second part; DN3, duration of third part; I.N., inter-note interval; DNM, duration of the unmodulated part; D.M., duration of the modulated part.
S. flaveola is songbird belonging to the family Thraupidae. It is commonly found in open and semi-open areas in South America, including northern Colombia, Venezuela, Trinidad and Tobago, western Peru, Ecuador, eastern Brazil, Bolivia, Paraguay, Uruguay, and northern Argentina. The song of this species is composed of quick modulated notes that form phrases. As a songbird, the species is expected to possess a strong learning component in its acoustical communication (Sick, 1997).
T. doliatus belongs to the family Thamonophilidae. It inhabits both forests and open areas from Mexico throughout Central America, and a large part of South America to northern Argentina, Bolivia, and Paraguay (Sick, 1997). The species’ song is composed of phrases in which the notes are quickly modulated and uttered at a rising rate. The vocalizations of Thamonophilidae are considered to be innate and to reflect their genetic structure (Isler et al., 2005).
Ecological Niche ModelingEcological Niche Models (ENM) were used here to classify the relative suitability of habitats based on their abiotic factors across the total geographic range of those birds. Ecological Niche Modeling uses localities with known occurrences of a given species and the environmental characteristics of those areas to determine its environmental preferences, that is, the intervals of environmental variables in which species is most likely to occur. The maps generated by Ecological Niche Modeling (ENM) are usually composed of patches of apparent high environmental suitability separated by areas of less suitable environments. These maps represent hypothetical distributions of those species, highlighting isolated and disjunct populations that could diverge genetically, morphologically, and/or acoustically. Hence, if ENM can explain a species’ distribution, and if we can determine to which suitable patch a bird belongs, we could identify (with reasonable accuracy) the best areas to release a recovered specimen.
We used Maxent 3.3.3k software, which has performed well in diverse sets of modeling scenarios and has been used in a great number of ecological, biogeographical, and conservation studies (Elith and Leathwick, 2009). The Maxent algorithm uses the maximum entropy principle to fit a probability distribution for species occurrence to a set of pixels across the region of interest. For a detailed explanation on how the maximum entropy principle applies to ENM, please referred to Elith et al. (2011). The reference localities were obtained from records retrieved from the portals ORNIS (http://ornisnet.org and ornis2.ornisnet.org) and Species-link (http://splink.cria.org.br). During our search, we also used the term Ara nobilis, to account for the previous taxonomic designation of D. nobilis. A total of 90 independent occurrence points were obtained for D. nobilis, 95 for C. soui, 96 for S. flaveola, and 117 for T. doliatus.
We used those points to produce the Ecological Niche Models (ENM) employing MaxEnt software; the models were evaluated based on the area under a receiver operating characteristic (ROC) curve (AUC; Costa and Schlupp, 2010; Lozier et al., 2009; Marini et al., 2010; Peterson et al., 2007). We used environmental layers from Project Worldclim (Hijmans et al., 2005) at a spatial resolution of 30″ (1km2). The layers extended between longitudes 78°31′W to 35°W, and between latitudes 12°47′N to 34°46′S, corresponding to most of South America. To ensure data independence, we removed self-correlated environmental layers from the analyses based on correlations greater than 0.9 (a similar procedure can be found in de Araújo et al., 2014). We repeated the process until no correlations higher than 0.9 were found, leaving the following environmental layers: Bio 3 (isothermy), Bio 4 (temperature seasonality), Bio 7 (annual temperature range), Bio 10 (mean temperature of the warmest quarter), Bio 11 (mean temperature of the coldest quarter), Bio 14 (precipitation in the driest month), Bio 15 (precipitation seasonality), Bio 16 (precipitation in the wettest quarter), Bio 17 (precipitation in the driest quarter), and altitude. Once the models were built, the maps were analyzed and classified according to the presence of isolated patches of high habitat suitability (which were then numbered).
Bioacoustics dataCall recordings were obtained from reference collections at Fonoteca Neotropical Jacques Vielliard (Unicamp), Macaulay Library (Cornell), Wikiaves, and Xenocanto. After examining the available recordings, we selected 540 files based on their overall quality (signal to noise ratio). These recordings were filtered (high pass filter at 160Hz) and the amplitudes were normalized to 0dB before the analyses. This procedure standardizes the recordings and reduces problems arising from comparing parameters between recordings (Zollinger et al., 2012). Editing and sound measurements were performed using Cool Edit Pro 2.0 software.
Selecting specific acoustical parameters to be measured is a complex process and depends upon the physical structure of each signal. Also, before we could choose acoustical parameters, we had to select a specific component from the vocal repertoire of the species. Only a portion of the vocalizations within a repertoire encodes the species-specific information, and among the repertoire components we have chosen the songs, for it contains the species information that could guarantee call homology, while it is commonly heard in the field (Vielliard, 1987). As for the macaw species, we decided to use contact calls here defined as the call uttered while in flight (de Moura et al., 2011), for it encodes species information and it is also very common (de Araújo et al., 2011). In order to choose the acoustical parameters, we examined a small sample of the dataset to ensure that the parameters would be measurable throughout the sample. Even though some bird species have noisy and pulsed calls (e.g., Marques et al., 2010), bird calls are typically composed of a melodic structure in which call frequencies follow a harmonic series and are modulated over time. There are at least six parameters that can be measured in virtually every melodic call, and we used all of them to create the measurement map. The initial (FI), final (FF), maximum (FMax), and minimal (FMin) fundamental frequencies and call durations (D) were measured directly from a spectrogram, while the dominant (FD) frequency was measured from a power spectrum (Fig. 1). Additionally, we selected landmarks on the spectrogram to refine our measurements and improve the data. The flight call of D. nobilis, for example, has two notes, and each note can be divided in three portions, an upward frequency modulation portion (D1), a quick modulated portion (D2), and a final downward modulated portion (D3; Fig. 1, upper right sonogram). By using those landmarks, we were able to measure the frequencies at the end of the first (FP1) and second portions (FP2; Fig. 1, upper left sonogram). Additionally we counted the number of modulations found within the middle portion and, as there are two notes, likewise measured the Inter Note Interval (IN) of the flight call.
We used a similar approach to create a measurement map for C. soui. We were able to divide its call into a modulated and a non-modulated portion, and measured their durations (Dm and Dnm respectively; Fig. 1, upper right sonogram). Additionally we measured the initial (FI), final (FF), maximum (Fmax), and minimal (Fmin) fundamental frequencies and dominant (FD) frequency from the power spectrum (Fig. 1, upper left sonogram).
The remaining species (S. flaveola and T. doliatus) showed higher levels of organization, as their calls are composed of phrases (groups of notes). Although some studies have opted to measure each note and describe the calls based on their note compositions (e.g., Silva et al., 2000), we chose to restrict our measurements to the macro-structures of the phrases for S. flaveola. We therefore measured the total durations of the phrases, the initial (FI), final (FF), maximum (FMax), and minimal (FMin) fundamental frequencies of each phrase, the dominant (FD) frequency, as well as the mean note rate (calculated from the mean period [1/note period] measured) as shown in Fig. 1. As the last note of the song of T. doliatus presents a distinct structure, we also measured last note's temporal and espectral parameters.
Statistical analysesWe examined the existence of collinearity among call parameters before performing the analyses, by calculating the variance inflation factor (VIF). Collinearity could make it more difficult to detect any effects, and one strategy consists in sequentially calculating the Variance Inflation Factor (VIF) and dropping the covariate with the highest VIF, recalculating the VIFs and repeating the process until all VIFs are smaller than a pre-selected threshold (Zuur et al., 2010). Here, we removed all of the vocal parameters that presented values higher than 3 (Zuur et al., 2010), with only the remaining variables being used in the analysis. The full list of the parameters kept for each species is presented in Table 1 (the full model).
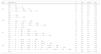
Multinomial regression model selection for the area of the recording in relation to call parameters.
| Spp | Model (area∼) | K | AICc | ΔAICc | Wi |
|---|---|---|---|---|---|
| Cso | NM+FI | 12 | 383 | 0.0 | 0.99 |
| DM+NM+FI | 16 | 393 | 10.0 | 0.01 | |
| Ano+DM+NM+FI | 20 | 401 | 18.1 | 0.00 | |
| Ano+Fmax+DM+NM+FI | 24 | 422 | 39.2 | 0.00 | |
| Null | 4 | 476 | 93.5 | 0.00 | |
| Dno | DN3+NM | 12 | 125 | 0.0 | 0.74 |
| DN2+DN3+NM | 16 | 127 | 2.2 | 0.25 | |
| Null | 4 | 134 | 9.1 | 0.01 | |
| Ano+DN2+DN3+NM | 20 | 145 | 20.6 | 0.00 | |
| Ano+FF+DN2+DN3+NM | 24 | 176 | 50.8 | 0.00 | |
| Ano+FF+DN1+DN2+DN3+NM | 28 | 221 | 96.1 | 0.00 | |
| Sfl | Ano+ER+Fmin | 12 | 314 | 0.6 | 0.39 |
| Ano+D+ER+Fmin | 16 | 317 | 3.8 | 0.08 | |
| Ano+D+ER+Fmin+FD | 20 | 321 | 7.8 | 0.01 | |
| Ano+D+ER+Fmax+Fmin+FD | 24 | 329 | 15.8 | 0.00 | |
| Ano+D+ER+Fmax+Fmin+FFI+FD | 28 | 338 | 24.6 | 0.00 | |
| Null | 4 | 339 | 26.1 | 0.00 | |
| Tdo | Ano+D+Fmax+DL+FDL | 36 | 456 | 0.0 | 0.50 |
| Ano+D+Fmax+FF+DL+FDL | 42 | 456 | 0.2 | 0.46 | |
| Ano+D+Fmax+FF+DL+FmaxL+FDL | 48 | 461 | 4.8 | 0.04 | |
| Ano+D+ER+Fmax+FF+DL+FmaxL+FDL | 54 | 472 | 16.6 | 0.00 | |
| Ano+D+ER+Fmax+FF+DL+FMaxL+FIL+FDL | 60 | 495 | 39.5 | 0.00 | |
| Ano+D+ER+Fmax+FI+FF+DL+FmaxL+FIL+FDL | 66 | 523 | 67.1 | 0.00 | |
| Null | 6 | 644 | 188.3 | 0.00 | |
Spp (Species): Cso, Crypturellus soui; Dno, Diopsittaca nobilis; Sfl, Sicalis flaveola; Tdo, Thamnophilus doliatus; K, number of parameters; AICc, second-order Akaike's information criteria; ΔAICc, variation in AICc to best model; wi, Akaike's weight. Vocal parameters: NM, number of modulations; FI, initial fundamental frequency; FF, final fundamental frequency; year, year of the recording; Fmax, fundamental frequency maxima; Fmin, fundamental frequency minima; DM, duration of the modulated portion of the call; NM, number of modulations; DN1, duration of the first portion of the call; DN3, duration of the third portion of the call; D, call duration; ER, emission rate; FD, dominant frequency; NN, number of notes; DL, last note's duration; FmaxL, last note's fundamental frequency maxima; FIL, last note's initial fundamental frequency; FDL, last note's dominant frequency.
We used a multinomial logistic regression to classify the calls of different ENM patches based on vocal parameters. We used the year of the recording as a covariate to control for possible changes in call structures over time. We selected candidate models through a stepwise approach in which we compared a full model (all variables included) against partial models built by suppressing a single variable for each partial model. We used second-order Akaike's information criteria (AICc) to select the model with the lowest AICc, and permanently removed the suppressed variable from the model. The selected model was then used as base model in the next round, which further suppressed variables one at a time. We repeated this process until the best model was the one built without the removal of any additional variable. To select the final models, we compared the AICc value of the candidate models (the full model and base models of each round) to a null model. The model with the minimum AICc value is the one which minimizes information loss (Burnham and Anderson, 2002), and thus retains the highest empirical evidence. The final model was used to predict the original patch of the calls with the use of a multinomial regression. In order to examine the model classification efficiency we built a confusion matrix that presents the percentage of correct classification of the calls among patches, and compared these values to that expected by chance through a chi-squared test. Hence, despite we used AUCc metric to select the best model, we chose to test the model's classification efficiency through a chi-squared.
As low differences in AICc values (ΔAICc) indicate support for multiple models (Burnham et al., 2011), we kept the models with a ΔAICc of 4 to test if they could improve call classifications. We also estimated the strength of the evidence for each model by calculating Akaike weights (Wi), which measure the probability that the ith model is the best model; we also estimated the evidence ratios (ER) that measure the empirical evidence for the best model relative to the target model (Burnham et al., 2011. The multinomial models were built using R software (R Core Team, 2015) with the nnet package (Ripley and Venables, 2011), while the models were selected by using the AICcmodavg package (Mazerolle, 2011).
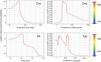
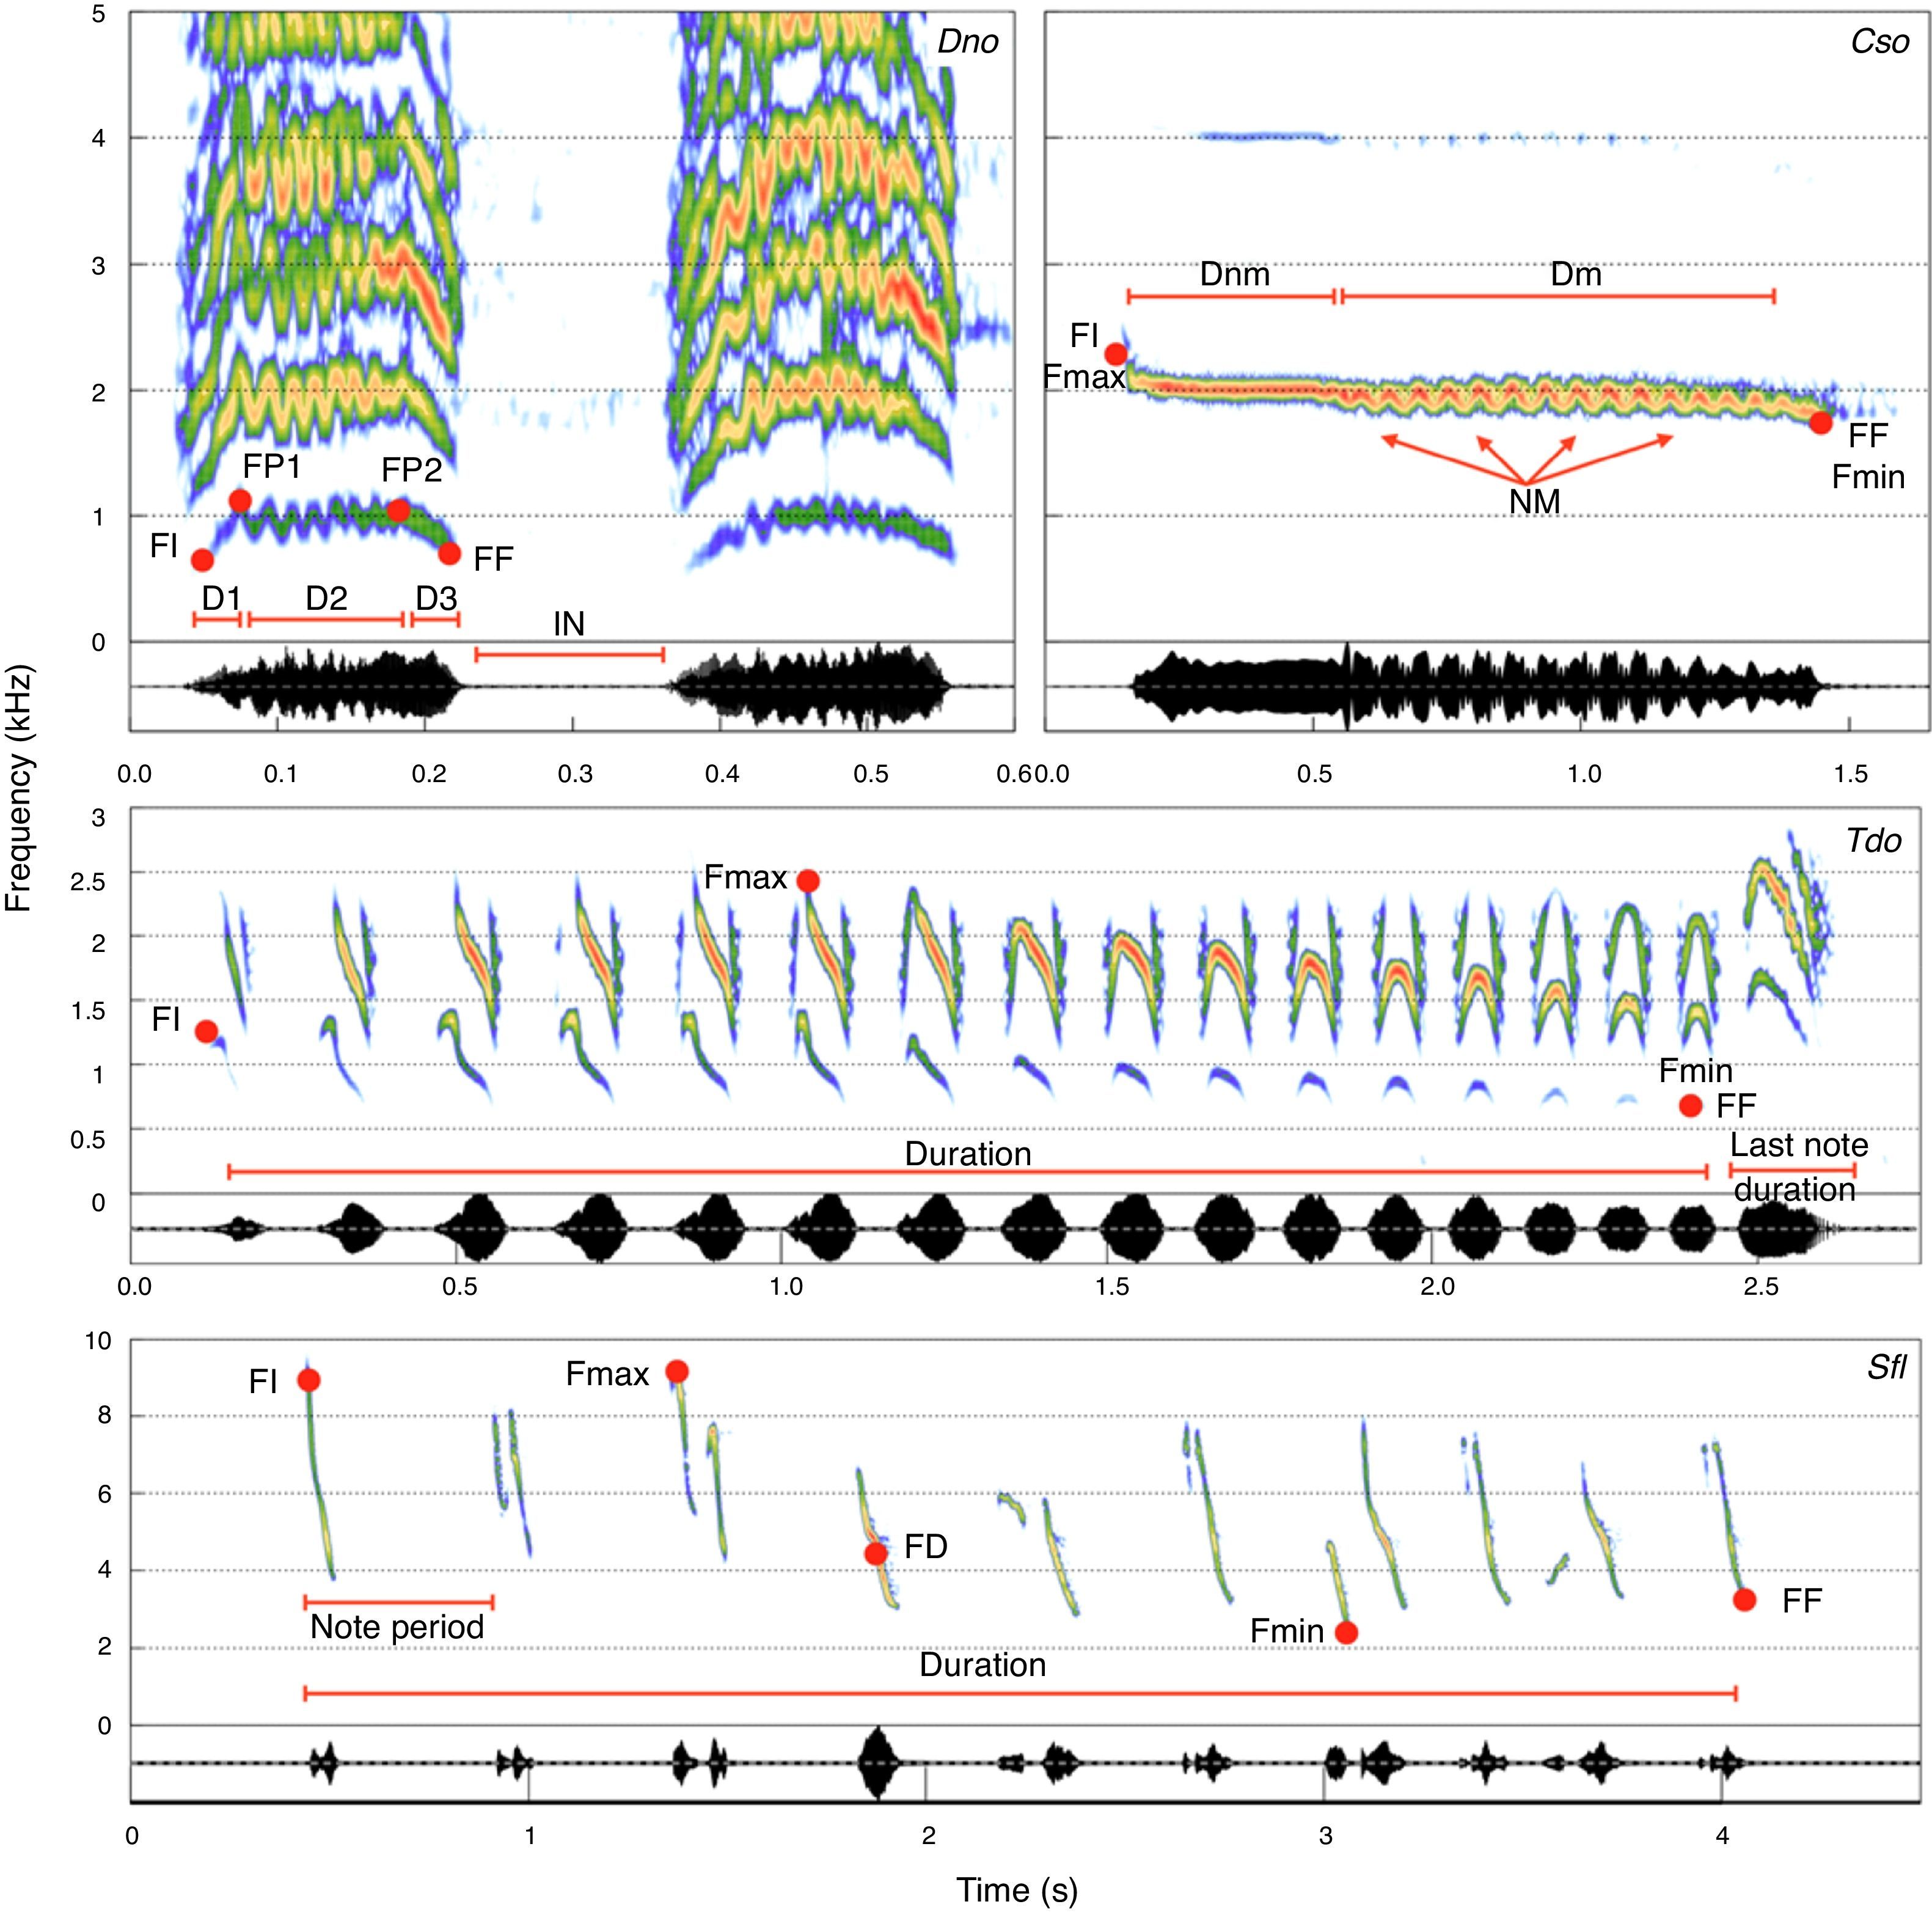
ResultsEcological niche modelingThe Ecological Niche Models (ENM) demonstrated satisfactory performances, with the ENM of C. soui having an AUC value of 0.936, D. nobilis an AUC value of 0.907, S. flaveola an AUC of 0.926, and T. doliatus an AUC value of 0.877. The annual temperature range had a 38.1% relative contribution to the C. soui model, and the habitat suitability of C. soui was highest in areas with an annual temperature range lower than 150°F (Fig. 3, upper right). Precipitation during the wettest quarter was the variable that relatively most contributed to the D. nobilis model (29.2%), and habitat suitability was highest in areas with precipitation in the wettest quarter ranging from 500 to 1000mm (Fig. 3 upper right). Isothermality was the variable that relatively most contributed to the model of S. flaveola (21.3%), and habitat suitability was highest around 60 (Fig. 3 lower left). Temperature seasonality was the variable that relatively most contributed to the model of T. doliatus, and low habitat suitability was found for Temperature seasonality higher than 3000 (standard temperature deviation*100). Despite the differences in the response curves, all of the models showed high habitat suitability regions as well as low suitability regions (Fig. 2).
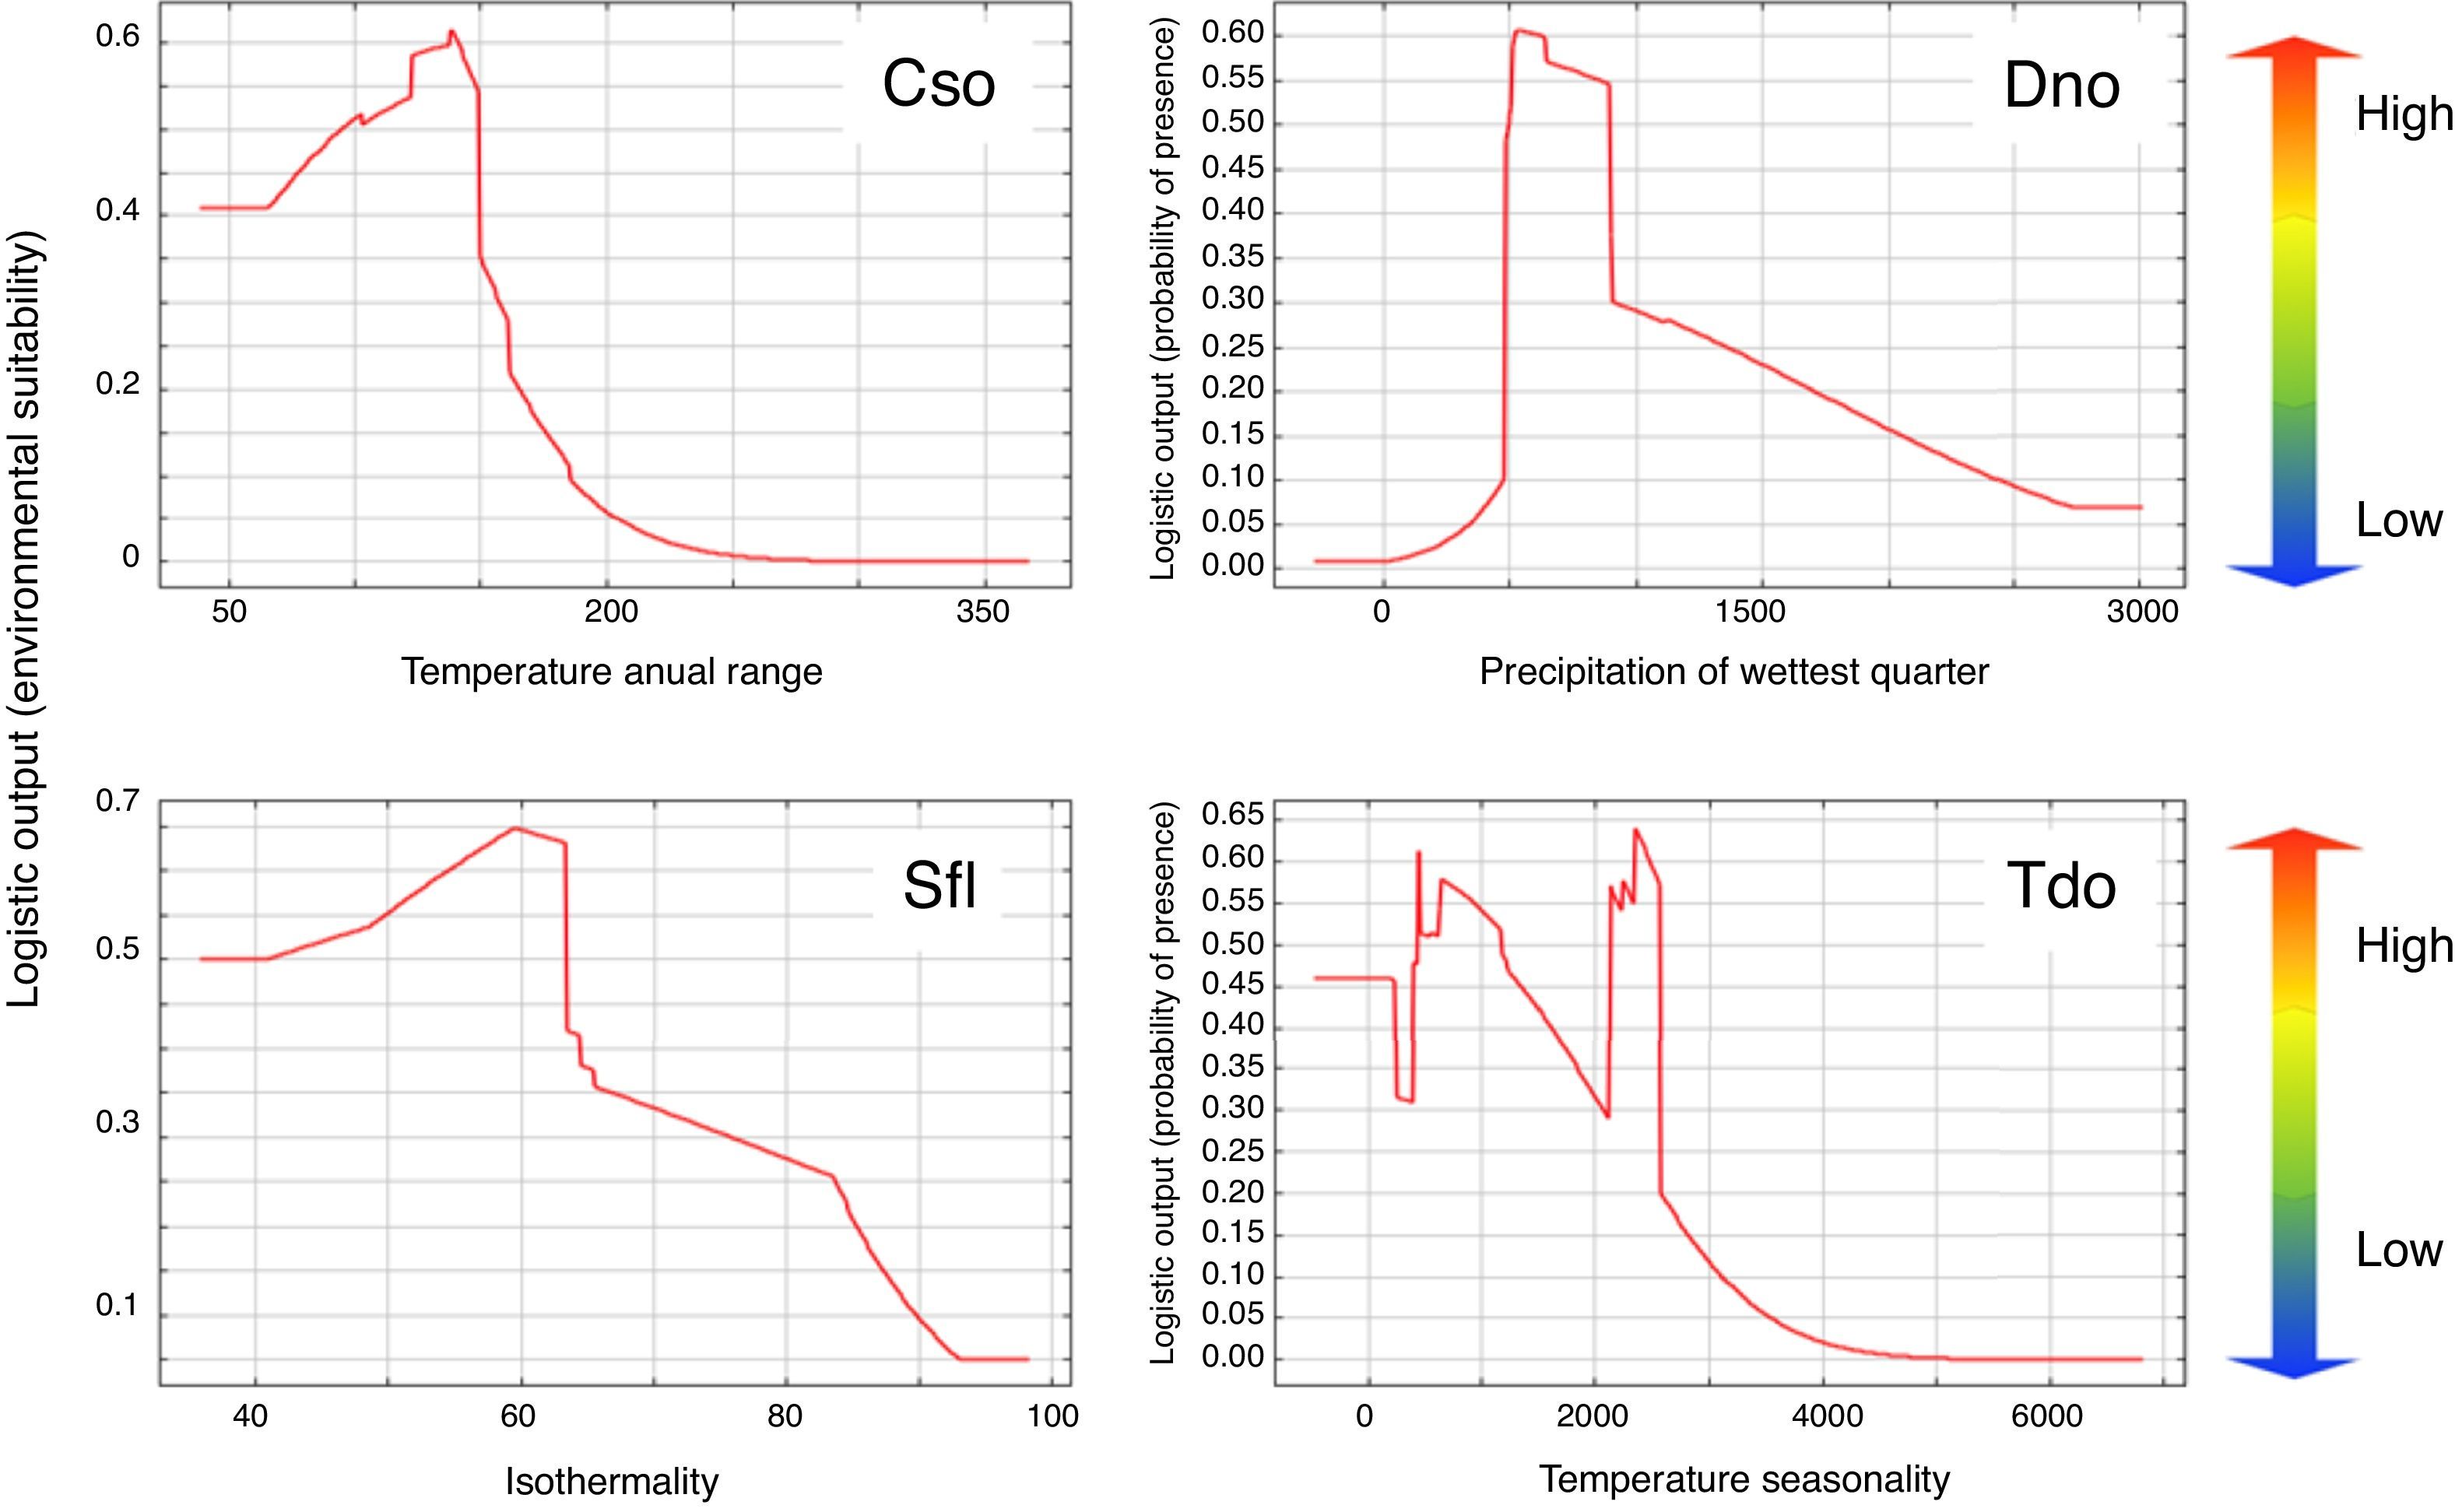
Habitat suitability of the target species in terms of environmental variables, showing: a fast drop in habitat suitability for temperature range higher than 150 in Crypturellus soui (upper left graph); the optimum values of the precipitation in the wettest quarter between 500 and 1000mm for Diopsittaca nobilis (upper right graph); a reduced suitability for values of isothermally higher than 60 for Sicalis flaveola; and reduced habitat suitability of values of temperature seasonality for Thamnophilus doliatus. Red region indicate the most suitable habitats while the blue region would refer to unsuitable areas, while green and yellow indicate intermediate habitat suitability.
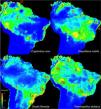
The maps in Fig. 3 show patches of high suitability (warm colors) separated by areas of low suitability (blue) for all of the target species. Based on these maps, we classified the potential distributions into five distinct areas for C. soui: Area 1 (extreme northern South America), Area 2 (northwestern South America), Area 3 (mid-western Brazil), Area 4 (the Brazilian coast), and Area 5 (Trinidad and Tobago) (Fig. 4, right); six suitable isolated patches were identified for D. nobilis: Area 1 (Venezuela), Area 2 (Roraima State, Guyana, and Suriname), Area 3 (Amazonas, Pará, and Amapá states), Area 4 (central Brazil), Area 5 (inland northeastern Brazil), and area 6 (coastal northeastern Brazil) (Fig. 4, left); five suitable isolated patches were identified for S. flaveola: Area 1a (southeastern Brazilian coast), Area 1b (central-eastern Brazilian coast), Area 1c (northeastern Brazilian coast), Area 2 (comprising Venezuela and Colombia), Area 3 (Bolivia); and eight suitable isolated patches were identified for T. doliatus: Area 1 (northern Colombia and Venezuela); Area 2 (northeastern Venezuela), Area 3a (southern Colombia and Equator), Area 3b (Bolivia and southern Peru), Area 3c (southeastern Brazil), Area 4 (northern Brazil and Guiana), Area 5 (central Brazil), Area 6 (northeastern Brazil).
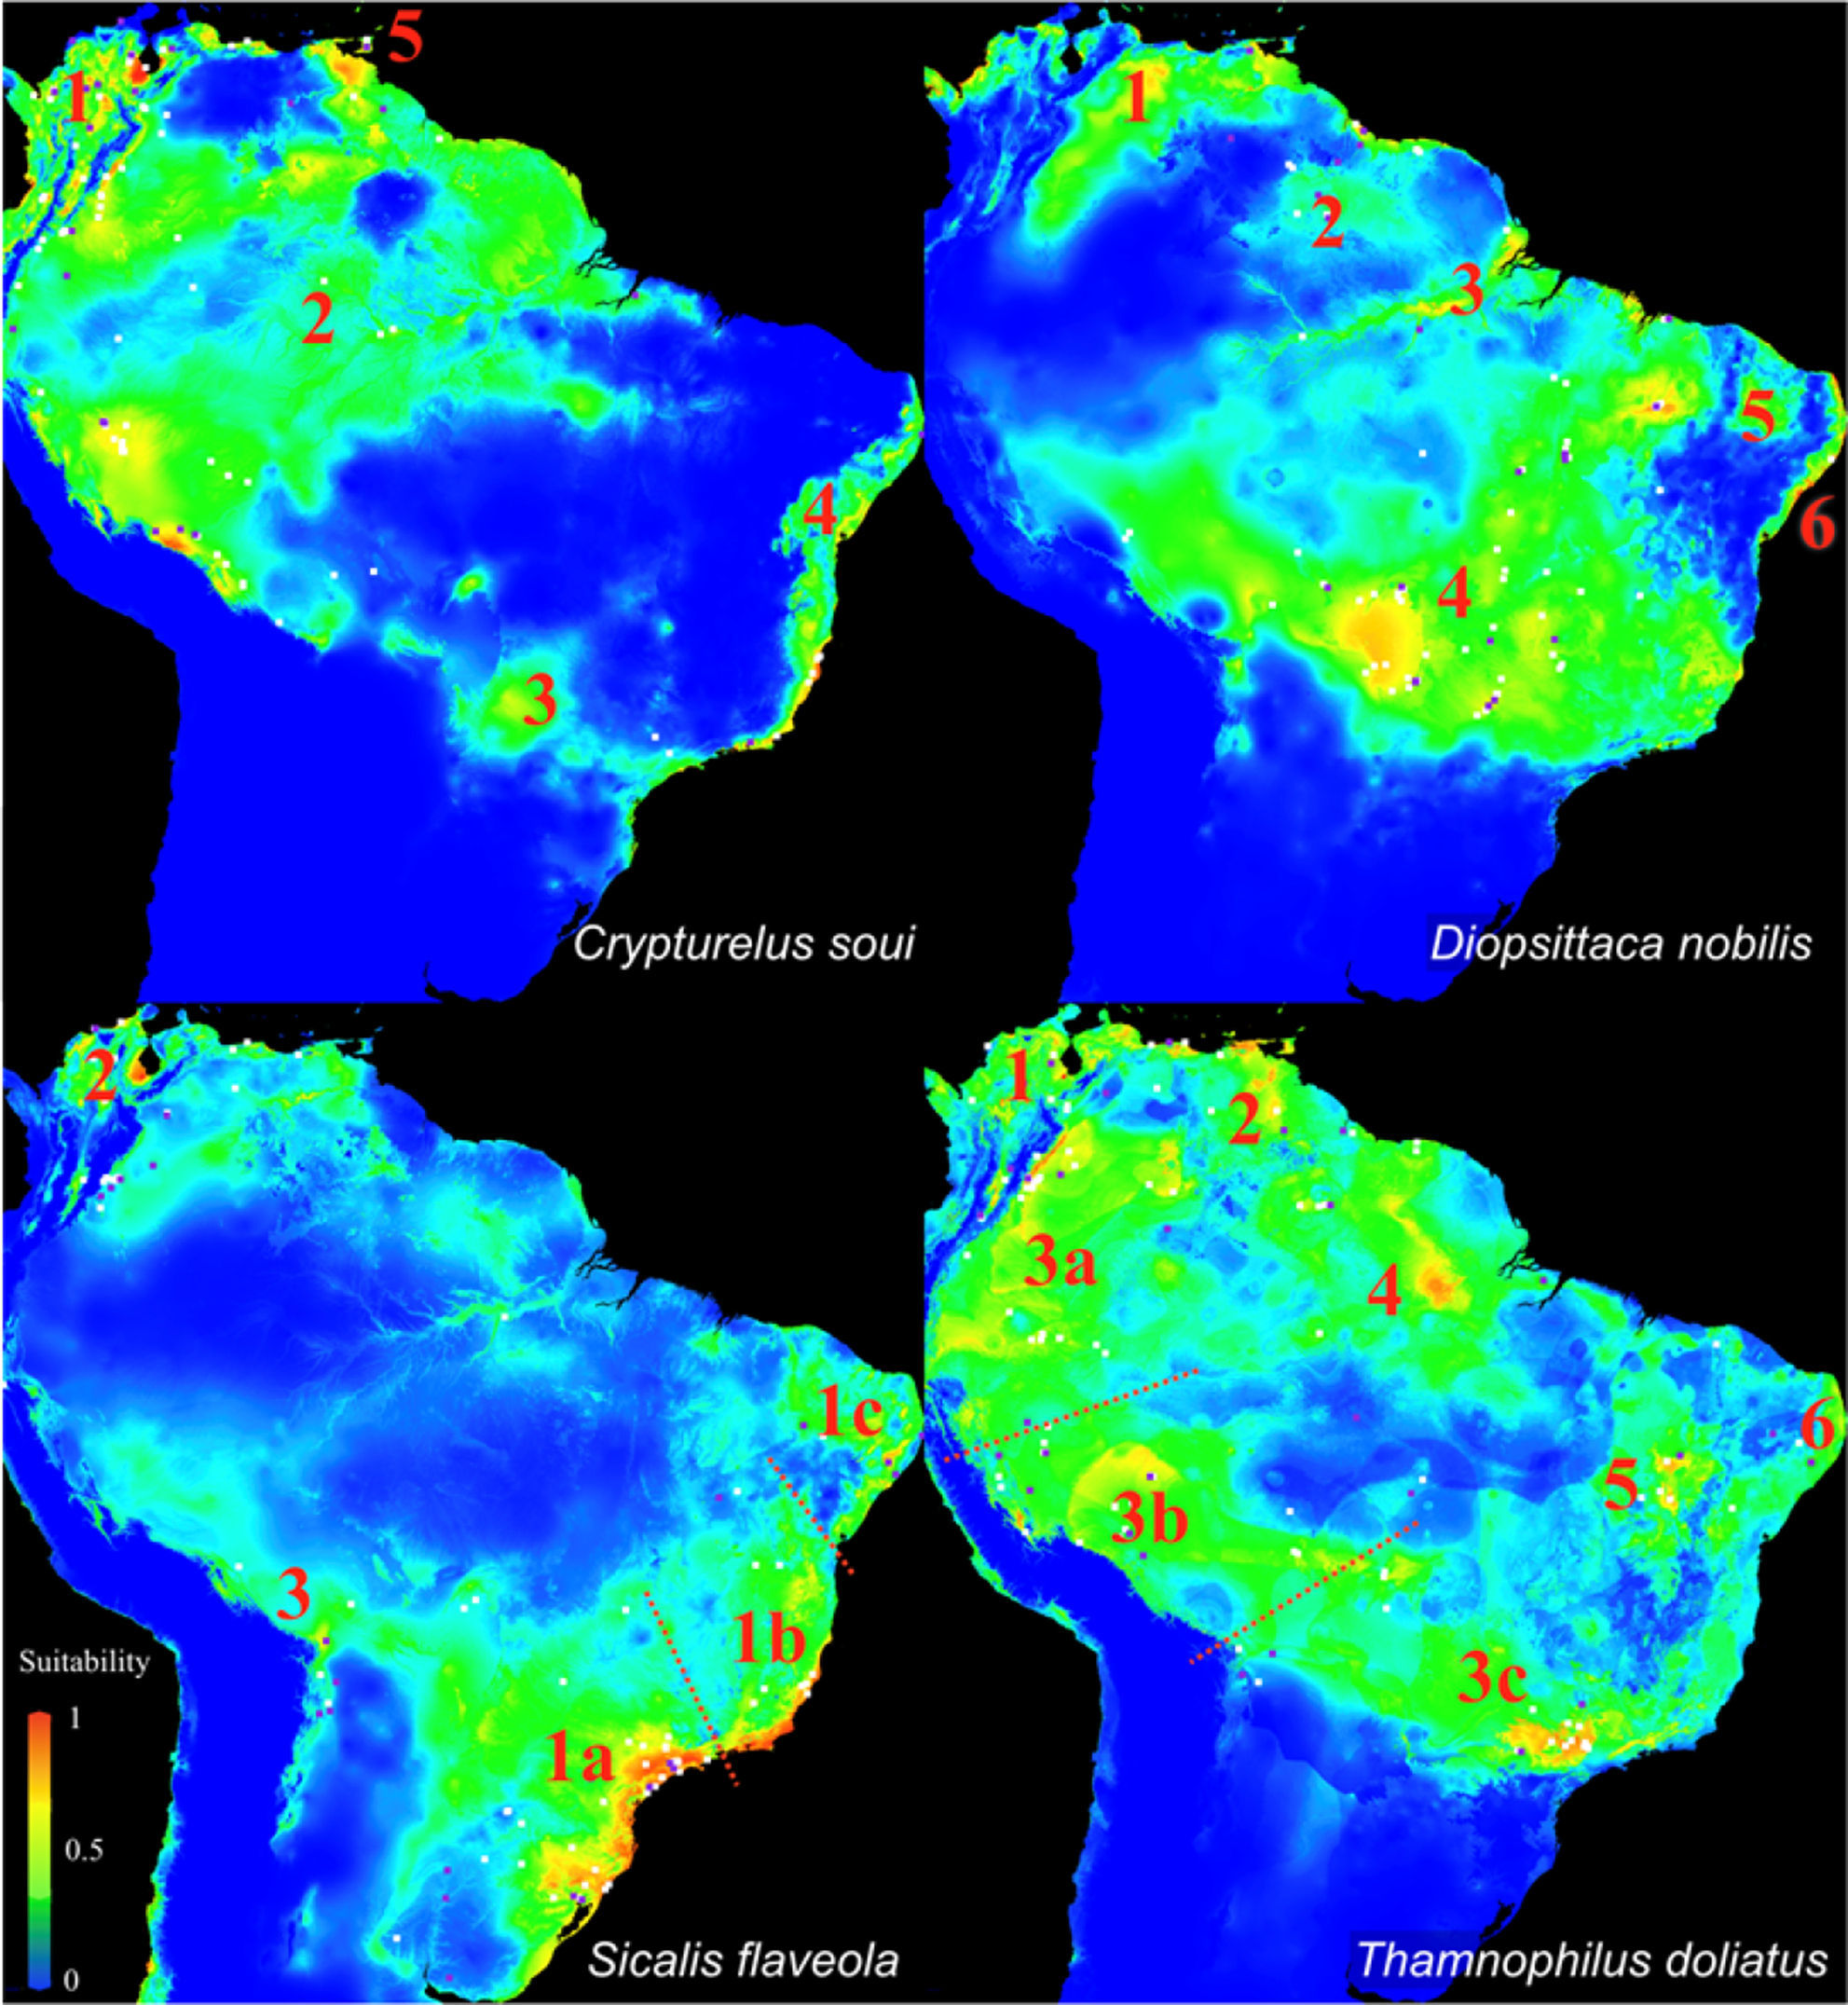
Ecological Niche Models of Crypturellus soui (upper left), Diopsittaca nobilis (upper right), Sicalis flaveola (Lower left and Thamnophilus doliatus (lower left). Warm colors indicate areas with higher habitat suitability and thus higher probabilities of species occurrence, whereas blue represents areas with low habitat suitability and thus low probability of species occurrence. The numbers indicate the selected isolated patches.
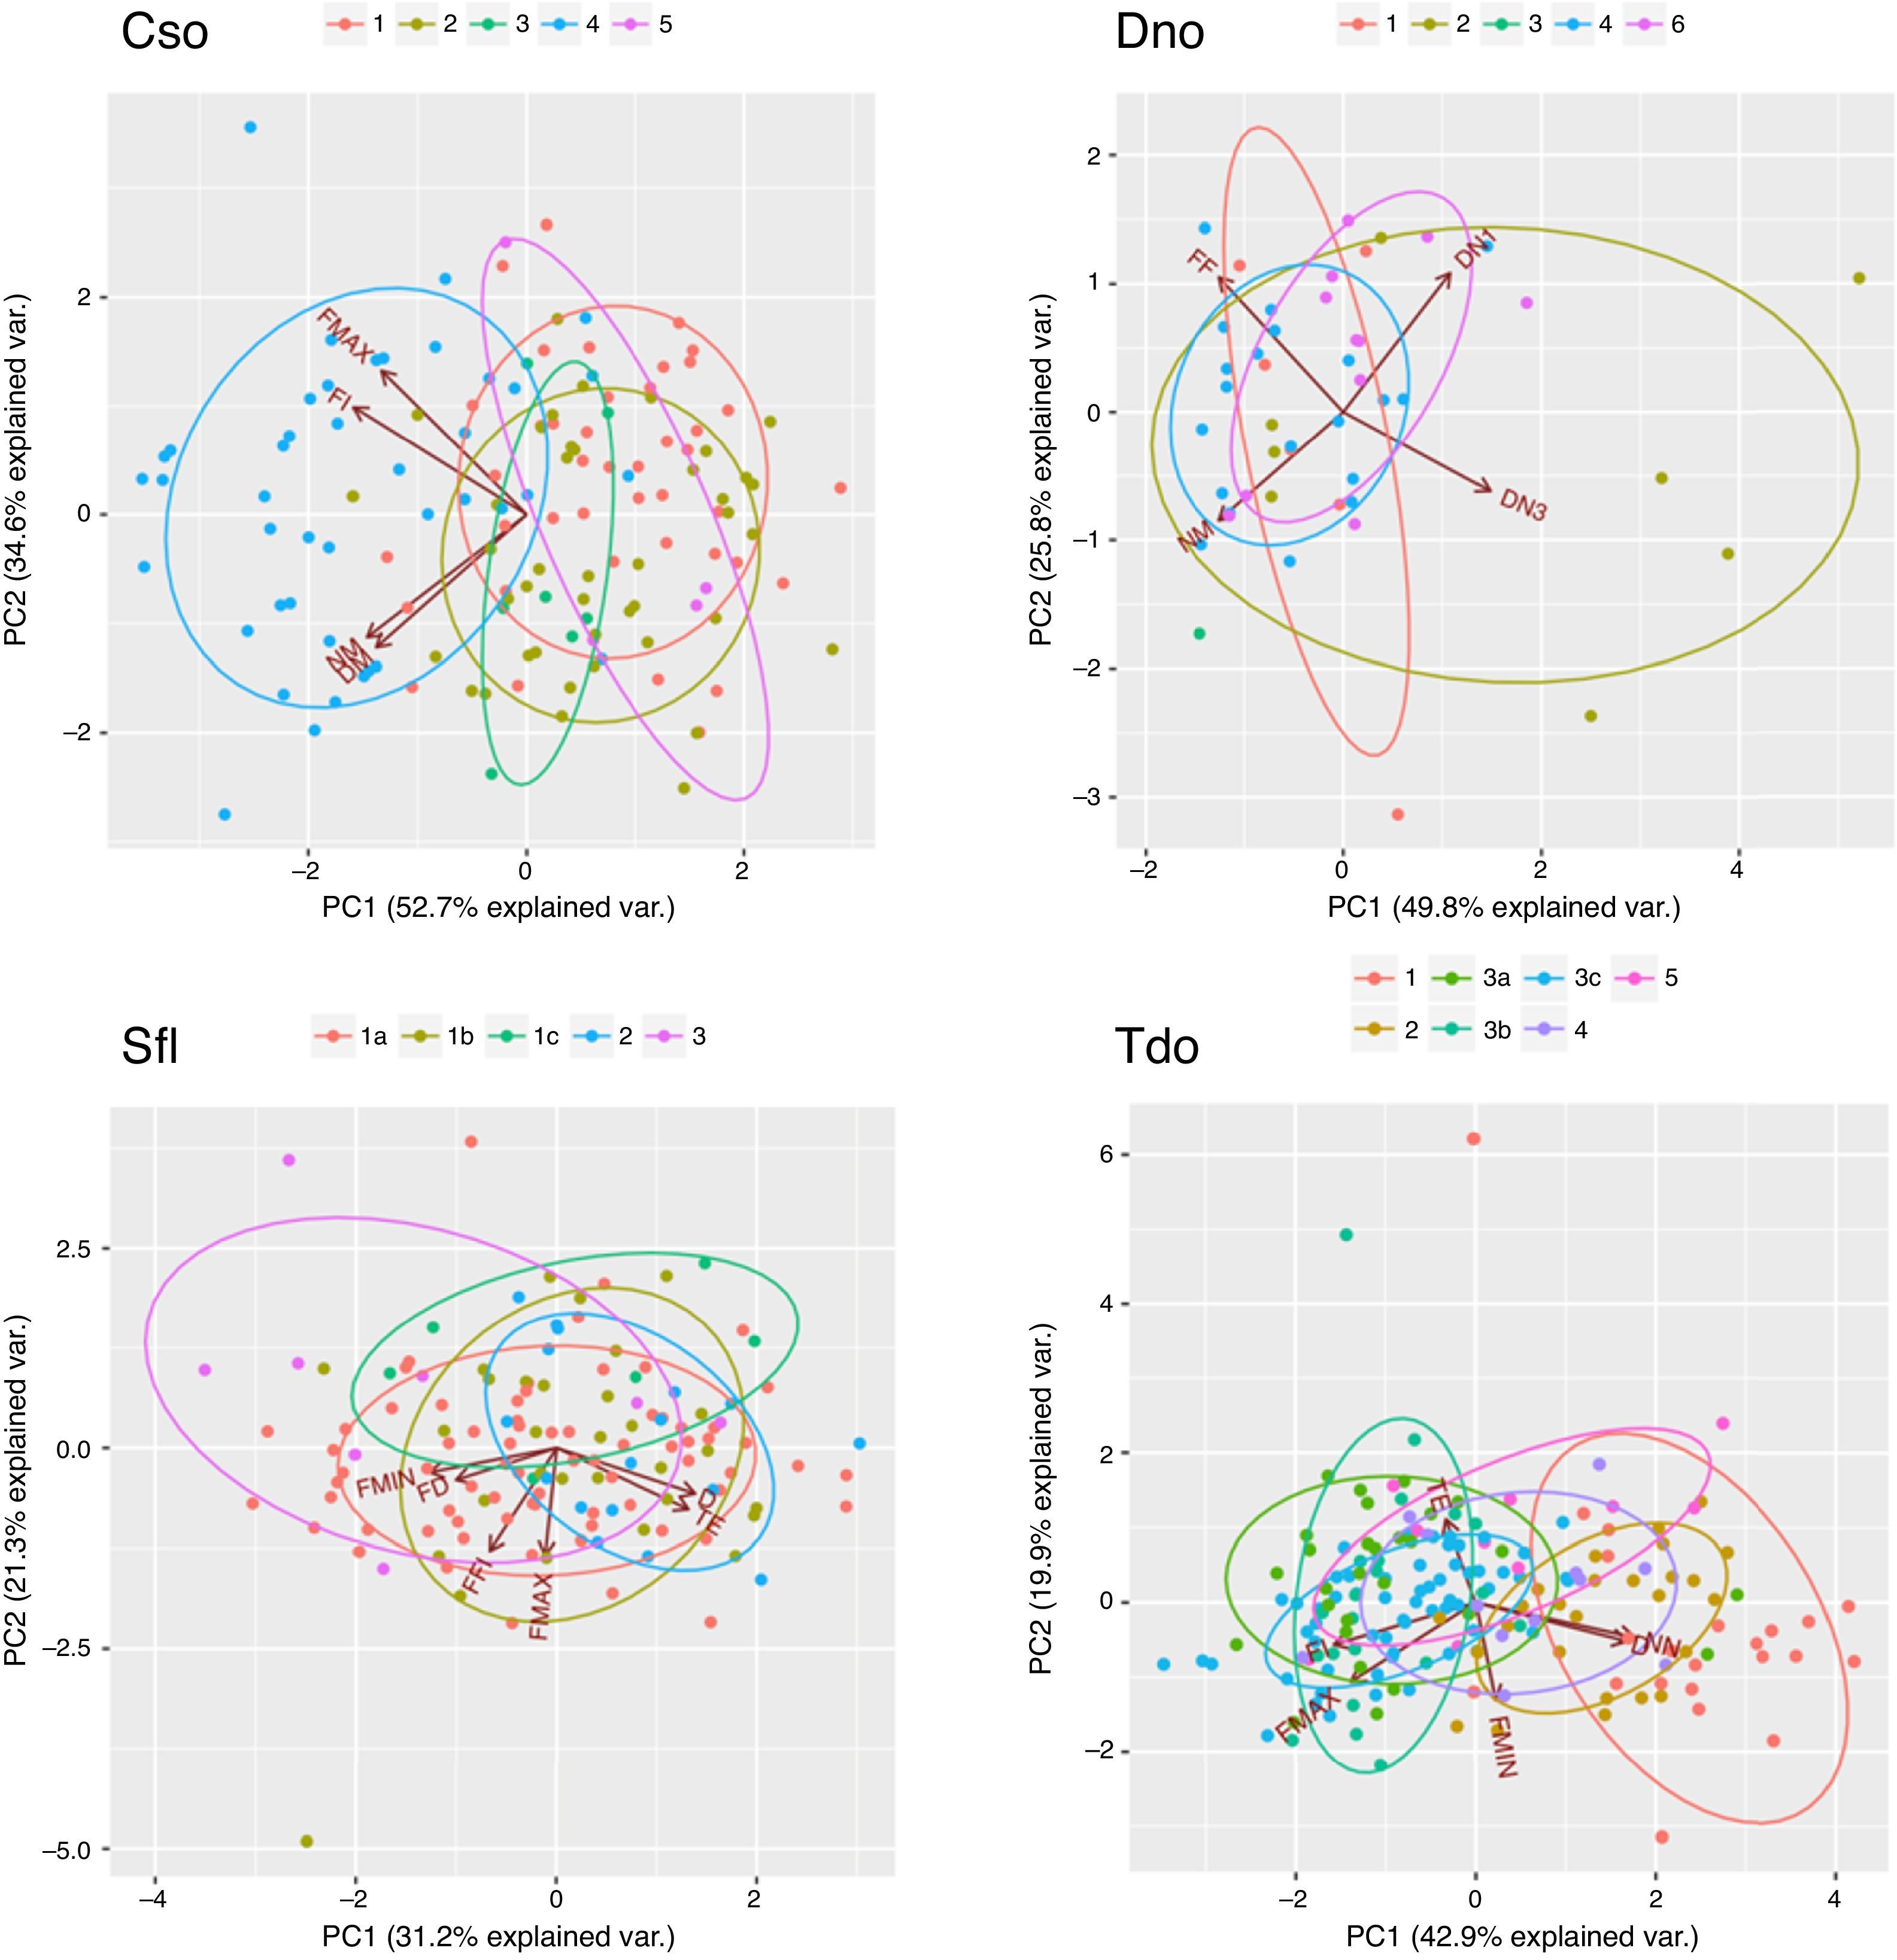
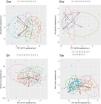
Biplot of the first two components of the Principal Component Analysis (PCA) made with the call parameters of Crypturellus soui (upper left), Diopsittaca nobilis (upper right), Sicalis flaveola (Lower left) and Thamnophilus doliatus (lower left). The colors represent the selected geographical patches.
We selected and analyzed a total of 540 sound files, including: 139 sound recordings of C. soui, representing all five areas on the map (Fig. 3); a total of 85 sound recordings of D. nobilis, from five of the six areas identified (Fig. 4; areas 1, 2, 3, 4 and 6); a total of 136 sound recordings of S. flaveola, representing all five areas on the map (Fig. 4); and 180 sound recordings of T. doliatus, representing five of the six areas on the map. As the recordings of D. nobilis were biased toward patch 4 (representing 70% of the recordings) we randomly selected 20 (from 59) calls from patch 4 to reduce differences in sampling effort, reducing the data from the original 85 calls to 46.
Geographical structures of the callsPrincipal Component Analysis showed identifiable groupings within C. soui, with vocalizations from the same area (especially from area 4) grouping together (Fig. 4, upper left). A similar pattern was found for T. doliatus, in which areas 1 and 2 seemed to present some overlap within the two first PCs, but were somewhat distinct from the remaining areas (Fig. 4, lower left). The results for D. nobilis and S. flaveola showed less distinctive patterns, with much overlap between the areas (Fig. 4 upper right and lower right, respectively).
A single model predicted areas with substantial empirical evidence (ΔAICc<4) for C. soui, while the second best model showed low probability (Wi of 0.01; Table 1), the evidence ratio (ER) was 148 times stronger for the best model relative to the second. For D. nobilis, S. flaveola, and T. doliatus, however, we found support for multiple models (ΔAICc<4). Although the Wi values for the best models reached 0.74, 0.53 and 0.73 respectively (Table 1), the evidence ratios found for the best models were 3–7 times stronger when compared to the second model. Even so, the inclusion of additional predictors into the best models did not substantially alter their classification matrices, so we used only the best models in our analysis.
The classification analyses showed differences in efficiency among the studied species. While call parameters allowed classifications that were better than expected by chance in T. doliatus for most of the areas, only a few patches had their calls classified as better than expected by chance for C. soui (patch 4), D. nobilis (patches 3 and 6), and S. flaveola (patch 1a), indicating that the calls from some patches are structurally singular when compared to the others (Table 2, Fig. 3). A closer look at the confusion table shows that C. soui calls from area 3 seem to be closer to those of area 2. This result can be observed in the PCA, but is also supported by the fact that the multinomial analysis classified all seven calls from area 3 as belonging to area 2. A similar pattern emerges from the calls of T. doliatus, in which 75% of the misclassified calls from patch 3b is classified by the model as being from patch 3c.
Confusion table showing multinomial regression analysis’ classification performance.
| Species | Area | n | Correct | % | Chi-p |
|---|---|---|---|---|---|
| Cso | 1 | 42 | 18 | 43% | 0.302 |
| 2 | 42 | 22 | 52% | 0.085 | |
| 3 | 7 | 0 | 0% | NA | |
| 4 | 43 | 37 | 86% | <0.001 | |
| 5 | 4 | 0 | 0% | NA | |
| Total | 138 | 77 | 56% | ||
| Dno | 1 | 6 | 1 | 17% | 0.833 |
| 2 | 8 | 4 | 50% | 0.133 | |
| 3 | 1 | 1 | 100% | <0.001 | |
| 4 | 20 | 15 | 75% | 0.207 | |
| 6 | 11 | 9 | 82% | 0.024 | |
| Total | 46 | 30 | 65% | ||
| Sfl | 1a | 73 | 68 | 93% | 0.016 |
| 1b | 30 | 2 | 7% | 0.092 | |
| 1c | 6 | 0 | 0% | NA | |
| 2 | 17 | 6 | 35% | 0.644 | |
| 3 | 8 | 2 | 25% | 0.077 | |
| Total | 134 | 78 | 58% | ||
| Tdo | 1 | 21 | 16 | 76% | <0.001 |
| 2 | 26 | 20 | 77% | <0.001 | |
| 3a | 28 | 19 | 68% | <0.001 | |
| 3b | 20 | 0 | 0% | NA | |
| 3c | 60 | 54 | 90% | <0.001 | |
| 4 | 12 | 7 | 58% | <0.001 | |
| 5 | 10 | 4 | 40% | 0.001 | |
| Total | 177 | 120 | 68% | ||
Species: Cso, Crypturellus soui; Dno, Diopsittaca nobilis; Sfl, Sicalis flaveola; Tdo, Thamnophilus doliatus; n, sample size; correct, the number of corrected classifications; %, the percentage of correct classifications; Chi-p, p value of a Chi-squared which determines if the classification efficiency is higher than expected by chance. Bold values represent significant differences.
The ecological niche modeling (ENM) predicted isolated populations that to some extent presented stereotyped calls. Our findings suggest that environmental variables influence the vocal structuring of populations, creating vocal signatures in places where key environmental parameters isolate populations. These patterns are observable and can potentially be used to identify the origins of a specimen. Problems arising from the enormous numbers of animals recovered from trafficking are overwhelming – including the cost of maintaining these animals indefinitely in captivity and the efforts needed to change the laws that control their reintroduction. Therefore, the presented methodology could help improve the present scenario by allowing for the identification of bird's origins prior to its release in the wild.
While the distributions of C. soui, S. flaveola, and T. doliatus seem to be greatly influenced by temperature, the distribution of D. nobilis appeared to better respond to precipitation. Discussions about which factors determine species distributions are quite old, and both climatic and biotic interactions appear to have important roles (Elton, 1927; Grinnell, 1917; Soberón and Nakamura, 2009). In spite of the importance of biological interactions (e.g., de Araújo et al., 2014), we have been able to show that climatic factors alone point to disjunct distributions of highly suitable habitat patches surrounded by unsuitable areas.
Sites outside the optimum ranges of key environmental variables appear to limit dispersal, engendering geographic structuring that is reflected in call parameters. While these results were especially clear for T. doliatus, they were limited for C. soui, D. nobilis, and S. flaveola, for which calls seem to be unique in specific portions of the species’ distributions. Although it is possible that the ENM model fails to represent the actual spatial distribution of a species, ENM models have been successfully used under a wide range of scenarios (Costa et al., 2008; Costa and Schlupp, 2010; Marini et al., 2010; Pearson and Dawson, 2003; Peterson, 2003, 2001; Peterson et al., 2007, 2002; Peterson and Kluza, 2005), and the AUC values of our models were relatively high.
Four alternative possibilities arise as explanations for the observed patterns: first, many species travel long distances in a single day between roosting and foraging sites. Some parrots, such as Lear's macaw (Anodorhynchus leari), have been observed traveling over distances of 24.86–169.45km, with the average daily distance traveled by this species being 80km (ICMBio, 2012). Assuming that some of the target species show high mobility, these birds probably cross otherwise unfavorable habitats that would otherwise act as geographical barriers, facilitating movement between different areas and favoring the homogenization of their calls.
Second, D. nobilis, as well as the genus Sicalis, show great capacities for vocal learning, and populations separated by just a few miles may show striking vocal differences (Areta et al., 2012; Salinas-Melgoza and Wright, 2012; Wright, 1996; Wright et al., 2005; Wright and Wilkinson, 2001). We can therefore imagine that each occupied area (covering thousands of square kilometers and therefore hundreds of distinct bird populations) comprises a large part (if not all) of the possible vocal variations – thus making distinctions between them based on vocal characteristics more difficult.
Third, the climatic barriers that now separate different populations may be quite recent, so that the vocal structures of their populations may not have had sufficient time to reflect their isolation (Isler et al., 2005, 1998).
Finally, the selection of what would be an isolated patch is not always straightforward, and some difficulties arise with intermediate probabilities of occurrence, where decisions are somewhat empirical. In such cases, it is possible that we have empirically selected patches that do not reflect the actual spatial distributions and dispersal barriers of the species – which would lead to low classification efficiency.
The results with T. doliatus support the idea that vocalizations follow the geographic distributions proposed by ENM, as vocal parameters consistently predicted their origins for most of the patches. Most of the calls from patch 3b where classified as being from 3c, indicating that there are no barriers between these patches. Our results suggest that most of the populations have been evolving separately – reinforcing the necessity of determining the origins of captured birds of that species before releasing them. Doing otherwise could endanger local populations by altering their delicate evolutionary balances, and (if the vocal differences are sufficiently large) reduce fitness by interfering with sexual selection (Bradbury and Vehrenkamp, 1998; Manica et al., 2014). Vocal differences such as those found within T. doliatus populations could presumably sexually handicap the released individuals, and alter the reproductive output of the affected population.
The results for C. soui, D. nobilis, and S. flaveola shows limited evidence of vocal structuring, as only the calls of a few areas were classified better than expected by chance. The principal component analysis indicated that the calls of C. soui from patch 4 were unique, which was supported by the multinomial classification. Despite the limited dispersal capacity of C. soui (Sick, 1997), it seems that its northern population (patches 1, 2, 5) is not structured, but distinct from the eastern Brazil population (patch 4). Additionally, the overlap found within the PCA indicated that the calls from patch 3 are closer to those from the northern population (patches 1, 2, 5), which was confirmed by the multinomial classification that classified all seven calls as belonging to patch 2.
The results for D. nobilis must be interpreted carefully, as our sample is heavily biased toward patch 4. Even though additional sampling would be welcome, our methodology showed only a limited capacity for determining the vocal structure of that species. The eastern population (patch 6) seems to be vocally distinct from the remaining populations, posing a potential threat to cross-released specimens. Although the single call of patch 3 was correctly classified, a single value might not be enough to train the model, so that the interpretation of this result is limited, as it could easily change as more samples are added to the analysis. Additionally, even though patch 4 had a correct classification of 75%, this value is not higher than expected by chance. Therefore, despite the fact that more sampling seems necessary, the vocal differences found for D. nobilis indicate that eastern individuals should not be released outside their original range.
Regarding S. flaveola, the isolation of patch 1a, as indicated by the multinomial classification, is consistent with the Paraíba do Sul Valley, found between the two largest mountain ranges in southeastern Brazil (the Serra da Mantiqueira and the Serra do Mar). The region has been identified as a partial barrier for the gene flow for Woodcreepers (Cabanne et al., 2007; Cardoso da Silva and Straube, 1996), and our data supports the idea of reduced migration over that valley. The calls south of the valley seem to have unique physical properties, making it important to avoid releasing individuals from patch 1a outside of their natural range.
Our results also indicate the existence of geographic structuring, meaning that we not only expect reduced gene flow between patches, but also some gene flow within patches. There do not seem to be any climatic barriers within the populations, so that we would expect each patch to form a population cluster with relatively similar genetic compositions that would be reflected in similar vocal parameters. As a consequence, in spite of the fact that the distribution patches indicated by our modeling are quite large, releasing a specimen within these patches should not severely alter the genetic composition within the patch, and we would not expect these releases to introduce alien genes into the populations identified by the model.
When compared to genetic assessments of the origin of a specimen, the methodology tested here represents a relatively rapid, inexpensive, and efficient alternative for determining the geographical origin of certain specimens – thus possibly representing a viable alternative for solving the problem of the reintroduction of birds recovered from trafficking. Our methodology could be limited, however, by strong learning components in vocalizations, or by species with wide dispersal abilities. Parrots, for example, are open-end learners, and are known to change the characteristics of their calls based on local calls (Wright et al., 2008). Although our data shows limited classification efficiency for those species, they have the ability to integrate socially by changing their vocal parameters and reducing vocal differences (Salinas-Melgoza and Wright, 2012; Wright et al., 2008). Additionally, genetic clustering may not be very tight in species with high dispersal abilities, so that in these species call variation comes coupled with genetic variation. In sum, the methodology described here will apply best when it matters the most, or when the costs of incorrectly placing individual birds would presumably be higher. We hope that the methodology described here may help solve one of the greatest bottlenecks in the implementation of wild animal trade prohibitions.
As the species examined here are somewhat extreme in terms of the natures of their vocal repertoires (with greater influence of innate genetic components on one hand, and greater influence of learning components on the other) (Marler, 2004), it will be necessary to increase the number of species studied – especially among birds whose vocal repertoires experience great influence from learning, such as oscines birds, hummingbirds, and parrots – to better understand the limits of the proposed methodology. Additionally, alternative bioacoustics methods could be used in the determination of the origins of a bird, which might include automated parameter acquisition and the use of comparative methods, such as cross-correlation analysis or dynamic time warping (Araya-Salas and Smith-Vidaurre, 2016).
We would like to thank the Fonoteca Neotropical Jacques Vielliard at Unicamp (Milena Corbo, Leandro Tacioli, and Felipe Toledo) and the Macaulay Library at Cornell University for providing the vocalization recordings used in this work. We would also like to thank Marcelo Pavlenco Rocha (SOS Fauna) for his question back in 2011 on how to determine bird specimen's origin from vocal characteristics ultimately lead to this paper. We are a step closer Marcelo. We would also like to thank two anonymous referees for the generous comments that helped improve this manuscript. A CAPES PNPD Post Doc Fellowship supported this project.