


The Tropical Montane Cloud Forests (TMCF) of South America are ecosystems facing rapid changes due to global warming. Herein, we used species climatic niche models to reconstruct the climatic boundaries of TMCF and to predict range shifts in climate change scenarios. Thirty-two species from three taxonomic groups (plants, birds, and amphibians) were modelled using community-level niche models under current and future climatic scenarios, as determined by two Global Climate Models (GCMs) for the year 2050. The community-level reconstructions were used to detect the overlap of TMCF with surrounding ecosystems and with current protected areas (PA). Approximate 42–54% area reduction and 207–429 m upward elevational shift was predicted under climate scenarios. Accordingly, severe environmental contractions (loss of suitability area) due to climate change were detected by our models. TMCF area within PA may increase 17–38% by 2050. We identified transition zones rather than clear limits of vegetational boundaries of TMCF with adjacent ecosystems, which suggested that both TMCF and transitional zones will be impacted, to what conservation strategies targeting TMCF and adjacent ecosystems should be prioritized.
Tropical montane cloud forests (TMCF) are a unique ecosystem with specialized species on cloud-related microclimates and on steep montane topography (Antonelli, 2015; Antonelli and Sanmartín, 2011; Bruijnzeel et al., 2011; Ponce-Reyes et al., 2012). In Ecuador, the high species diversity and endemism in TMCF are due to the adjacency with lowland Amazonia, differential orogenic levels, sharp altitudinal gradients and biogeographic barriers that limit species distribution (Antonelli et al., 2018; Borchsenius, 1997; Karger et al., 2021). TMCF species are vulnerable to changes in their environmental conditions because of their restricted climatic requirements and fragmented distribution (Cuesta et al., 2017; Helmer et al., 2019; Los et al., 2019; Ponce-Reyes et al., 2017). Because TMCF species distributions are expected to change with the increasing temperatures and precipitation fluctuations predicted by climate change scenarios (Beusekom et al., 2017; Bruijnzeel et al., 2011; Ponce-Reyes et al., 2012; Pounds et al., 1999), the mapping of the spatial distribution of TMCF area in the future is of paramount importance (Aragón and Lobo, 2012; Rojas-Soto et al., 2012). Thus, predictions of the future distribution of this entire ecosystem making use of information on the integrity of ecological processes could be an efficient alternative to tackle conservation efforts (Prieto-Torres and Rojas-Soto, 2016; Rojas-Soto et al., 2012).
Ecological niche modelling (ENM) has increasingly been used to predict species distributions. ENM uses species known occurrences to estimate species climatically suitable areas (Araújo and Luoto, 2007; Ortega-Andrade et al., 2015; Rojas-Soto et al., 2012), and to define core areas of species distribution depending on species responses to current and future climatic conditions (Peterson, 2011; Phillips et al., 2006). Niche theory based on BAM diagram (Soberón and Peterson, 2005) proposed three factors that defines the distribution area (Go) of species: Abiotic conditions that are favourable (A), biotic interactions (positive, negative, or both) between species (B), and the accessible area where the species maintain viable populations along time (M). Based on this statement, the usage of ENM at the species-level has been applied to predict the individual species’ distribution to an entire ecosystem (Prieto-Torres and Rojas-Soto, 2016; Werneck et al., 2012). However, when mapping individual, and not multiple species responses to environmental variables with ENM as single-ecosystem models, misleading results have been produced (Baselga and Araújo, 2009; Ferrier and Guisan, 2006; Prieto-Torres et al., 2016; Rojas-Soto et al., 2012). This is mainly due to the pre-established ecosystem boundaries and to the mismatch between the distribution of dominant species, that usually occur in multiple ecosystems (Prieto-Torres and Rojas-Soto, 2016; Prieto-Torres et al., 2016; Rojas-Soto et al., 2012). Alternatively, ENM based on community-level species distribution assumes co-occurrence patterns among species when predicting a single species’ distribution, taking species responses and interactions into account for modelling communities and ecosystem dynamics (Araújo and Luoto, 2007; Ferrier and Guisan, 2006; Guisan and Zimmermann, 2000; Prieto-Torres et al., 2016; Rojas-Soto et al., 2012). Moreover, community-level modelling uses, regardless of the number of records per species, of all available data across all species. At the same time, single-ecosystem models are not recommended to model species with few occurrences (Ferrier and Guisan, 2006).
The current Ecuador National Ecosystems (ENE) map (MAE, 2013) indicates that only 8% of TMCF are located within protection units of the Ecuadorian National System of Protected Areas (Brown and Kappelle, 2001). To effectively assess the conservation degree of TMCFs, the ecosystem boundaries and the overlapping area with adjacent ecosystems should be defined. The ENE defines the TMCF extension based on floristic inventories, without considering distributional overlap between species at different taxonomic levels and individual species responses to environmental variations. A re-evaluation of the existing map using community-level niche models could contribute to promoting conservation strategies towards the protection of TMCF, as this fragile and endangered ecosystem lack area assessments and knowledge on species co-occurrences and biogeographic distributions (Karger et al., 2021). Previous studies indicate that the modelling of co-distributed species could successfully reconstruct TMCF extension in Mexico (Rojas-Soto et al., 2012). Also, Prieto-Torres and Rojas-Soto (2016) contrasted a community-level niche model to a single-ecosystem model, showing that an improved reconstruction of TMCFs extension was made with community-level models. Although community-level ENMs have been produced for the Mexican TMCF, predictions on the loss or range shift in species assemblages for the Andean TMCF are still scarce.
Considering a community-modeling strategy based in ENM for multiple species and taxonomic groups, here we aim at (1) reconstructing the eastern Ecuadorian TMCF based on a community-level models; (2) analyzing the effects of climate change scenarios in detecting future TMCF distributional shifts; (3) assessing species’ transitional overlap in TMCF and adjacent ecosystems (4) comparing the current TMCF state of protection and in climate change scenarios (5) contrasting community-level models with the TMCF extension as defined by the single-ecosystem ENE. This information may be helpful to understand how the biogeographic distribution of TMCF will respond to climate change shortly and potentially revise and improve existing ecosystem maps, contributing towards TMCF conservation strategies.
Materials and methodsStudy area and species occurrence recordsTMCF are defined as areas covered by tropical evergreen forests, without dry seasons, with annual precipitation up to 10,000 mm. The elevational range of the TMCF varies from 800 to 3500 m.a.s.l. depending on its location along the Andean Mountain ridge in Ecuador (Bruijnzeel et al., 2011). Thirty-two species from three taxonomic groups – ten birds, five amphibians and seventeen vascular plants (Table 1) – ecologically associated and geographically related with the eastern TMCF side of the Ecuadorian Andes were selected to be included in the ENM. These taxa were chosen because: (1) birds are a well-known group that contains the largest numbers of occurrence points per species, therefore containing most biogeographical information; (2) amphibians are ecological indicators of the status of the ecosystem or environmental stress due to their sensitivity to environmental changes (Beebee and Griffiths, 2005; Blaustein et al., 1994); and (3) vascular plants are often used to define vegetation types of an ecosystem (Blank and Blaustein, 2012; Prieto-Torres and Rojas-Soto, 2016; Prieto-Torres et al., 2016). Moreover, the selected species span a variety of life forms, and trophic guilds, are phylogenetically unrelated, locally endemic to TMCFs and have dissimilar geographical distribution patterns throughout the Neotropics. Only TMCF specialists that had most occurrences within an altitudinal range between 1300 and 2900 m.a.s.l. were selected. The number of species was defined based on previous studies indicating that a minimum of 20 species (Rojas-Soto et al., 2012), with more than ten occurrence records each (Pearson et al., 2007), to be able to get adequate ecosystem reconstructions.
List of the modelled species used for the reconstruction of the Tropical Montane Cloud Forest in Ecuador. Additional species information was retrieved from the IUCN Red List (IUCN, 2021) and the Plant list (Alkin et al., 2013).
| Species | Family | Number of occurrence records | Habits/life form | Distribution | Status |
|---|---|---|---|---|---|
| Birds | |||||
| Chamaeza mollissima | Formicariidae | 278 | Insectivorous | BO, CO, EC, PE | Least concerned |
| Cinnycerthia olivascens | Troglodytidae | 831 | Insectivorous | CO, EC, PE | Least concerned |
| Conopophaga castaneiceps | Conopophagidae | 354 | Insectivorous | CO, EC, PE | Least concerned |
| Grallaria hypoleuca | Formicariidae | 400 | Insectivorous | CO, EC, PE | Least concerned |
| Grallaria ridgelyi | Formicariidae | 55 | Insectivorous | EC, PE | Endangered |
| Grallaricula peruviana | Formicariidae | 27 | Insectivorous- Frugivorous | EC, PE | Near threatened |
| Hemitriccus rufigularis | Tyrannidae | 166 | Insectivorous | BO, EC, PE | Near threatened |
| Mecocerculus minor | Tyrannidae | 295 | Insectivorous- Frugivorous | CO, EC, PE, VE | Least concerned |
| Pipreola lubomirskii | Cotingidae | 112 | Frugivorous | CO, EC, PE | Least concerned |
| Andigena nigrirostris | Ramphastidae | 1099 | Frugivorous-Granivorous | CO, EC, PE, VE | Least concerned |
| Amphibians | |||||
| Centrolene bacatum | Centrolenidae | 10 | Arboreal | CO, EC | Data deficient |
| Centrolene pipilatum | Centrolenidae | 12 | Arboreal | EC | Critically endangered |
| Hyalinobatrachium pellucidum | Centrolenidae | 34 | Arboreal | EC, PE | Near threatened |
| Osornophryne guacamayo | Bufonidae | 58 | Leaflitter | CO, EC | Endangered |
| Phyllomedusa ecuatoriana | Hylidae | 17 | Arboreal | EC | Vulnerable |
| Plants | |||||
| Bejaria zamorae | Ericaceae | 10 | Shrub | EC | Data deficient |
| Blakea spruceana | Melastomataceae | 57 | Tree | EC, PE | Least concerned |
| Cinchona parabolica | Rubiaceae | 62 | Tree | EC, PE | No data |
| Clethra pedicellaris | Clethraceae | 62 | Tree | EC, BO, CO, PE | No Data |
| Guzmania killipiana | Bromeliaceae | 26 | Shrub | EC, BO, PE | No Data |
| Hyospathe macrorhachis | Arecaceae | 15 | Shrub | EC | Near threatened |
| Ilex maasiana | Aquifoliaceae | 10 | Tree, shrub | EC, PE | Data deficient |
| Inga extra-nodis | Mimosaceae | 37 | Tree | EC | Vulnerable |
| Mandevilla congesta | Apocynaceae | 24 | Shrub | EC, CO, VE | No data |
| Miconia manicata | Melastomataceae | 14 | Shrub | EC, CO, VE | No data |
| Persea cuneata | Lauraceae | 115 | Tree | CO, CR, PA, VE, PE, EC, BO | Least concerned |
| Piper pubinervulum | Piperaceae | 19 | Shrub | PE, EC | No data |
| Thibaudia harlingii | Ericaceae | 27 | Shrub | EC | Data deficient |
| Vismia mandurr | Clusiaceae | 47 | Tree, shrub | CO, PE, EC | No data |
| Wettinia aequatorialis | Arecaceae | 26 | Tree | EC | Vulnerable |
| Ceradenia meridensis | Polypodiaceae | 53 | Shrub | VE, EC, CO, PA, PE, CR | No data |
| Cyathea peladensis | Cyatheaceae | 21 | Shrub | CO, EC, PE | No data |
Species occurrences records were gathered from the Ecuadorian National Program for Biodiversity Monitoring (SINMBIO) database, a consortium of various institutions and universities of Ecuador (https://bndb.sisbioecuador.bio/bndb/collections/index.php) and from the Global Biodiversity Information Facility database (GBIF; www.gbif.org). We retrieved GBIF specimen records for plants and amphibians, and specimen and observation records for birds; additional species information on the species status was retrieved from the IUCN Red List (IUCN, 2021) and the Plant list (Alkin et al., 2013). Each species occurrence record was georeferenced to correct for imprecise geographic coordinates using the MapLink tool (www.maplink.com). Coordinates that were duplicated, inconsistent or from doubtful localities were eliminated. A total of 4373 unique occurrence data points (available at https://github.com/gamamo/CloudForests) were used to perform ENM using MaxEnt (version 3.3.3k) entropy algorithm (Elith et al., 2006, 2011; Phillips et al., 2006).
Ecological niche modellingMaxEnt estimates the distribution probability by extracting a sample of background locations (i.e., climatic variables) that contrasts with the known species occurrences, performing iterations until a convergence limit is reached. This process results in a species suitability map ranging from 0 (unsuitable) to 1 (suitable) (Merow et al., 2013). Each species distribution was limited to its specific accessibility area. For each species, it was delimited by known historical and geographical barriers, as found in the literature and based on the locality of occurrence records (Barve et al., 2011; Peterson, 2011; Peterson and Soberón, 2012). The accessibility area boundaries were based on (1) the classification of terrestrial ecoregions (Olson et al., 2001); (2) the map of Biogeographical provinces of the Neotropics (Morrone, 2014) and (3) the altitudinal range limits, representing historical barriers to dispersal and tolerance limits (Barve et al., 2011; Soberón and Peterson, 2005). Nineteen climate layers from the CHELSA project (Karger et al., 2017) and the evapotranspiration layer from ESRI (Zomer et al., 2006) were used. These layers have a resolution of 30” (ca. 1 km2 at the Equator). Only low-correlated variables (−0.8 < r > 0.8) for each species’ model, according to the Jackknife test (all parameters at default) calculated by MaxEnt (Royle et al., 2012) were kept in the models to ensure reduction of over-fitting of the generated distribution models (Ortega-Andrade et al., 2015).
Species models were generated using a random sampling of 80% as training data and 20% as testing data. In addition, 10,000 iterations with no extrapolation to avoid false niche optima, with clamping (for the projection of future scenarios) were set. A total of five replicates per species were generated. A logistic response was chosen to get the values for habitat suitability (continuous probability from 0 to 1). The 10-percentile training presence threshold was chosen for the binary presence-absence maps. This threshold identifies suitable pixels that are predicted to have similar suitability as the pixels that contain the species occurrence record, as result of this rejecting 10% of the records to minimize over prediction caused by outliers (Jiménez-Valverde and Lobo, 2007; Prieto-Torres and Rojas-Soto, 2016); All other parameters were maintained at default settings. Model performance was evaluated by calculating commission and omission errors, the Area Under the Curve (AUC) of the Receiver Operating Characteristic (ROC) (Elith et al., 2011), as well by applying the partial ROC curves test. The later avoids an inappropriate weighing of the omission and commission components in the AUC analysis (Lobo et al., 2008; Peterson and Soberón, 2008). Partial AUCs were calculated using theNicheToolBox2 (http://shiny.conabio.gob.mx:3838/nichetoolb2/; Osorio-Olvera et al., 2020), with 50% of the unique occurrence testing data points, and represent the ratio of the AUC model to the null expectation (“AUC ratio”). We evaluated the statistical significance of AUCs compared with null expectations by bootstrap resampling 50% random points, replacing values 1000 times from the overall pool of data iterations. Significance (as compared with null expectation) was assessed by ranking the observed AUC ratio with the values from pseudo-replicates, following the proposal of Peterson et al. (2008).
Future Global Climate Models (GCMs) for the Ecuadorian TMCF were selected based on two Representative Concentration Pathway scenarios: RCP 4.5 is an optimistic response to stabilizing the anthropogenic components of radiative forcing; RCP 8.5 can be considered a pessimistic outcome with high levels of greenhouse gases (Thomson et al., 2011). Future scenarios were set to the year 2050 since TMCF faces conservation issues that threatens the persistence of the ecosystem in the short term. Two GCMs models were chosen: The ACCESS 1.0, developed by the Commonwealth Scientific and Industrial Research Organization and Bureau of Meteorology, and the HadGEM2-ES, developed by the Met Office Hadley Centre and Brazilian Institute for Space Research. The GCMs were downloaded from the CHELSA website (http://chelsa-climate.org/future/) as digital layers to be used in the ENM. The ACCESS 1.0 was chosen based on previous assessments of climate change on community-level species (Prieto-Torres et al., 2016), while the HadGEM2-ES was chosen as it provides better simulations of annual and seasonal precipitation in the Amazon compared to other GCMs (Sierra et al., 2015; Yin et al., 2013).
TMCF reconstructionThe reconstruction of the TMCF ecosystem was done by overlapping individual species predictive maps, which was subsequently constrained to the political limits of Ecuador. To analyze the geographical patterns of TMCF, the sum of species per 1 km pixels (from 1 to 32 species – independently of the species’ identity) were performed according to the methodology by Prieto-Torres and Rojas-Soto (2016). The numbers indicate the likelihood of TMCF to be present in this pixel. Higher number of species indicate a higher likelihood of being TMCF. Also, the mean range, elevation and standard deviation were calculated for each combination. This step was done independently for each of the five climatic models (from here on: Present, ACC45, ACC85, HGE45 and HGE85).
The current distribution of the TMCF in eastern Ecuador was evaluated by identifying areas that contain overlap of species distributions in the present model and thus higher certainty of TMCF presence. To assess the shifts of the TMCF area under each future climatic model, we calculated the proportional difference in the total number of pixels for each species combination between present and future models. The proportional decline of TMCF per species was calculated by dividing the TMCF area obtained from future models by the TMCF area obtained in the present model. The mean elevation and range were calculated from the total of each number of species present in the pixels (1–32). Elevation range differences (future models elevation range minus present model elevation range) and proportional elevation change (future models elevation range/present model elevation range) were also calculated. An ANOVA followed by a post-hoc Tukey test was used to detect significant differences between TMCF area and elevation between the future models.
We compared the overlapping differences between the predicted TMCF area and the distribution limits of the adjacent ecosystems, as defined by the Natural Regions of Ecuador map (Ron, 2020), per sum of species, to identify transitional areas. Furthermore, the proportion of predicted area that coincides with each ecosystem and the contribution of the overlap area to the total ecosystem size was calculated. To analyze the correlation of the modelled TMCF with the single-ecosystem TMCF map (ENE) defined by the Ministry of Environment of Ecuador (MAE, 2013), we calculated the overlap of pixels for each combination of species with the single-ecosystem map. The overlap of the TMCF distribution with the Ecuadorian protected areas (PA) was evaluated using the layer of protected areas downloaded from ProtectedPlanet.net (IUCN, 2012). We calculated the pixel overlap per sum of species and the proportion of pixels within the PAs. All analyses were performed using ArcMap 10.5 and RStudio (https://www.rstudio.com/).
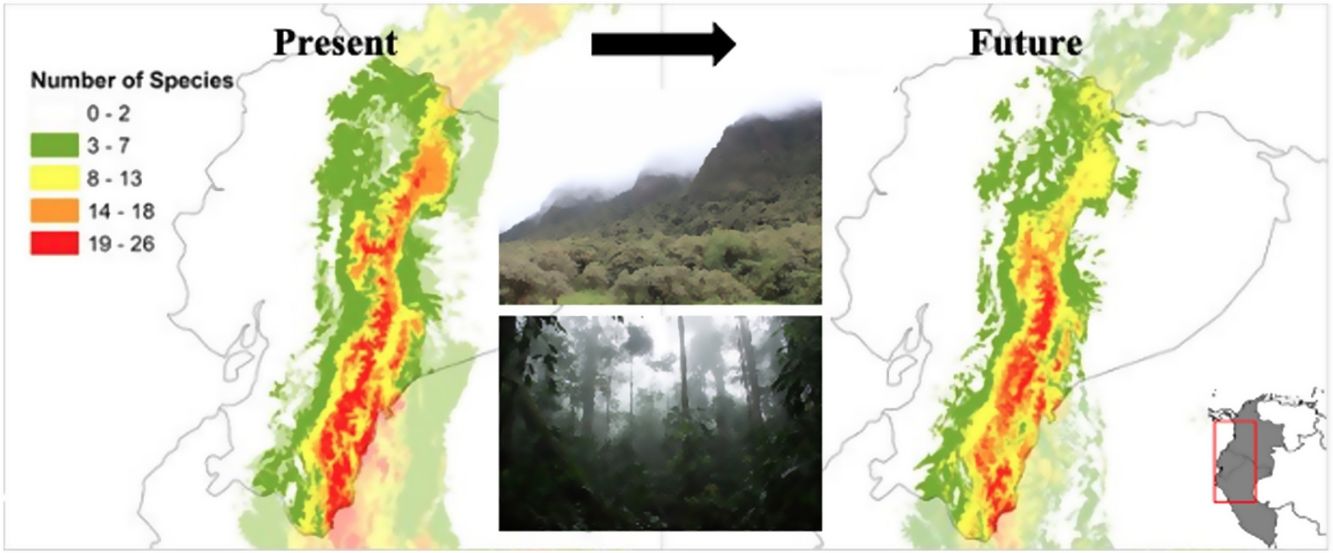
ResultsAUC values for all 32 models ranged from 0.9079 to 0.9903, with a mean test omission rate of 5.6% (Table S1). Partial ROC was significant for all species models (Table S1). A maximum of 26 out of 32 species could be found within the single pixel (Fig. 1A). The modelled TMCF distribution had a mean elevation of 2078 m.a.s.l. and a mean standard deviation of 766 m (Table 2). TMCF modelled area extended to the provinces of Napo, Morona Santiago and Zamora Chinchipe, with a low number of species per pixel in the provinces of Pichincha, Imbabura and Carchi. The number of species occurrences within a single pixel declined towards Amazonia and Western Ecuador, with minimal presence around the mountain peaks.
 using community-level niche models per sum of species under (A) current climatic conditions; (B) under the optimistic ACCESS 1.0/ RCP4.5 model for the year 2050; (C) Overlap of the reconstructed TMCF boundaries with TMCF as defined by Ecuador National Ecosystems (in blue); and (D) the overlap of TMCF reconstruction according to the optimistic ACCESS 1.0/ RCP4.5 model and the protected areas (in blue) of Ecuador.")
Reconstruction of Tropical Montane Cloud Forest in Ecuador (TMCF) using community-level niche models per sum of species under (A) current climatic conditions; (B) under the optimistic ACCESS 1.0/ RCP4.5 model for the year 2050; (C) Overlap of the reconstructed TMCF boundaries with TMCF as defined by Ecuador National Ecosystems (in blue); and (D) the overlap of TMCF reconstruction according to the optimistic ACCESS 1.0/ RCP4.5 model and the protected areas (in blue) of Ecuador.
The distribution of the tropical montane cloud forest in Ecuador for present and future projections. The results are based on two global climate change scenarios (RCP 4.5 and RCP 8.5) and two climate projections (ACCESS 1.0 and HadGEM2-ES). The data shows per set of species number for the TMCF extent; proportion of vanishing TMCF; Correspondence to, and proportion of species within the Ecuador National Ecosystems (ENE) map (MAE, 2013); Proportion of species falling within the current national protective areas (PA); Mean elevation (in m above sea level) and the projected proportional elevation difference in future scenarios.
| Approach | Climate change scenario | Set of species | TMCF extent in pixels | Prop. vanishing TMCF | % Predicted ENE TMCF | Prop. of species in ENE map | Prop. within PA | Mean elevation (STD) | Elevation difference (Prop) |
|---|---|---|---|---|---|---|---|---|---|
| Present | >=3 | 94,309 | – | 90.00 | 0.41 | 0.26 | 2234 (1165) | – | |
| >=6 | 59,387 | – | 79.28 | 0.57 | 0.30 | 2481 (983) | – | ||
| >=9 | 44,514 | – | 70.74 | 0.68 | 0.32 | 2362 (1084) | – | ||
| >=12 | 33,982 | – | 58.74 | 0.73 | 0.33 | 2049 (967) | – | ||
| >=15 | 23,085 | – | 42.33 | 0.78 | 0.34 | 1914 (699) | – | ||
| >=18 | 13,164 | – | 24.64 | 0.80 | 0.29 | 2006 (519) | – | ||
| >=21 | 4954 | – | 9.75 | 0.84 | 0.24 | 2001 (411) | – | ||
| >=24 | 869 | – | 1.70 | 0.83 | 0.23 | 2162 (297) | – | ||
| >=26 | 30 | – | 0.05 | 0.73 | 0.37 | 2269 (237) | – | ||
| Average | 51.27 | 0.68 | 0.29 | 2078 (766) | |||||
| Future scenarios to 2050 | |||||||||
| ACCESS 1.0 | RCP 4.5 | >=3 | 72,928 | 0.23 | 80.37 | 0.47 | 0.27 | 2397 (1074) | +163 (1.07) |
| >=6 | 40,319 | 0,32 | 59.62 | 0.63 | 0.33 | 2205 (951) | −276 (0.89) | ||
| >=9 | 20,311 | 0.54 | 33.76 | 0.71 | 0.33 | 2202 (773) | −160 (0.93) | ||
| >=12 | 6372 | 0.81 | 12.08 | 0.81 | 0.43 | 2355 (511) | +306 (1.15) | ||
| >=15 | 269 | 0.99 | 0.47 | 0.74 | 0.58 | 2560 (332) | +646 (1.30) | ||
| >=17 | 21 | 1.00 | 0.05 | 1.00 | 0.81 | 2844 (159) | +857 (1.43) | ||
| Average | 0.42 | 38.72 | 0.68 | 0.40 | 2315(738) | +232 (1.15) | |||
| RCP 8.5 | >=3 | 73,269 | 0.22 | 79.51 | 0.46 | 0.31 | 2404 (1062) | +169 (1.08) | |
| >=6 | 44,127 | 0.26 | 60.64 | 0.58 | 0.31 | 2118 (917) | −363 (0.85) | ||
| >=9 | 26,384 | 0.41 | 39.31 | 0.63 | 0.31 | 2289 (895) | −72 (0.97) | ||
| >=12 | 10,618 | 0.69 | 17.71 | 0.71 | 0.36 | 2393 (633) | +344 (1.17) | ||
| >=15 | 1458 | 0.94 | 2.90 | 0.84 | 0.50 | 2562 (333) | +648 (1.34) | ||
| >=17 | 114 | 0.99 | 0.24 | 0.90 | 0.44 | 2776 (260) | +788 (1.40) | ||
| Average | 0.51 | 41.47 | 0.64 | 0.34 | 2289(792) | +207 (1.13) | |||
| HadGEM2-ES | RCP 4.5 | >=3 | 133,696 | −0.42 | 92.03 | 0.29 | 0.23 | 880 (1042) | −1355 (0.39) |
| >=6 | 42,643 | 0.28 | 45.96 | 0.46 | 0.37 | 2335 (855) | −146 (0.94) | ||
| >=9 | 21,205 | 0.52 | 25.97 | 0.52 | 0.40 | 3042 (754) | + 681 (1.29) | ||
| >=12 | 7634 | 0,78 | 10.83 | 0.60 | 0.37 | 2881 (578) | + 832 (1.41) | ||
| >=15 | 1733 | 0.92 | 2.71 | 0.67 | 0.33 | 2870 (188) | + 956 (1.50) | ||
| >=18 | 150 | 0.99 | 0.20 | 0.57 | 0.15 | 2918 (106) | + 912 (1.45) | ||
| Average | 0.54 | 35.58 | 0.52 | 0.33 | 2408 (659) | + 330 (1.16) | |||
| RCP 8.5 | >=3 | 106,332 | −0.13 | 87.33 | 0.35 | 0.24 | 1274 (1169) | −961 (0.57) | |
| >=6 | 37,929 | 0.36 | 38.10 | 0.43 | 0.38 | 2436 (845) | − 44 (0.98) | ||
| >=9 | 21,183 | 0.52 | 23.46 | 0.47 | 0.43 | 3150 (748) | +789 (1.33) | ||
| >=12 | 7769 | 0.77 | 10.57 | 0.58 | 0.41 | 2976 (569) | +927 (1.45) | ||
| >=15 | 1985 | 0.91 | 3.02 | 0.65 | 0.34 | 2916 (215) | +1001 (1.52) | ||
| >=18 | 118 | 0.99 | 0.14 | 0.50 | 0.14 | 2980 (99) | +975 (1.49) | ||
| Average | 0.50 | 32.86 | 0.49 | 0.34 | 2508 (634) | +429 (1.20) | |||
Values indicated in bold are the average predictions.
Models ACC and HGE showed a reduction of 31% and 34% of the number of species that had environmental suitability areas within the TCMF (Table S2). The species A. nigrirostris only occurred in the HGE model and were not predicted in the ACC models; the species H. rufigularis and I. extra-nodis only occurred in the ACC models and were not predicted in the HGE models. The species C. olivascens, G. ridgelyi, M. minor, P. cuneata, P. lubomirskii, V. mandurr, C. pipilatum, C. meridensis and C. mollissima did not have environmental suitability in any of the two GCMs and thus were not present in either of the future models. The maximum number of species co-occurring into the same pixel in the future scenario’s models showed a decline of 65% (ACC) and 69% (HGE concerning to the 26 species detected within a single pixel in the Present model (Fig. 1B).
In all future climate change scenarios, a strong reduction of TMCF environmental suitability area was detected per sum of species compared to the present model (Table 2 and Fig. 2A). The average TMCF area, as calculated by the sum of all species combination, shrank 42% in the ACC45; 51% in the ACC85; 54% in the HGE45 and 50% in the HGE85. When compared to the present model, TMCF moved 207–429 m towards higher elevations of the Andes in the future scenarios (Fig. 2A and Table 2) and towards South (ACC models) and the North and Southeastern of Ecuador (HGE models). There are no significant differences between the two climate models (ACC45 and ACC85; HGE45 and HGE85), nor among the more moderate (ACC45 and HGE45) or more drastic (ACC85 and HGE85) scenarios for the TMCF extent per species (F = 0.74; p = 0.57) and the elevations (F = 2.02; p = 0.01).
 by area and proportional ecosystem overlap per sum of species. (A) Average cloud forest area size and elevation shift under future climate change scenarios for ACCESS 1.0 and HadGEM2-ES; (B) The proportional overlap area of the TMCF with adjacent ecosystems (Ron, 2020) in current and future scenarios (only Access 1.0/ RCP4.5 is shown), per sum of species.")
Models of the Tropical Montane Cloud Forest (TMCF) by area and proportional ecosystem overlap per sum of species. (A) Average cloud forest area size and elevation shift under future climate change scenarios for ACCESS 1.0 and HadGEM2-ES; (B) The proportional overlap area of the TMCF with adjacent ecosystems (Ron, 2020) in current and future scenarios (only Access 1.0/ RCP4.5 is shown), per sum of species.
The proportion of modelled areas corresponding to the eastern TMCF showed significant changes in future scenarios (Fig. 2B and Table S2). The correlation between the TMCF model and ENE map decreased with the increasing addition of modelled species (Table 2, Fig. 1C). In all future scenarios, TMCF extended towards southern Ecuador, where little to no protected areas currently exist (Fig. 1D). There was an overlap of ca. 80% between both maps when six modeled species are considered and less than 10% for 21 modelled species or more with an average TMCF overlap of 51% for all species. The future scenarios showed an average TMCF overlap that is significantly less (ACC45 = 38%; ACC85 = 41% and HGE45 = 35%; HGE85 = 33%) compared to the overlap with the present model.
The ecosystems that have the largest proportion of overlap with the TMCF area as defined in the present model were: Eastern montane (0.55), Eastern foothill (0.26), Andean shrub (0.26), Paramo (0.16) and Western Montane (0.13) (Table S2). The Eastern montane ecosystem had the largest percentage of TMCF modelled area for all scenarios (Present = 74.2%; ACC45 = 73.9%; ACC85 = 69.6%; HGE45 = 61.3%; HGE85 = 59.8%). The overlap of the TMCF with the Paramo ecosystem showed a strong gain in numbers of area compared to the Present model (ACC45 = 22%; ACC85 = 37%; HGE45 = 99% and HGE85 = 105%).
An average proportion of 0.29 pixels of TMCF (present model) falls within PAs (Table 2). The suitable areas found within PAs showed an overall increment in the future scenarios (ACC45 = 37.9%, ACC85 = 17.2%, HGE45 = 13.8%, HGE85 = 17.2%).
DiscussionAlthough the actual number of TMCF species encompasses approximately 16% of the world’s plant species and 15% of the avian diversity (Bravo Velásquez, 2014) This study reinforces that the analysis of a reduced set of species distributions can be effectively used to reconstruct TMCF extension and its environmental suitability, as has been suggested in other studies (Rojas-Soto et al., 2012; Prieto-Torres and Rojas-Soto, 2016). Our results showed similar spatial distribution of TMCF compared to the predicted TMCF Neotropical distribution made solely with climatic parameters (Bruijnzeel et al., 2011; Helmer et al., 2019). A reconstruction from a limited number of co-occurring species of unrelated taxa from the same ecosystem is possible because ecosystem boundaries are generally related to individual species’ ecological responses (Mayer and Rietkerk, 2004), and because species share similar ecological requirements across transitional ecosystems (Araújo and Luoto, 2007; Prieto-Torres and Rojas-Soto, 2016; Rojas-Soto et al., 2012).
Climate change impactsOur future climate models showed that the current TMCF area would be pressured upon to higher elevations and that suitable areas for the individual species may largely decline. A possible reduction of 42–54% in TMCF area and an elevational shift ranging between 207 m and 429 m by 2050 were predicted. Our results suggest that mountain species will undergo drastic distributional changes, being pushed upwards to track their climatic niches as temperatures increase (Forero-Medina et al., 2011; Nogués-Bravo et al., 2007; Ortega-Andrade et al., 2015). Some species, however, may disappear due to the lack of favorable environmental conditions (Nogués-Bravo et al., 2007; Ortega-Andrade et al., 2015). Our predictions are consistent with the directional shift of TMCF species in Mexico (Peterson et al., 2002; Rojas-Soto et al., 2012), confirming the altitudinal movement of the ecological niches due to climate change impacts (Guevara, 2020; Forero-Medina et al., 2011; Nogués-Bravo et al., 2007) and that lowlands species may slowly become more frequent in higher elevations, while the environmental suitability areas of mountain species may decline or disappear (Bubb et al., 2004; Feeley et al., 2011; Forero-Medina et al., 2011; Nogués-Bravo et al., 2007).
Ecological patternsThe predicted movement of species towards higher elevations may lead to a redefinition of the spatial location of transition zones between montane ecosystems. If ecosystem boundaries can be defined based on species distributions, it is expected that these boundaries may shift over time and will need to be redefined whenever species distributions shift to track climate change (Guevara, 2020). For instance, in our future climate models, the TMCF that overlap with the paramos nearly doubled, while the lower limits showed a reduction of nearly almost half of its current area, which might indicate the increase of the TMCF in higher montane areas. This result coincide with the predictions of Helmer et al. (2019), that 70%–86% of the paramo in the Neotropics will be likely subjected to tree invasion from the adjacent ecosystems under climate change scenario. Lower parts of the TMCF area in turn, are predicted to be replaced by lower altitude ecosystems (Bubb et al., 2004).
TMCF in protected areasThe current PA areas may preserve roughly 33%–40% of the TMCF extent under future climatic scenarios, in contrast to the 8% that is currently under protection. The increase of TMCF in PA can be explained by the fact that several PA were created to protect the higher elevation ecosystems, such as the paramos. As the TMCF boundaries move towards higher elevations due to the altitudinal movement of suitability areas to species, the relative TMCF area can potentially replace current protected paramo areas. Thus, a corridor of PA along elevational gradients in montane areas could effectively minimize the negative effects of short-term climate change for montane ecosystems and transitional zones. Almost all the natural forests of the central Andean valley have been removed and only 4% remain intact on the west Andean slope (Aldrich et al., 1997). The synergistic effect of deforestation and agricultural expansion with climate change may result in short-term negative impacts in TMCF, especially along the southern part of Ecuador, where few PAs are located but TMCF area is extensive (Lessmann et al., 2014; Ortega-Andrade et al., 2015; Prieto-Torres et al., 2016). Because conservation efforts should also target also transitional borders with adjacent ecosystems and future climatic conditions, a reconsideration of the TMCF’s boundaries and the recognition of dynamic species movements are necessary to implement efficient conservation goals to this ecosystem.
Conflict of interestNone declared.
We thank Miguel Laporta, Pablo Meneses and Octavio Rojas-Soto for their assistance and support during the modelling process; and Felipe Campos, Marina Rodes and Nereida Guerra for the database management and for providing species information. We acknowledge funding from the Treub – foundation (grant to ADM), from the Rufford Foundation (grant #28285-1 to GMM); from the project “On the quest of the golden fleece in Amazonia: The first herpetological DNA - barcoding expedition to unexplored areas on the Napo watershed, Ecuador”, funded by the Secretaría Nacional de Ciencia y Tecnología del Ecuador (Senescyt- ENSAMBLE Grant #PIC-17-BENS-001), from the World Academy of Sciences (TWAS Grant #16-095 granted to HMOA). ADM acknowledges the Universidad Regional Amazónica Ikiam and Instituto de Ecología, A.C for the grant conceived to attend the “VI Curso de Modelado de Nicho Ecológico con énfasis en especies invasoras” in Galapagos, Ecuador (2019).
The following are Supplementary data to this article:

