


We assessed the effects of global climate change as a driver of spatio-temporal biodiversity patterns in bird assemblages associated to Neotropical seasonally dry forests (NSDF). For this, we estimated the geographic distribution of 719 bird species under current and future climate (2050 and 2070) projections considering two dispersal ability assumptions (contiguous dispersal vs. no dispersal). Then, using Sørensen-based multiple-site dissimilarity and range-diversity plots analyses, we assessed the potential changes of range size and covariance in species composition, as well as in alpha and beta diversities across NSDF and within the current Protected Areas (PAs). Over 77% of species tended to reduce their potential distributional ranges for years 2050 and 2070 (regardless climate and dispersal scenarios), including several species extirpations from the NSDF. In fact, considering the contiguous dispersion, we observed that, on average, only ∼7% of species will be favored (increasing >10% their current distributional areas) by new climate conditions. We estimated a general decrease in local species richness and increase in Whittaker’s beta diversity across NSDF and PAs under future scenarios, which is indicative of biotic heterogeneity. This scenario suggests that NSDF’s avian assemblages could be prone to an uneven structural reorganization (likely decreasing the taxonomic similarity between sites) as a consequence of climate change. Such change in biodiversity patterns imply a threat for conservation of birds in this highly diverse and fragile ecosystem; however, the spatio-temporal patterns for the NSDF avifauna identified herein can be useful to guide new conservation efforts.
Climate change has a significant impact on global biodiversity, mainly by increasing species’ extinction risk (Root et al., 2003; Opdam and Wascher, 2004; Lovejoy and Hannah, 2019). Rapid increases in temperature, in addition to current deforestation rates, can disrupt connectivity among habitats, leading to changes in elevational ranges, migration patterns, and in local abundance of biota (Reynolds et al., 2007; Feeley et al., 2012; Golicher et al., 2012; Prieto-Torres et al., 2016). These altered species’ distribution patterns could result in a widespread decline and eventual disappearance of species (Root et al., 2003; Peterson et al., 2002; Opdam and Wascher, 2004; Golicher et al., 2012). In fact, many of the world’s species that are listed as threatened are habitat specialists occupying small geographic areas and may be disproportionately affected by climate change (Wilkening et al., 2019). Likewise, considering that climate change produces species-specific responses (e.g., Peterson et al., 2002; Collevatti et al., 2013; Prieto-Torres et al., 2016), their co-occurrence patterns are also likely to change, resulting in a reorganization of novel assemblages due to expected species turnover and migration (Walther, 2010; Zwiener et al., 2018).
Studies about future climate change consequences should be performed with special attention to areas that have a high number of endemic species and/or on those that are heavily threatened (Lovejoy and Hannah, 2019). This is the case of Neotropical seasonally dry forests (NSDF), which despite of hosting both high levels of species richness and endemism (e.g., Pennington et al., 2009; Banda et al., 2016; Prieto-Torres et al., 2019a, 2019b), have received relatively little attention from ecologists and conservationists. One evidence of this is that nearly 65% of their original vegetation has been lost, and their representation under some kind of protected area (PA) is <10% of their current extent (Miles et al., 2006; Portillo-Quintero and Sánchez-Azofeifa, 2010; Prieto-Torres et al., 2018). Therefore, there is a growing interest in understanding the interactive effects of both anthropogenic and climate disturbances on the potential reorganization of NSDF’s biodiversity, and in trying to identify priority sites to protect (Miles et al., 2006; Portillo-Quintero and Sánchez-Azofeifa, 2010; Banda et al., 2016; Prieto-Torres et al., 2016, 2018, 2019b; Escribano-Avila et al., 2017).
Previous studies suggested that the most pervasive effects of climate change in NSDF biotic communities could be the decrease of both alpha and beta diversities (Meir and Pennington, 2011; Collevatti et al., 2013; Prieto-Torres et al., 2016). The outcome of such decreases may result in biotic homogenization across the biome, and consequently alteration in the function of ecosystems (Clavel et al., 2011; Vázquez-Reyes et al., 2017; Zwiener et al., 2018; Hidasi-Neto et al., 2019). Climate change can also promote the extinction of specialist species (typically those with narrow ecological niches and small geographic distributions) and, at the same time, range expansions of generalists species (usually with broad ecological niches and large geographic distributions), leading to a reduction in species richness and taxonomic dissimilarity for once disparate biotas (Clavel et al., 2011; Collevatti et al., 2013; Vázquez-Reyes et al., 2017; Zwiener et al., 2018; Silva et al., 2019; Hidasi-Neto et al., 2019). However, given the species turnover and relationships among NSDF major regions observed for both plant (see Banda et al., 2016) and bird (see Prieto-Torres et al., 2019b) species, the potential impact of climate change in ecological communities on these forest is likely to be regionally different (Collevatti et al., 2013; Prieto-Torres et al., 2016; Hidasi-Neto et al., 2019; Wilkening et al., 2019). Despite the relevance of this topic, there are still few studies comparing potential richness in dry and warm-flat biomes as compared to large scale climatic variability (Reynolds et al., 2007; Collevatti et al., 2013; Prieto-Torres et al., 2016; Borges et al., 2019; Hidasi-Neto et al., 2019), thus restricting our understanding about the future consequences (including biotic homogenization and/or heterogeneity) and threats to biodiversity in these important ecosystems.
Birds are well-known vertebrates that have long attracted the attention of scientists, decision makers, and non-governmental organizations to highlight and promote conservation policies and needs (e.g., Kati et al., 2004; Barnagaud et al., 2017). Because of their importance in tropical ecosystems, ranging from shaping the structure of communities to their contribution in many ecological processes (e.g., seed dispersion, pollination, and plant reproduction), and their strong vulnerability to environmental alterations (Lawton et al., 1998; Sekercioglu, 2006), using birds represent an excellent alternative to address the conservation efforts in Latin America (Kujala et al., 2013). Therefore, predictions on the effects of rapid changes in climate and land-use on bird assemblages are useful to infer threats to their conservation (e.g., Triviño et al., 2018). This information may allow us to provide new and more accurate evidence to guide conservation decision-making processes in the long-term protection of NSDF’s biodiversity.
Herein, we used potential distributional ranges derived from ecological niche modelling for 719 resident bird species to assess changes in species’ geographic distributions and assemblages for two future time scenarios: 2050 and 2070. More specifically, considering that distributional patterns of species and ecosystems are not static, we explored current and future spatial patterns of species richness, range size, and covariance in composition for different climate change scenarios across the NSDF distributed in the Caribbean islands, Mesoamerica, and northern South America. Assuming a relationship between climatic niche and geographic distribution, this information allowed us to investigate the potential effects of global climate change as a driver of taxonomic instability (i.e., whether the biota could remain unchanged or become either more heterogeneous or homogeneous) at both local and regional scales (e.g., Ochoa-Ochoa et al., 2012; Zwiener et al., 2018). Finally, we explore and discuss the role of current Protected Areas (PAs) for the protection of NSDF’s avifauna in relation to likely changes in species’ distributional ranges.
MethodsStudy areaThe NSDF are broadly defined as ecosystems typically dominated (i.e., >50%) by deciduous trees, which are present in frost-free areas with mean annual temperature >25 °C, a total annual precipitation of 700–2,000 mm and at least three or more dry months precipitation <100 mm per year (Murphy and Lugo, 1986; Sánchez-Azofeifa et al., 2005; Pennington et al., 2009; Banda et al., 2016). NSDF encompass 42 ecoregions according to Olson et al. (2001) and are discontinuously distributed from northwestern Mexico to northern Argentina and southwestern Brazil in disjunct areas of varying size (Pennington et al., 2000; Banda et al., 2016). Herein, based on previous results suggesting two major biogeographic groups (northern vs. southern) of NSDF's biota across the Americas (Pennington et al., 2000, 2009; Linares-Palomino et al., 2011; Banda et al., 2016; Prieto-Torres et al., 2019a, 2019b), we only included the forests distributed in six regions throughout the Caribbean islands, northwestern Mexico, Yucatan Peninsula, Central America, the Caribbean coast of Colombia and Venezuela, and the northern Inter-Andean valleys in Colombia (Fig. 1). These regions involve the so called “northern” NSDF group, which is separated from rest of South America by important geographical and ecological barriers such as the Chocó forest, the Amazon basin, and the Andean Cordillera (Porzecanski and Cracraft, 2005; Banda et al., 2016; Prieto-Torres et al., 2019a).
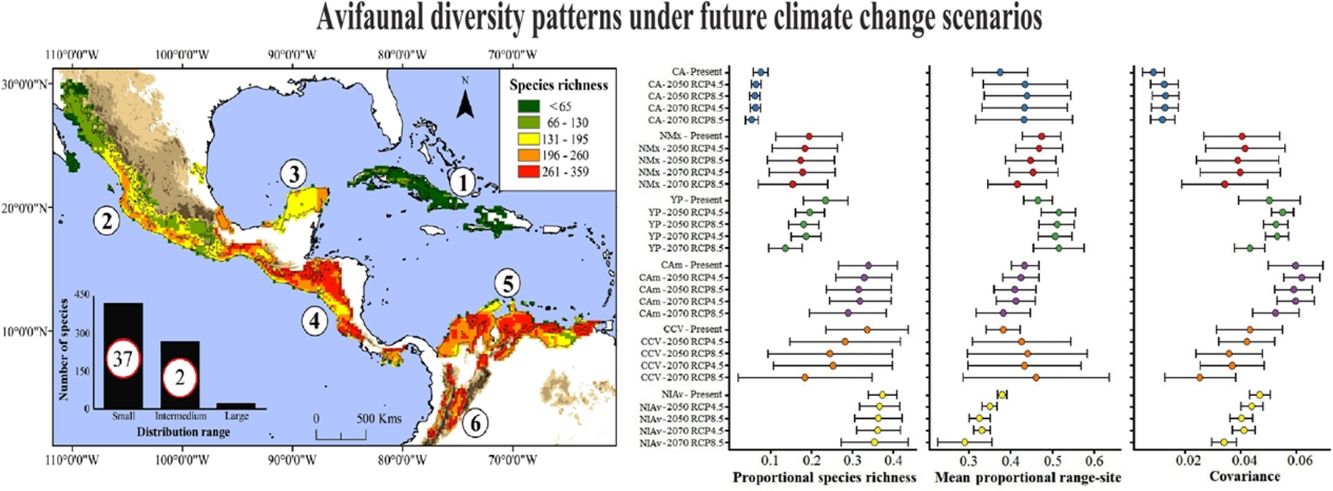
![Current species richness patterns of avifauna associated to northern Neotropical seasonally dry forests (NSDF). Left: Distribution of species richness of 719 bird species in northern NSDF; inserted bar plot indicates the number of species categorized as small, intermediate, and large distributional ranges within the extent of the study area. Circles inside bars depict the number of threatened species in each range size category. Right: per-site range-diversity plot of current bird assemblages in the NSDF indicating the six main NSDF regions identified by previously published works (Pennington et al., 2000; Banda et al., 2016; Prieto-Torres et al., 2018, 2019b): (1) Caribbean islands [CA], (2) northwestern Mexico [NMx], (3) Yucatan Peninsula [YP], (4) Central America [CAm], (5) Caribbean coast of Colombia-Venezuela [CCV], and (6) northern Inter-Andean valleys in Colombia [NIAv]. Top-left box corresponds to sites in the NSDF having, on average, species assemblages with high richness and small ranges, while bottom-right box corresponds to those sites with low richness and large ranges. Points to the right and left of the vertical line (1/beta diversity) have positive and negative covariance, respectively.](https://static.elsevier.es/multimedia/25300644/0000001800000001/v2_202004210708/S253006442030002X/v2_202004210708/en/main.assets/gr1.jpeg?xkr=ue/ImdikoIMrsJoerZ+w988y0mNZd/sWcEakL5FQCEtADAdUQkaAPjNO7GBaXKAbFi3a+S+po5uPhXKPhEaQ214IgYw05qtkz9w858pipXcan5xSsw//0SHClBZr4tfQ8bmEI5lfuc7IWOgZlpIWzX77Gso9aX2RBn5aENPresvNd0e6+fpRtYa5/hhNs3qdM23OipsmB66Z3HvOx0RYb6vrS6cwINnunpVjQBvOlDx0ikEPf2NHDvfNUJh13/ynFEx8ifjg4s9GhQhnEY+qLBQkvNHnO1UAz6q/oZy4wrIarps2CU2LknY+82tsLicjgiCJkI7atgiS1I2FHPOpVQ== "Current species richness patterns of avifauna associated to northern Neotropical seasonally dry forests (NSDF). Left: Distribution of species richness of 719 bird species in northern NSDF; inserted bar plot indicates the number of species categorized as small, intermediate, and large distributional ranges within the extent of the study area. Circles inside bars depict the number of threatened species in each range size category. Right: per-site range-diversity plot of current bird assemblages in the NSDF indicating the six main NSDF regions identified by previously published works (Pennington et al., 2000; Banda et al., 2016; Prieto-Torres et al., 2018, 2019b): (1) Caribbean islands [CA], (2) northwestern Mexico [NMx], (3) Yucatan Peninsula [YP], (4) Central America [CAm], (5) Caribbean coast of Colombia-Venezuela [CCV], and (6) northern Inter-Andean valleys in Colombia [NIAv]. Top-left box corresponds to sites in the NSDF having, on average, species assemblages with high richness and small ranges, while bottom-right box corresponds to those sites with low richness and large ranges. Points to the right and left of the vertical line (1/beta diversity) have positive and negative covariance, respectively.")
Current species richness patterns of avifauna associated to northern Neotropical seasonally dry forests (NSDF). Left: Distribution of species richness of 719 bird species in northern NSDF; inserted bar plot indicates the number of species categorized as small, intermediate, and large distributional ranges within the extent of the study area. Circles inside bars depict the number of threatened species in each range size category. Right: per-site range-diversity plot of current bird assemblages in the NSDF indicating the six main NSDF regions identified by previously published works (Pennington et al., 2000; Banda et al., 2016; Prieto-Torres et al., 2018, 2019b): (1) Caribbean islands [CA], (2) northwestern Mexico [NMx], (3) Yucatan Peninsula [YP], (4) Central America [CAm], (5) Caribbean coast of Colombia-Venezuela [CCV], and (6) northern Inter-Andean valleys in Colombia [NIAv]. Top-left box corresponds to sites in the NSDF having, on average, species assemblages with high richness and small ranges, while bottom-right box corresponds to those sites with low richness and large ranges. Points to the right and left of the vertical line (1/beta diversity) have positive and negative covariance, respectively.
We compiled a NSDF resident bird species list based on previous studies from Prieto-Torres et al. (2019a, 2019b), who defined the community structure of NSDF’s avifauna across their continental extent. We decided to exclude those species with less of 8 independent occurrence records available for modelling purposes, as well as those species marginally inhabiting NSDF (defined as those with a geographical range that includes less than 10% of NSDF). The value was established following Prieto-Torres et al. (2019a, 2019b), indicating (based on degree of coverage of the geographical distributions for each species and endemicity indices) that species with lower percentages correspond mostly to occasional or accidental records within NSDF areas. Thus, their inclusion may bias the identification of both species’ richness and endemicity patterns (e.g., Rojas-Soto et al., 2003; Sánchez-González et al., 2008; Ríos-Muñoz and Navarro-Sigüenza, 2012). The final list included 719 species (Supplementary Data, Appendix S1). Taxonomy follows Gill and Donsker (2015) for Mesoamerican species, and the South American Classification Committee (Remsen et al., 2017) and the Clements Checklist (Clements et al., 2015) for species ranging only in South America.
A database of available records per species was gathered from different scientific collections (Supplementary Data, Appendix S2), and online databases (Global Biodiversity Information Facility [GBIF; https://www.gbif.org/], eBird [https://ebird.org/home], SiB-Colombia [https://sibcolombia.net/], and Atlas de Registro de Aves Brasileiras [ARA; http://ara.cemave.gov.br/]). Access numbers for downloaded GBIF records downloaded are detailed in the Supplementary Data (Appendix S3). Then, we decided to use only data from years 1950 to 2018, retaining those temporal information that matches geographically with those occurrences reported from our different sources, considering a buffer distance of 10 km2 (i.e., double distance for the cell size resolution used herein). For those locality records from 2001 to 2018 without geographical match with another occurrences, we compared the spatial distribution of records with the ranges of species defined by the Neotropical Birds' website (https://neotropical.birds.cornell.edu) and BirdLife International (https://www.birdlife.org/), removing all those mismatch records, and retaining only information corresponding to unique localities information within a vicinity of ∼5 km2. Also, we eliminated all those localities where temperature and precipitation values were outside of the limits defined by occurrence data (considered at the upper and lower quartiles) within the time range of bioclimatic variables. These steps were important to identify problematic or imprecise occurrences with incorrect climate values, due to the choice of climate baseline and the reduction of sampling bias effects (and spatial autocorrelation) are important for model performance (Roubicek et al., 2010; Boria et al., 2014). Then, considering the performance of individual species’ models, we discarded those that were not statistically significant. After all these steps, we had a total of 1,059,732 historical records for the 719 number of species analyzed. All geographic coordinates were transformed to decimal degrees, based on the WGS84 datum.
Current and future climatic scenariosIn order to characterize the potential distribution ––based on ecological niche modelling principles–– we downloaded interpolated climate data (∼5 km2 cell size resolution) from the WorldClim project 1.4; which included a set of 19 climatic variables that summarize aspects of precipitation and temperature (Hijmans et al., 2005). Likewise, in order to reduce over-fitting and collinearity of environmental layers, models for each species were performed using only non-correlated (r < 0.8) variables in current climate scenarios, selecting the most important variables according to each species’ occurrence data and their spatial arrangement. We decided to use simple (i.e., non-transformed) variables, over alternative approaches like PCA (e.g., Hanspach et al., 2011; Dupin et al., 2011), because produces results that allow to properly interpret the environmental information used in species modelling approximations (Peterson et al., 2011; Cobos et al., 2019). The variables used for each species were selected via a Pearson’s correlation coefficient, as implemented in the “corrplot” library (Wei and Simko, 2017) in R software (R-Core-Team, 2013).
Variables for future climate projections in the years 2050 and 2070 were based on the IPCC Fifth Assessment Report (IPCC, 2014) from which we selected four global climate models (ACCESS 1.0, CCSM4, MIROC5 and HadGEM2-ES) based on: (1) these models show improvements in the estimation of precipitation values, zonal-mean atmospheric fields, equatorial ocean subsurface fields, and the simulation of El Niño-Southern Oscillation (e.g., Watanabe et al., 2010; Bi et al., 2013); and (2) results obtained from GCM compareR's web application (available in http://www.ecoinformatica.net/GCMcompareR.html; Fajardo et al., 2020), assist researchers in selection of climate models to increase objectivity and repeatability (e.g., Shepherd et al., 2018). Likewise, we evaluated the possible conservation impacts of climate change NSDF’s avifauna based on two contrasting Representative Concentration Pathway scenarios: RCP 4.5 and RCP 8.5 (IPCC, 2014). Overall, despite that both RCP scenarios assume an increasing human population, the RCP 8.5 scenario represents higher predicted greenhouse gas emissions with absence of climate change mitigation policies compared with the RCP 4.5 (Riahi et al., 2011; Stocker et al., 2013), and so the results under this scenario may be interpreted as “pessimistic”. All global climate models were downloaded from the WorldClim website (http://www.worldclim.org/cmip5_2.5m) as digital layers.
Ecological niche and species distribution modelsWe modelled habitat suitability for each species using MaxEnt version 3.4.1k (Phillips et al., 2006). Although recent studies have shown that there are uncertainties when forecasting species distributions depending on the algorithm used (Heikkinen et al., 2006; Qiao et al., 2015), we decided to use MaxEnt over other available methods as it has proved high performance and suitability for presence-only data (Elith et al., 2011). As a proof, following the recommendations by Qiao et al. (2015), we compared the geographical prediction accuracy of 250 species randomly selected using both MaxEnt and Bioensembles approaches. Results from Bioensembles tended to overfit suitable areas, increasing the omission errors in the data; we therefore discarded this last approach from our study.
Following Barve et al. (2011), we created an area for model calibration (or “M” sensuSoberon and Peterson, 2005) that reflects the accessible historical areas and restriction regions (e.g., including dispersal barriers) for each species. Theoretically, consideration of restricting calibration areas: (a) affects the estimation of the distribution of environments and, consequently, the ENM’s output estimate (Merow et al., 2013); and (b) by using a restricted region for the transferring to future climate scenarios, as in here, one is adding a hypothesis about the area available for dispersal (see below); which approximates the ENM’s estimates to actual areas of distribution (Soberon and Peterson, 2005). Herein, we used specific areas for model calibration (in practice a mask or GIS polygon) for each species, which were defined based on the intersection of occurrence records with the WWF Terrestrial Ecoregions (Olson et al., 2001) and the Biogeographical Provinces of the Neotropical region (Morrone, 2014). Such consideration assumed that these regions may define the specific region of restriction for each species.
All models were run with no extrapolation to avoid artificial projections of extreme values of ecological variables (Elith et al., 2011; Owens et al., 2013), while other MaxEnt parameters were set to default. Then, to aid model validation and interpretation, we converted the logistic values of suitability from each model into a presence-absence map by setting a decision threshold equal to the tenth percentile training presence (TPTP). This threshold allows reducing commission errors (i.e., areas of over-prediction) in our final binary maps, while recovering more conservative species distributional ranges (Liu et al., 2013). In fact, previous works suggested to use this threshold for a better recovery of species distributional areas (Escalante et al., 2013; Owens et al., 2013). In addition, models for species with 8–14 records were developed using all presence data and assessed with a Jackknife test (Pearson et al., 2007), while for species with >15 records (n = 711), models were generated using a random sampling of 80% of the locality records for model training and the remaining 20% for model evaluation. For these latter, statistical performance of models was evaluated using the Partial-ROC test (Peterson et al., 2008). Likewise, to generate only the “best hypothesis map” for each species, we compared our final maps against available distributional information of each species (e.g., Cracraft, 1985; Gordon and Ornelas, 2000; Herzog and Kessler, 2002; Schulenberg et al., 2010; Gill and Donsker, 2015; Herzog et al., 2016) discarding those models with high commission errors and/or statistically not significant.
For each species, we obtained geographic distribution maps estimates in the future by overlaying the binary projections (i.e., transferring to future climate scenarios) from the four global climate models and only considering sites in which at least three models coincided. In this sense, four consensus maps were obtained for the modeled forecasts for every bird species (two years [2050 and 2070] × two scenarios [RCP4.5 and RCP8.5]). Processing of ENMs were performed in ArcMap 10.2.2 (ESRI, 2010) using the “raster calculator” toolbox. All models obtained were cropped to the geographic extent within latitudes 34º 40′ 37.09″ – 0° 16′ 22.8″ N and longitudes -118° 20′ 25.62″ – −56° 30′ 25.62″ W (corresponding to the extension range of the NSDF herein studied; Fig. 1).
We measured the potential change in the distribution areas for each species under two assumptions regarding dispersal ability: contiguous dispersal vs. not-dispersal (Peterson et al., 2002). For the first case, the assumption was that species would be able to disperse through continuous habitat but not jump over barriers as defined by the calibration area; that is, the modelled actual distribution was overlapped with the post-change (i.e., new areas in future scenarios) prediction. In the second case, the assumption was that species were simply unable to disperse and would inhabit only those portions of present distributional areas that remain habitable, meaning that modelled actual distributions would reduce to those areas predicted to be habitable post-change. Because the not-dispersal scenario is a sub-set in the geographic space from contiguous dispersal, this must be considered as the most “unfavorable” scenario for the species.
Presence-absence matrices and summary metricsWe constructed a site × species presence-absence matrix (PAM) for each climate scenario and dispersal ability assumption by overlaying the estimated distribution of each species on an equal-area grid of 0.25° × 0.25° of spatial resolution. This process resulted in nine PAMs of 2,307 sites × 719 species. Herein, we assumed the species presence only for those cases where the individual models predicted at least 10% of areas within each grid (approximately 30km2. Likewise, we classified the current species ranges into large (that occupied more than 1,730 [upper quartile]), intermediate and small (that occupied up to 577 sites [lower quartile]) according to the number of sites they occupied out of the total number of sites. This information allowed us to assess the effects of climate change on range expansion and retraction for the species. To test our hypothesis that distributional ranges, habitat specialization i.e., not restricted vs. NSDF-restricted species) and the conservation status for species leads to a greater vulnerability to climate-induced range contraction, we compared the proportion of change observed in the occurrence extent of species between the current period and the climate change scenarios using a one-way ANOVA test. Information of those NSDF-restricted species (n = 247) was obtained from Stotz et al. (1996) and Prieto-Torres et al. (2019a, 2019b), while threat status was assigned according to the IUCN’s (2015) categories.
Then, for each PAM, we explored the variation in species composition using Sørensen-based multiple-site dissimilarity and by partitioning of the total dissimilarity into turnover and nestedness components (Baselga, 2010; Baselga and Orme, 2012). In this sense, the total dissimilarity and additive components (turnover and nestedness) were calculated for species assemblages under current climate conditions and contrasted with projections of each future climatic scenarios and dispersal ability assumption. Subsequently, we summarized the diversity patterns using range-diversity plots (R-D plots) by sites (Arita et al., 2008, 2012). This last approach is based on the per-site species richness (i.e., number of species in each site [S]) and the species range sizes (i.e., number of sites occupied by each species [R]) obtained from the PAM. Axes in the per site R-D plot correspond to the proportional species richness of sites in the ordinates, and to the mean proportional per-site range size in the abscissa. The distribution of points in the R-D plot is determined by biological and mathematical constraints related to the minimum and maximum species richness and range size, while the central tendency is determined by Whittaker’s beta diversity of the entire community, which is equivalent to the proportional fill (total occurrences/N) of the PAM (Arita et al., 2008, 2012).
We assessed potential effects of climate change on species assemblages across the NSDF by comparing the dispersion of points in the R-D plots between current and future climatic conditions. Specifically, we contrasted the lines of 1/beta diversity and maximum covariance among all scenarios, which simplified the visualization of point dispersion in the plot, while representing a summary of the expected trend across the entire species community (Arita et al., 2008; Zwiener et al., 2018). We evaluated the statistical significance of sites covariance of the R-D plot through randomizations of PAMs for the present and future climate scenarios (Cavner et al., 2012; see Supplementary Data [Appendix S4] for more details of null models).
To provide a complementary biogeographic interpretation of climate change on species diversity and distributional patterns, we contrasted the averages and standard deviations of species richness, range sizes and covariance in composition obtained from current and future climate projections for the six NSDF regions herein analyzed (Fig. 1). Finally, we used notched box plots to compare changes of the same metrics within the current PAs systems. Herein, we included the same PAs categories (Supplementary Data, Appendix S5) considered by Prieto-Torres et al. (2018). The shapefile of the PAs was downloaded from the World Database of Protected Areas (IUCN and UNEP-WCMC, 2012).
ResultsSpecies distribution models and current avifaunal diversity patternsOur models showed high values of AUC ratios from the partial ROC test (ranking from 1.09 to 1.99; p < 0.05) for the species with >15 occurrence records, while the Jackknife test showed that models were statistically significant (p < 0.01) for those species with <15 occurrence records when the threshold was applied. Performance values for both modelling assessing approaches indicated that species’ distribution models were statistically accurate. Overall, we observed that Bio 18 (Precipitation of warmest quarter), Bio 15 (Precipitation seasonality), Bio 19 (Precipitation of coldest quarter), and Bio 03 (Isothermality) were the environmental variables more frequently used for model construction (92% of the cases; Supplementary Data, Appendix S1).
We observed that in the present, bird species possess, on average, 34.4% of their distribution within the NSDF. We also found that 58.97% of species correspond to those with small distributional ranges within the northern NSDF (i.e., Caribbean islands, Mesoamerica, and northern South America), while 37.69% of species showed intermediate ranges sizes. Only 3.34% of species showed large distributional ranges (Fig. 1). According to the IUCN (Table S1), we observed that 39 species are classified as threatened (VU, EN, CR), 26 as near threatened (NT), 649 species as least concern (LC), and five as data deficient (DD).
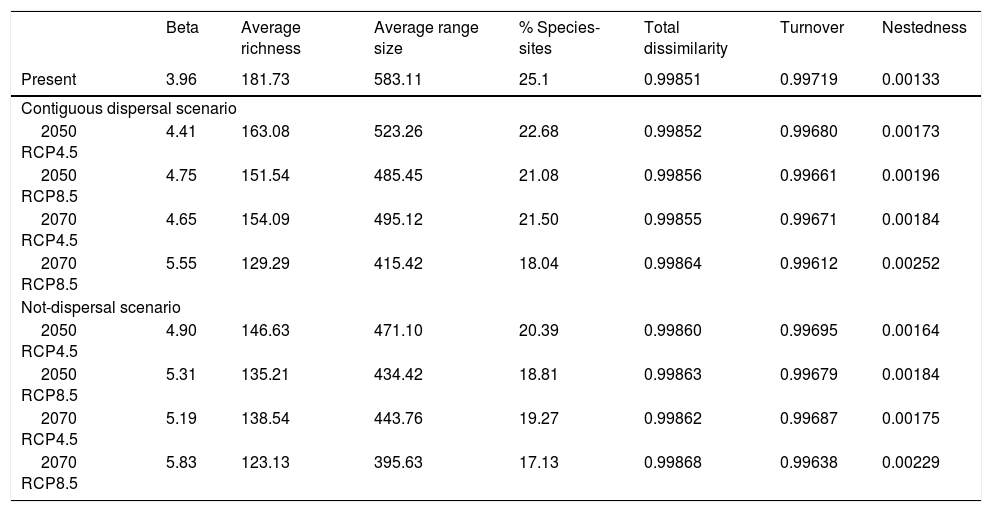
Current NSDF avifauna assemblage showed a Whittaker’s beta of 3.96 and sites contained, on average, 25.1% of the species included in our study (Table 1). We evidenced a higher contribution of species turnover to the total dissimilarity because in the RD plots most of the main NSDF regions could be distinguished as relatively cohesive and well- differentiated groups in both species’ richness and range size values (Figs. 1 and 2). Regions with highest species richness corresponded to Central America, the Caribbean coast of Colombia and Venezuela, and the northern Inter-Andean valleys in Colombia. The lowest species richness was found in the interior of the Caribbean islands and in northwestern Mexico. In addition, most sites showed positive covariance, indicating that they have species in common. Only two sites in the Caribbean islands showed negative Whittaker’s beta values (Fig. 1).
Summary of diversity metrics of the entire avifaunal assemblage associated to northern Neotropical seasonally dry forests (NSDF) projected to present and future climate scenarios.
| Beta | Average richness | Average range size | % Species-sites | Total dissimilarity | Turnover | Nestedness | |
|---|---|---|---|---|---|---|---|
| Present | 3.96 | 181.73 | 583.11 | 25.1 | 0.99851 | 0.99719 | 0.00133 |
| Contiguous dispersal scenario | |||||||
| 2050 RCP4.5 | 4.41 | 163.08 | 523.26 | 22.68 | 0.99852 | 0.99680 | 0.00173 |
| 2050 RCP8.5 | 4.75 | 151.54 | 485.45 | 21.08 | 0.99856 | 0.99661 | 0.00196 |
| 2070 RCP4.5 | 4.65 | 154.09 | 495.12 | 21.50 | 0.99855 | 0.99671 | 0.00184 |
| 2070 RCP8.5 | 5.55 | 129.29 | 415.42 | 18.04 | 0.99864 | 0.99612 | 0.00252 |
| Not-dispersal scenario | |||||||
| 2050 RCP4.5 | 4.90 | 146.63 | 471.10 | 20.39 | 0.99860 | 0.99695 | 0.00164 |
| 2050 RCP8.5 | 5.31 | 135.21 | 434.42 | 18.81 | 0.99863 | 0.99679 | 0.00184 |
| 2070 RCP4.5 | 5.19 | 138.54 | 443.76 | 19.27 | 0.99862 | 0.99687 | 0.00175 |
| 2070 RCP8.5 | 5.83 | 123.13 | 395.63 | 17.13 | 0.99868 | 0.99638 | 0.00229 |
 regions herein analyzed under current and future climatic conditions. Acronyms and colors in the graphs correspond to the names for the six main NSDF-regions analyzed herein: Caribbean islands (CA), northwestern Mexico (NMx), Yucatan Peninsula (YP), Central America, (CAm) Caribbean coast of Colombia-Venezuela (CCV), and the northern Inter-Andean valleys in Colombia (NIAv). Black circles and horizontal bars represent the values for means and standard deviations, respectively. Appendix S6 shows the values of means and standard deviations obtained for the species richness patterns projected to future global climate scenarios considering the not-dispersal ability scenario for species.")
Values of mean proportional richness, mean proportional range size and covariance for avifauna associated to six main Neotropical seasonally dry forests (NSDF) regions herein analyzed under current and future climatic conditions. Acronyms and colors in the graphs correspond to the names for the six main NSDF-regions analyzed herein: Caribbean islands (CA), northwestern Mexico (NMx), Yucatan Peninsula (YP), Central America, (CAm) Caribbean coast of Colombia-Venezuela (CCV), and the northern Inter-Andean valleys in Colombia (NIAv). Black circles and horizontal bars represent the values for means and standard deviations, respectively. Appendix S6 shows the values of means and standard deviations obtained for the species richness patterns projected to future global climate scenarios considering the not-dispersal ability scenario for species.
The NSDF regions with the highest numbers of species and smallest mean range sizes were the northern Inter-Andean valleys, the Caribbean coast of Colombia-Venezuela, and Central America, with the first of them having on average the smallest range sizes (Fig. 2). Contrarily, the Caribbean islands and western Mexico showed the lowest species richness and largest mean range sizes. The NSDF regions with the highest positive covariances were Central America, the Yucatan Peninsula, and the northern Inter-Andean valleys; whereas the Caribbean islands, northwestern Mexico, and the Caribbean coast of Colombia-Venezuela showed the smallest positive covariance values (Figs. 1 and 2).
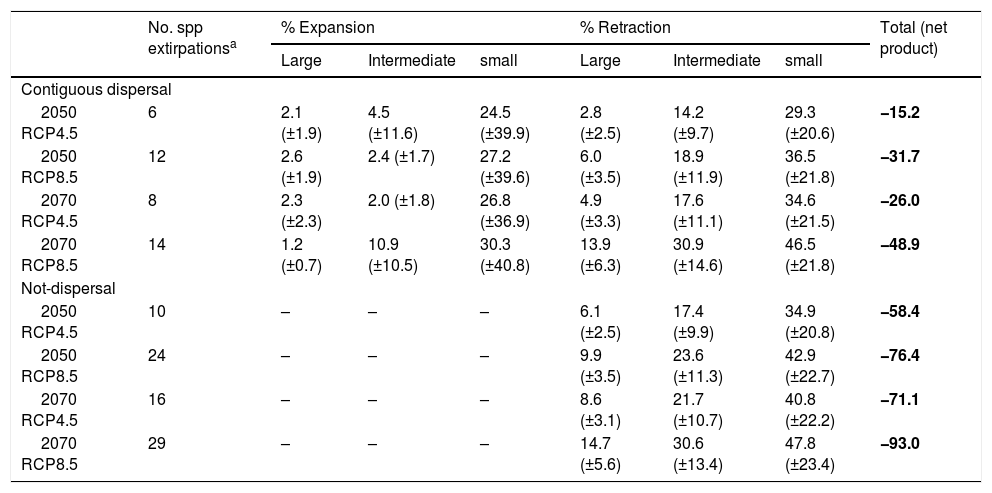
Global climate change and diversity patternsThe projection of all bird species in our study to the 2050 and 2070 climate-change and dispersal scenarios showed that current distribution of NSDF’s avifauna may be significantly modified. Overall, the future scenarios are similar in their predictive qualitative patterns, although the pessimistic and unfavorable scenarios (i.e., RCP 8.5 and not-dispersal ability) predict larger decreases in both distribution of individual taxa and species richness patterns within the NSDF areas (Table 2; Supplementary Data [Appendix S6]). The following patterns emerge from these predictions: (i) over 77% of bird species tended to reduce their potential distributional ranges for years 2050 and 2070 (independently to RCP and dispersal scenarios) ––including several species extirpations from the NSDF (i.e., retraction values higher than 95%; Table 2); (ii) species will be favored (increasing >10% of their current distributional areas) by new climate conditions only in ∼7% of the cases (n = 50) considering the contiguous dispersal scenario; (iii) species will possess, on average and independently of RCP/dispersal scenarios, less than 31% of their potential distribution within the current NSDF areas; (iv) the NSDF’ species richness patterns for each cell under present and future projections tended to decrease (from 5.06% to 33.63%); (v) we observed a reduction (∼31% [contiguous dispersal] and ∼51% [not-dispersal]) in the number of NSDF areas with highest species richness (i.e., with >261 spp.; red grids in Fig. 3 and Appendix S6); (vi) NSDF’s areas with highest species richness will occupy higher elevation zones (∼250 m independently to dispersal scenarios) above the current average distribution; and (vii) Whittaker’s beta of sites and the total dissimilarity values differed between current and future climatic conditions, with a clear tendency of an increase in the beta values in the future led by increasing nestedness in species composition (Table 1).
Average percentage and standard error (in parentheses) of expansion, retraction and net product (expansion minus retraction) of ranges for bird assemblage associated to northern Neotropical seasonally dry forests (NSDF) classified three different range sizes.
| No. spp extirpationsa | % Expansion | % Retraction | Total (net product) | |||||
|---|---|---|---|---|---|---|---|---|
| Large | Intermediate | small | Large | Intermediate | small | |||
| Contiguous dispersal | ||||||||
| 2050 RCP4.5 | 6 | 2.1 (±1.9) | 4.5 (±11.6) | 24.5 (±39.9) | 2.8 (±2.5) | 14.2 (±9.7) | 29.3 (±20.6) | −15.2 |
| 2050 RCP8.5 | 12 | 2.6 (±1.9) | 2.4 (±1.7) | 27.2 (±39.6) | 6.0 (±3.5) | 18.9 (±11.9) | 36.5 (±21.8) | −31.7 |
| 2070 RCP4.5 | 8 | 2.3 (±2.3) | 2.0 (±1.8) | 26.8 (±36.9) | 4.9 (±3.3) | 17.6 (±11.1) | 34.6 (±21.5) | −26.0 |
| 2070 RCP8.5 | 14 | 1.2 (±0.7) | 10.9 (±10.5) | 30.3 (±40.8) | 13.9 (±6.3) | 30.9 (±14.6) | 46.5 (±21.8) | −48.9 |
| Not-dispersal | ||||||||
| 2050 RCP4.5 | 10 | – | – | – | 6.1 (±2.5) | 17.4 (±9.9) | 34.9 (±20.8) | −58.4 |
| 2050 RCP8.5 | 24 | – | – | – | 9.9 (±3.5) | 23.6 (±11.3) | 42.9 (±22.7) | −76.4 |
| 2070 RCP4.5 | 16 | – | – | – | 8.6 (±3.1) | 21.7 (±10.7) | 40.8 (±22.2) | −71.1 |
| 2070 RCP8.5 | 29 | – | – | – | 14.7 (±5.6) | 30.6 (±13.4) | 47.8 (±23.4) | −93.0 |
 projected under two representative concentration pathways of greenhouse gas concentration (RCP 4.5 and 8.5) for years 2050 and 2070 and considering the contiguous dispersal ability of species. The spatial coincidence among the NSDF’ species richness patterns from present and future projections tended to decrease with time; in fact, number of areas with highest species richness values (i.e., >260 spp.) decreased (∼31%) in the future, occupying higher regions (∼250 m) above the current average elevational distribution. Inserted histograms in maps represent the number of species and their proportional change (i.e., 0–25%, 25–50%, and >50%) losing (gray) or increasing (black) in the distributional areas between current climatic conditions and future scenarios. Appendix S4 shows the maps of species richness patterns projected to future climate conditions considering the not-dispersal ability of species.")
Species richness patterns for avifauna associated to northern Neotropical seasonally dry forests (NSDF) projected under two representative concentration pathways of greenhouse gas concentration (RCP 4.5 and 8.5) for years 2050 and 2070 and considering the contiguous dispersal ability of species. The spatial coincidence among the NSDF’ species richness patterns from present and future projections tended to decrease with time; in fact, number of areas with highest species richness values (i.e., >260 spp.) decreased (∼31%) in the future, occupying higher regions (∼250 m) above the current average elevational distribution. Inserted histograms in maps represent the number of species and their proportional change (i.e., 0–25%, 25–50%, and >50%) losing (gray) or increasing (black) in the distributional areas between current climatic conditions and future scenarios. Appendix S4 shows the maps of species richness patterns projected to future climate conditions considering the not-dispersal ability of species.
We observed that percentage of species per site tended to decrease with time in both dispersal scenarios (Table 1): ∼4% (contiguous dispersal) and ∼6% (not-dispersal). On a contiguous dispersal scenario, species expand and retract over time within NSDF regardless range size (Table 2). However, the difference between expansions and retractions was always negative (independently of RCP and dispersal scenarios; see column Total in Table 2), indicating a tendency of net decrease in species distributions, caused mostly by decreases of a high number of species with small ranges (especially in high emission and not-dispersal scenarios), compared to those of large and intermediate ranges. In fact, under future climate change, we observed that suitability conditions for potential distribution of several species were drastically reduced (values higher than 95%), which may lead or have a negative effect on their populations, resulting in extirpations or extinctions of several of them (Table 2). This last fact was observed mainly for island species with very small ranges. In addition, the ANOVA tests showed that species classified as NSDF-restricted (F = 5.77, p < 0.01) and currently threatened (F = 14.23, p < 0.001) may have a greater vulnerability due to climate-induced range contraction (44% and 54%, respectively) when considered only in the not-dispersal scenarios.
Species richness within the six NSDF regions obtained from projections to future climate scenarios was highly variable with a tendency to decrease in comparison to current values (Figs. 2 and 3). Estimates of mean range size and covariance within regions presented a consistent tendency towards larger values only in the Caribbean islands and Yucatan Peninsula (excepting in the 2070 RCP8.5 scenario); while northwestern Mexico, Central America (excepting in the 2050 RCP4.5 scenario), and the northern Inter-Andean valleys showed on average lower values for both range size and covariance parameters (Fig. 2). The NSDF distributed along the Caribbean coast of Colombia-Venezuela showed a tendency to increase in the mean range size but a decrease for the covariance value (Fig. 2). Finally, in comparison to current climate conditions, PAs under climate change scenarios showed (regardless RCP and dispersal scenarios) a decrease in proportional species richness, mean range size and covariance values (Fig. 4).
 within Protected Areas under current and future climatic conditions projected under two representative concentration pathways of greenhouse gas concentration (RCP 4.5 and 8.5) for years 2050 and 2070.")
Proportional species richness, mean proportional range size and covariance differences among avifauna associated to Neotropical seasonally dry forests (NSDF) within Protected Areas under current and future climatic conditions projected under two representative concentration pathways of greenhouse gas concentration (RCP 4.5 and 8.5) for years 2050 and 2070.
We herein provided a quantitative evaluation and strong evidence about spatio-temporal rearrangements in the bird communities from Neotropical seasonal dry forests (NSDF) as a consequence of global climate change. Matching results obtained by many studies (e.g., Jetz et al., 2007; Reynolds et al., 2007; Prieto-Torres et al., 2016; Destro et al., 2019; Ortega et al., 2019), our results showed that more than 75% of the bird species in these forests will reduce their climatically suitable areas (i.e., distributional range) and, consequently, we expected to observe shifts in co-occurrence patterns due to decrements in species richness locally. Most importantly, we observed that NSDF avifaunal assemblages are prone to uneven spatial structural reorganization, most likely affecting future biodiversity dynamics within one of the most threatened ecosystems in the world (Miles et al., 2006; Banda et al., 2016). In fact, we observed that suitable habitats for species will reduce (more than 3%) its extension within NSDF boundaries and even NSDF’s areas with highest species richness tend to increase their elevation range above the average of its current distribution. These results reinforce the widely accepted idea that important changes in the ranges of both dry and mountain biota will occur during the twenty-first century, including the extinction risk and migrations to higher elevations (e.g., Peterson et al., 2002; Golicher et al., 2012; Rojas-Soto et al., 2012; Collevatti et al., 2013; Prieto-Torres et al., 2016; Silva et al., 2019).
Previous studies in Mesoamerican ecosystems had also shown a widespread reduction of current potential species richness due to an increase in temperature and a decrease in precipitation as consequences of climate change (Golicher et al., 2012). Thus, it seems plausible that NSDF species will be pushed toward higher elevations, where humidity is the key limiting factor for biota (Meir and Pennington, 2011; Prieto-Torres and Rojas-Soto, 2016), to track their climatic niches. This is noticeably considering that in more than 92% of the cases, the suitability areas in the distributional patterns of species were related to four climate seasonality variables. The potential migrations to higher elevations could produce, consequently, local extinctions or drastic contractions in the distribution of habitat specialists (e.g., Plain chachalaca Ortalis poliocephala;Peterson et al., 2002), and species with small ranges such as the Yellow-lored Parrot Amazona xantholora (LC), the Cozumel emerald Chlorostilbon forficatus, the Gundlach's Hawk Accipiter gundlachi (EN), the Blue-headed Quail-dove Starnoenas cyanocephala (EN), and the Cozumel Thrasher Toxostoma guttatum (CR) as detected herein. This scenario could, consequently, produce the conformation of novel biotic communities with new ecological properties (Peterson et al., 2002; Walther, 2010; Golicher et al., 2012; Prieto-Torres et al., 2016; Zwiener et al., 2018). Therefore, the main lesson emerging from our results is that undoubtedly the climate change, in addition to current deforestation rates, must be considered as a major threat to NSDF’s biodiversity (Reynolds et al., 2007; Collevatti et al., 2013; Prieto-Torres et al., 2016; Silva et al., 2019).
Climate change not only could promote a negative effect in taxonomic composition of NSDF’ communities, but at same time it may modify a wide range of attributes like phylogenetic structure and the structure of functional groups within those communities (see Hidasi-Neto et al., 2019), therefore increasing the alteration in the function of ecosystems and the biodiversity extinction risk at both local and regional scales (Root et al., 2003; Opdam and Wascher, 2004; Reynolds et al., 2007; Clavel et al., 2011; Zwiener et al., 2018; Hidasi-Neto et al., 2019; Lovejoy and Hannah, 2019). For instance, because of distribution shifts for bird species, negative cascade effects on plant-animal interactions (including pollinators and seed dispersers) may be expected (Hegland et al., 2009; Pauw, 2019), disturbing the ecological integrity of ecosystems. Therefore, it will be interesting to carry out studies about phylogenetic and functional diversities to analyze whether the change in species composition between communities also cause simultaneous changes the functional structure of species communities within the landscape (see Hidasi-Neto et al., 2019).
Despite that NSDF average bird species richness is expected to decrease in the near future, we also observed that both overall beta diversity and dissimilarity values will increase under future climatic scenarios for the entire species assemblage. This pattern agrees with the heterogenization (i.e., biotic differentiation) hypothesis, which is mainly explained by the reduction (accentuated in more severe climate change and not-dispersal scenarios) of most species’ range sizes (Olden and Poff, 2003). From this perspective, climate change will increase the taxonomic dissimilarity and their levels of geographically restricted species (presently up to 23%; Prieto-Torres et al., 2019b) among NSDF regions, further highlighting their taxonomic uniqueness and conservation relevance. These results coincide with trends predicted by Menéndez-Guerrero et al. (2019) and Medina et al. (Unpublished) for Neotropical anuran biodiversity, where distributional changes within species of this group are likely to increase also promoting biotic heterogeneity at elevations below 1,500 masl ––encompassing the altitudinal distribution range of NSDF (Portillo-Quintero and Sánchez-Azofeifa, 2010).
Notwithstanding, considering that NSDF’s avifauna showed a dominance pattern of small-range sizes, it is important to note that this increase in biotic differentiation could be the beginning of a future homogenization process, because range contractions will increase the likelihood of complete extinction both locally and regionally (Olden and Poff, 2003). In fact, at local scales we observed that several NSDF region experienced homogenization process, such was the case for bird assemblages across the Caribbean islands, northwesternmost Mexico, and lowland areas (the Guajira province and savannahs) from the Caribbean coast of Colombia and Venezuela (Figs. 2 and 3 [green grids]). A plausible explanation for these results of homogenization process could be that species turnover pattern in the avifauna under future climate scenario will be led by invasion of widely distributed species (likely adapted to the conditions in the regions) in synergy with local extinction of narrowly distributed species (Zwiener et al., 2018; Silva et al., 2019; Hidasi-Neto et al., 2019). From this perspective, real differences between species ––such as body size, home range, clutch size and/or fecundity (e.g., Blackburn and Gaston, 1994; Gaston and Blackburn, 1995; Ortega et al., 2019) –– could be important attributes to assess in relation with the observed variance in species-range size change under future climate scenarios. As our results show and considering the species-specific responses, climate change could be a potential driver of uneven modification of richness patterns of species assemblages for avifauna among the NSDF regions across space and time (Prieto-Torres et al., 2016; Hidasi-Neto et al., 2019; Lovejoy and Hannah, 2019); rejecting any hypothesis of a stable beta diversity for NSDF (e.g., Sinclair et al., 2010; Ochoa-Ochoa et al., 2012; Collevatti et al., 2013).
Assumptions regarding dispersal ability and its importanceOur study documents exposure to climate change for a full species-rich clade across the northern NSDF, and concomitantly evaluates the effects of dispersal scenarios. This is very important because recent studies indicate that effect of adaptation for species under future climate scenarios may be limited (Cotto et al., 2017; Peterson et al., 2018; Diniz-Filho et al., 2009; Ortega et al., 2019), and thus ENM forecasting could to overestimating the general patterns associated to biodiversity (Araújo et al., 2019). Herein, and despite that contiguous dispersal (favorable) scenario assumes that species (including specialists) track their optimum climatic conditions, we observed that the overall geographic change pattern of beta diversity remained concordant regardless climates and dispersal scenarios, across NSDF regions and even within the current PAs (Tables 1 and 2). This fact allows us to reduce the uncertainties on forecasting for effects of human-induced global warming. Likewise, such change in biodiversity patterns confirmed the idea that global climate change implies a threat for conservation of birds in this fragile ecosystem. From this perspective, by expanding the future consequences of climate change for all biodiversity levels in these ecological communities, our results represent an important step to guide future ecological studies and efficient decisions in conservation areas (see Peterson et al., 2018; Araújo et al., 2019) aimed at maximizing the protection of the NSDF diversity.
However, it is important to note that our estimates of variation in range shifts are likely to be conservative. This is especially important considering that comparisons among bioclimatic databases (e.g., Worldclim 1.4, Worldclim 2.0, and CHELSEA) show important variations in climate from 1990 to the present (see Fick and Hijmans, 2017; Karger et al., 2017), and that on average ∼26% of unique species/locality combinations (not used for analyses) corresponded to mismatch spatial-temporal records (i.e., potential new climatic conditions) based on the time range considered herein for the present. Thus, additional sources of variation, as the presence of novel climates (not evaluated here) for the species distribution, should be considered in future research in order to provide information about their potential adaptation to future climate changes (Peterson et al., 2002; Feeley et al., 2012; Araújo et al., 2019; Silva et al., 2019). In fact, it is very difficult to predict how species will respond to climates that do not exist at present because the species’ adaptive potential is determined by its own evolutionary rate and ability to respond to rapid environmental change ––which depends directly on factors such as geographic range size, dispersal ability, reproductive rates, and degree of specialization of habitat requirements–– in a relatively short period of time (Peterson et al., 2002; Root et al., 2003; Feeley et al., 2012; Ortega et al., 2019; Silva et al., 2019). Therefore, more studies analyzing alternative hypotheses to the niche conservatism for species are needed in order to measure this variation and, if possible, increase our understanding about dynamic responses of species and their adaptation for future climate change (Peterson et al., 2018; Araújo et al., 2019). For this, the development and implementation of monitoring programs is essential to evaluate how bird communities and species distributions respond to environmental changes, especially in zones that are forecast (Figs. 2 and 3) to suffer the most drastic decreases.
Conservation implication and final considerationsNotwithstanding that existing PAs network provides an invaluable service in protecting NSDF, our analysis demonstrates that these areas are not exempt of suffering such changes in biodiversity organization. The expected changes in avifaunal diversity observed herein highlight the challenges that climate change imposes to current conservation policies and decisions, justifying the need for defining priority areas for the long-term conservation of NSDF (Prieto-Torres et al., 2018; Triviño et al., 2018). This is very important considering that current representativeness of NSDF’s avifauna within PAs network are woefully inadequate (see Prieto-Torres et al., 2018). Interestingly, considering only the contiguous dispersal (favorable) scenario, we observed that regional extinctions were not only due to threatened species disappearance, but also to DD and LC species. Thus, the increase of available habitat for species, and ensuring the existence of suitable pathways for species dispersal by upgrading PAs under this dynamic approach considering future scenarios, represent a likely effective strategy to reduce the negative impacts of climate change (see Hannah et al., 2007; Prieto-Torres et al., 2016; Triviño et al., 2018). From this perspective, studies like this one are needed to visualize and respond proactively to the new conservation challenges in the context of future climates.
We recognized that an important limitation in our study is that analyses of beta diversity were performed considering only climate variation in the distributional pattern of species. Habitat fragmentation and degradation are considered the principal causes of current biodiversity declines and the NSDF have been historically threatened by chronic anthropogenic disturbances (Miles et al., 2006; Portillo-Quintero and Sánchez-Azofeifa, 2010), which would likely produce species extinction or greater range reductions and likely in synergy with climate change would alter more negative and severely than anticipated, playing an important role as drivers of biotic homogenization (Prieto-Torres et al., 2016; Vázquez-Reyes et al., 2017; Zwiener et al., 2018; Hidasi-Neto et al., 2019). Therefore, future research must be directed to generate additional information along these lines to improve the information of ecosystems for their sustainable management and protection.
Clearly, the task ahead is as urgent as it is challenging, as much biodiversity remains unprotected. Failure to protect each of the NSDF regions would result in major losses of unique species diversity and evolutionary history (Banda et al., 2016; Prieto-Torres et al., 2018, 2019b). Considering this scenario, the success of conservation strategies in threatened ecosystem such as NSDF will depend on the explicit recognition and understanding of patterns and drivers of the biodiversity crisis across spatio-temporal scales (Prieto-Torres et al., 2016; Zwiener et al., 2018; Lovejoy and Hannah, 2019; Silva et al., 2019). Therefore, we encourage future researchers to perform studies that combine forecasts of species range shifts, including their taxonomic, phylogenetic, and functional diversity patterns (see Hidasi-Neto et al., 2019), along with systematic conservation planning tools and land-use change and costs (see Hannah et al., 2007; Triviño et al., 2018). This integrative analysis approach undoubtedly could allow us to complement the current PAs networks for the establishment of new and effective long-term conservation efforts in NSDF.
Competing interests statementThe authors declare no conflicts of interest.
Data availability statementThe authors confirm that the data supporting the findings of this study are available within the article [and/or] its supplementary materials. Interested readers to other material could to request them from the corresponding author [DAP-T].
Author contributionsDAP-T and AGNS conceived and designed the study. DAP-T compiled the database of available records and performed the ecological niche models. DAP-T and ALN developed the spatial and statistical analyses. All authors contributed in the analysis and interpretation of results, and in the writing of the manuscript.
FundingThis work was supported by Universidad Nacional Autónoma de México (UNAM) under a Postdoctoral scholarship grant assigned to DAP-T. Financial support was also obtained from the CONABIO project JM071, the CONACyT project 152060, the Rufford Foundation projects: 16017-1 and 20284-2, and Idea Wild.
We appreciate the efforts of museums (see Appendix S1) and their curators, as well as of the field collectors and institutions that made our study possible. The first author (DAP-T) extends his gratitude to the Universidad Nacional Autónoma de México (Dirección General de Asuntos del Personal Académico, DGAPA-UNAM, México) for the Postdoctoral scholarship that allowed to perform this work. The Rufford Foundation DAP-T 16017-1; DAP-T 20284-2, Idea Wild, the CONACyT project 152060 (AGNS), and the CONABIO project JM071 (AGNS) provided financial and logistical support for this project. Alejandro Gordillo and Daniela M. Hernández helped with the downloading and georeferencing bird locality data. We appreciate comments and logistic support in statistical analyses provided by Luis Sánchez-González, Luis Osorio-Olvera and Marco Ortiz-Ramírez during this study.
The following are Supplementary data to this article:

