


Biodiversity inventories are well acknowledged as key to conservation planning. One widely used method for sampling terrestrial fauna is traps with drift fences. Such drift fences, however, may be configured in several arrays, varying the height, length of the fence, space between conjugated traps (e.g., buckets or funnels), and it can be arranged in linear (I) or radial (Y) formats. Consequently, some criticism arose questioning which drift fence arrangement should be employed. Therefore, we made use of geometrical models to test the probability of capturing terrestrial tetrapods (as model organisms) using traps associated along with both I and Y drift fence arrays. With distances varying from 8 to 100m from the fence, the capturing rate of the I format was in average 1.16 times higher than the Y format. Besides this, we also present data that may enable field ecologists to better decide the minimum distance between two traps with drift fences, ensuring accurate statistics. Correct decisions in ecological and management studies may prevent wastes and fundament efficient conservation policies.
Potential degradation of ecosystems is generally recognized by overall effects on community-level attributes such as species richness and diversity (Conroy and Carroll, 2009). Such studies are central to the discipline of conservation biology and may be related, for example, to land-use planning, habitat destruction, intensive agriculture, overgrazing, urbanization, pollution, climate change, or introduced diseases and competitors (Sutherland, 2000; Magnusson et al., 2004; Conroy and Carroll, 2009).
Therefore, several sampling methods have been developed in order to best access local wildlife diversity. Depending on the organism size and ecology, different traps are used (Corn, 1994; Sutherland, 2000). Sometimes, for the same group of organism, such as terrestrial vertebrates, or a specific taxonomic group as rodents, different methods are available with different capturing rates and costs (Greenberg et al., 1994; Enge, 2001; Umetsu et al., 2006; Sabu and Shiju, 2010). If different methods provide different capturing rates, than, conservation action plans, which are greatly based on diversity estimations (Conroy and Carroll, 2009), should be based on highly efficient biodiversity inventories or monitoring. Hence, choosing the best sampling method will ultimately benefit wildlife conservation.
A worldwide and recurrent sampling array is composed of traps, such as pitfalls or funnels, in conjunction with drift fences (Corn, 1994; Sutherland, 2000). These traps are acknowledged as one of the most effective sampling method, awarding several advantages: it is standardized, independent of the researcher experience, cheap, and easily replicable between sites over time and studies (Corn, 1994). These are used to sample terrestrial invertebrates and vertebrates (Bury and Corn, 1987; Corn, 1994; Ashton, 2005; Diffendorfer et al., 2005; Cortez et al., 2009), such as small mammals (Szaro et al., 1988; Umetsu et al., 2006) and arthropods, mainly insects and arachnids (Sabu and Shiju, 2010; Work et al., 2002). Besides its broad taxonomic applicability, it also is diverse in the types of studies that could be conducted, from faunal inventories (Andreone et al., 2003; Cortez et al., 2009; Dixo and Verdade, 2006) to monitoring programs (Diffendorfer et al., 2005; Guarino et al., 2003), including comparisons between populations (Dixo et al., 2009), species abundance and richness analyses (Cechin and Martins, 2000; Vogt et al., 2007; Ribeiro-Júnior et al., 2011), life-cycle determination (Leclair et al., 2005; Santos and Grant, 2011), and migration (Johnson, 2003; Becker et al., 2008; Santos and Grant, 2011). Therefore, it is generally a primary method widely applied that fundaments conservation policy in a global scale.
However, the efficiency of such traps may be influenced by several factors, sometimes hard (or even impossible) to isolate in field experiments. For example, its efficiency may vary along with species-specific characteristics, such as behavioral ecology, seasonality, circadian cycles, habitat preferences, and individual size (e.g., Cechin and Martins, 2000; Szaro et al., 1988). Besides this, extrinsic factors may also influence the capturing rates, such as topography, weather condition, distance from water bodies, and forest coverage. Furthermore, it has been demonstrated that the size of the bucket (in the case of pitfall traps), the presence and height of drift fences, and presence of associated shelters may enhance or reduce the capturing rates (e.g., Szaro et al., 1988; Cechin and Martins, 2000; Work et al., 2002; Sabu and Shiju, 2010). Adding to this variation, animal traps arrays can vary in the arrangement of its drift fences; most commonly it can be installed as a line (I) or in a radial (Y) format (Fig. 1). Choosing between I and Y is generally personal, relaying on researchers preferences.
 and radial (below). In both cases, there are traps (black circles) interspaced by five meters along with the drift fence.")
Furthermore, such decision could be mandatory. For example, in Brazil the national government may dictate a preferred format (without any underlying theoretical basis) for inventories, such as the one known as RAPELD (Magnusson et al., 2004), dedicated to obligatory environmental assessments (L.F. Toledo personal obs.).
Besides the trap format, the distance between two trap sets vary (again based on personal suggestions) between studies. For active-surface invertebrates the inter-trap spacing generally sets between 1 and 10m (e.g., Wang et al., 2001; Ward et al., 2001), and for terrestrial tetrapods from 10 to, generally, at least a 100m (e.g., Spurr and Powlesland, 2000; Vogt et al., 2007; Lettink et al., 2011). Although it is acknowledged that the inter-trap distance influences on the capturing rates, where greater inter-trap spacing improves richness sampling (Ward et al., 2001; Perner and Schueler, 2004), there isn’t available data indicating which minimum distance threshold should be followed. This is relevant as long as a proper minimum distance between traps should be established in order to assure independence of data (Conroy and Carroll, 2009). Hence, if these two arbitrary decisions (the array configuration and the inter-trap distance) impact the results, the final conservation decisions will be biased.
Under such context, we hereby provide geometrical models testing the hypothesis that the I format provides higher capturing probability than the Y format, as we suggest based on at least one previous empirical field study (Ribeiro-Júnior et al., 2011), and, based on modeled comparisons, provide data that can help determining a minimum independent inter-trap distance. These methodological approach aims offering theoretical data that could lead to better biodiversity sampling, improving those conservation actions based on species richness/abundance datasets.
Materials and methodsWe modeled the two different drift fence formats, based on a drift fence with four traps (e.g., buckets, funnels, Sherman traps) interspaced in 5m (Fig. 1). This is a typical setup for tetrapod's oriented studies (e.g., Vogt et al., 2007). For the model development, we assume that all animals move exclusively in straight-line directions (with the same probability to any direction) and that all the animals that move toward the fence directions will be captured. Models were developed in the software Wolfram Mathematica 8.0.
We included in the model the distance of the animal from the drift fence. This distance was a radius (R) from the middle of the trap and could be extrapolated for equivalent initial positions, such that in the case of the linear fence format (Fig. 2A) animals in a given initial position in the dashed side of the figure had the same probability of being trapped as another animal in the exact opposite side of the circle. In the case of the radial fence format (Fig. 2B) the circle can be divided into three zones with equal probabilities. The probability of being captured decreases as the R increases. The maximum probability of being captured is 50% if R is 0 (zero) as the animal can move toward or away from the trap. If R>0 the animal can either move away from the circle (50% chance) or move inside the circle (50% chance). Inside the circumference there are some angles that will lead to capture. These were the angles used for calculating the probability of being captured.
 defined for the models calculation related to linear (A) and radial drift fence arrays (B). The circle represents a range with a radius of 10m from the center of the fence, considering four animal traps (e.g., pitfalls) and fivem of drift fences (a) connecting traps.")
If the animal is in the point p, the entrance angle will be defined as θ, measured in the anticlockwise direction, between the tangent line to the circumference in the point p and the given entrance direction. The only relevant angles are between 0 and π, as other angles indicate that the animal is moving away from the trap capturing area. θi is the minimum (initial) angle and θf is the maximum (final) angle including the possible lines that will lead the animal to the trap. Therefore, the probability of being captured of an animal that enters the circle in the point p is:
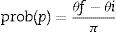
In order to estimate the drift fence efficacy we calculated the weighted mean of the punctual probabilities across the circumference integrating the function prob (p) in the circle C. As the center of the drift fence is the origin of R, we could parameterize the circle of radius R around the drift fence, using t as a parameter, as:

The calculation of prob(p(t)) depends on each region p(t) (Fig. 2). Essentially, there are two types of regions for the expressions (Fig. 2).
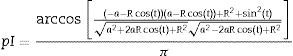
Although we have the analytical expressions for the prob(p), they are extremely complex to be integrated. Therefore, we used numerical integration. For the calculation of the probability of capturing animals of I drift fence format pI, considering a 2a length of drift fence we obtained:
Assuming that the drift fence measures 3a we obtained the following expressions for the probability of capturing animals with Y drift fence array, pY:
where pY1 is the capturing probability of the region 1 and pY2 is the capturing probability of region 2 as illustrated in Fig. 2. We estimated and compared the capturing probabilities of both drift fence formats varying from 8 to 100m from the fence, a distance compatible to those used for studies with terrestrial tetrapods (e.g., Spurr and Powlesland, 2000; Vogt et al., 2007; Lettink et al., 2011). Finally, we make use of some studies to test the models (Table 1). These studies were selected as they were focused on terrestrial vertebrates and provided the information of the trap array.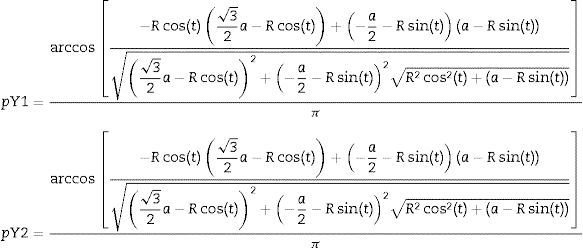
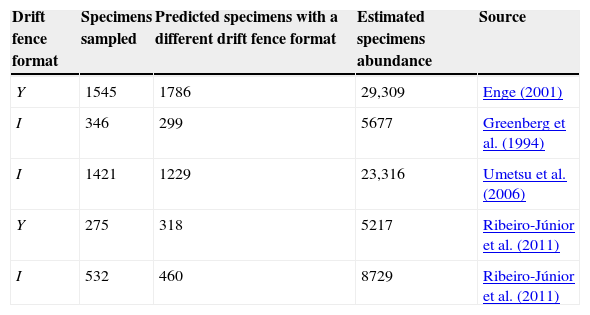
Number of captured specimens by pitfall traps with I and Y drift fences (based on literature), number of predicted specimens to be captured if the authors used a different drift fence configuration, and estimated specimens abundance, based on our models considering R=50m. For the study of Ribeiro-Júnior et al. (2011) we considered the total values for amphibians.
| Drift fence format | Specimens sampled | Predicted specimens with a different drift fence format | Estimated specimens abundance | Source |
|---|---|---|---|---|
| Y | 1545 | 1786 | 29,309 | Enge (2001) |
| I | 346 | 299 | 5677 | Greenberg et al. (1994) |
| I | 1421 | 1229 | 23,316 | Umetsu et al. (2006) |
| Y | 275 | 318 | 5217 | Ribeiro-Júnior et al. (2011) |
| I | 532 | 460 | 8729 | Ribeiro-Júnior et al. (2011) |
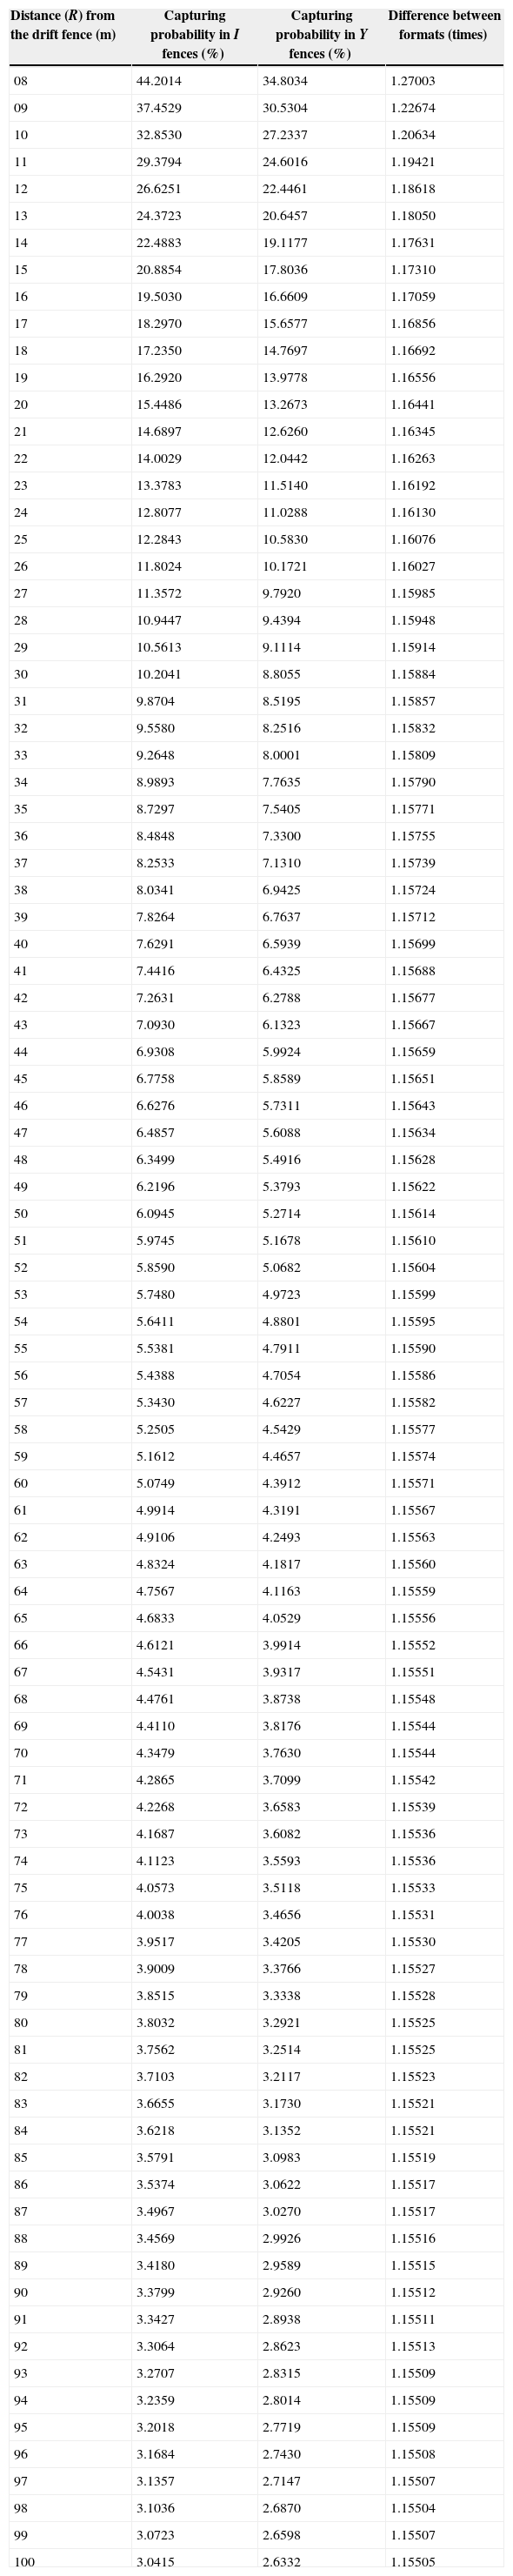
The capturing efficiency of the I format drift fence was in average 1.16 times higher than the Y format drift fence, independently of the distance of the animal from the drift fence (R between 8 and 100m). With the increase of R the capturing probability decreases in the proportion of 1.019 times each meter. For example, at 20m from the drift fence, the estimated probability of being captured is about 15% and 13% in I and Y drift fence formats, respectively; at 100m from the drift fence, the estimated probability of being captured is about 3.4% and 2.6% in I and Y drift fence formats, respectively (Fig. 3).
Discussion
The predicted models corroborated the hypothesis that I is better than Y. This may impact future methodological decisions (choosing I instead of Y formats), as ecologists and conservation scientists seek for increasing sample sizes in order to better test their hypotheses and effectively implement conservation strategies. On the other hand, prior to accept this model, we acknowledge that further tests could corroborate our predictions. There is already one empirical test showing that I pitfall traps with drift fences tend to be more efficient than Y drift fences (Ribeiro-Júnior et al., 2011). Ribeiro-Júnior et al. (2011) reported that the I drift fences were on average 1.35 times more efficient than Y drift fences, which was similar to our findings of an average 1.16 times greater capture rate by the I array compared to the Y arrays. Therefore, both studies not only corroborate in suggesting the most efficient drift fence format, but also they are similar in the extent of the differences. In spite of lack of significant results (t-pared test P=0.06; reanalyzed data), Ribeiro-Júnior et al. (2011) results showed that in 9 out of 12 cases the I format captured more individuals than the Y format, and that I traps captured 768 individual whereas the Y ones captured 472 individuals. Therefore, they provided empirical data suggesting that the I format may have a higher probability of capturing terrestrial vertebrates. Such difference could be considered not robust if the sample size is small, for example, in a short-term study. However, if the study is a long-term monitoring, these differences could impact deeply the results – both providing a higher richness values to the area that used the I format, and providing a larger number of captured animals, which in turn could improve the analyzes statistical power.
If different drift fence formats present different capturing rates, the comparisons between sampling methods (e.g., Greenberg et al., 1994; Enge, 2001; Umetsu et al., 2006; Sabu and Shiju, 2010) may be incomplete or biased (if you compare an I against an Y array). Even comparisons between different sites or studies may be biased. That is, if one study installed a I drift fence format and the other a Y drift fence format, the results may not be directly comparable, without values correction. The models we developed can provide such correction factor, adjusting specimens’ abundance among studies that employed different drift fence arrays (see examples in Table 1).
Furthermore, if the study provides a rarefaction curve, relating the number of individuals sampled with the number of species registered, it is possible also to apply our model as a species richness index. For example, Gardner et al. (2007) using a Y drift fence array (and other associated methods), registered 18 leaf litter amphibian species when they reached 200 individuals sampled. If they used a I drift fence array they would have sampled (based on our models) 231 individuals, including at least one more species (S=19) in their sample. Therefore, a different richness value could be estimated based on this absolute abundance index.
Finally, as the model predicts, capturing probability decreases with an increased distance of the animal from the drift fence. The probability of being captured in the model is infinite; i.e., there is no distance in which the probability of being captured is equal to zero. Therefore, two traps with drift fences could, theoretically, never be absolutely independent. Actually, in natural conditions this is not truth, among many possibilities, due to: animal vagility (animals do not move infinite distances), behavior (facing the drift fences, some animals may change directions), geographical barriers (restricting animal movement), and ecological restrictions (animals do not necessarily move across all available areas within a site). However, independence decisions could be made based on a pre-defined threshold. For example, if a 5% probability of capturing is considered a satisfactory independence threshold, and terrestrial vertebrates is the target taxon, a I drift fence array must be at least 60m from each other and Y drift fence arrays must be 52m from each other (Appendix A). Also, we highlight that these distances vary with the target animal groups or individual species. For example, large snakes and lizards may cover a larger range than small frogs. Territorial vipers would move less than cursorial colubrid snakes. Small flightless arthropods and rodents are also not comparable in vagility and home range (Roshier et al., 2008; Alcock, 2013; Hillman et al., 2014). Furthermore, the size and presence of drift fences may also influence in the capturing probabilities (e.g., Cechin and Martins, 2000). As a result, we expect that in the near future this model could be improved adding more variables, both from drift fence morphology, and those from the environment and from target species natural history. In spite of that, we provided theoretical data that can lead to improvements in a daily and widespread sampling method. Assuring statistical rigor, enhancing sampling efficiency, and providing comparable datasets will strengthen the current and future knowledge of natural systems, which, ultimately, will improve worldwide conservation policies.
Conflicts of interestThe authors declare no conflicts of interest.
Fundação de Amparo à Pesquisa do Estado de São Paulo (FAPESP) and Conselho Nacional de Desenvolvimento Científico e Tecnológico (CNPq) provided grants (FAPESP 2008/50325-5; 2011/51694-7; CNPq 405285/2013-2) and fellowships (FAPESP 2008/52847-9; CNPq 302589/2013-9) to LFT.
| Distance (R) from the drift fence (m) | Capturing probability in I fences (%) | Capturing probability in Y fences (%) | Difference between formats (times) |
|---|---|---|---|
| 08 | 44.2014 | 34.8034 | 1.27003 |
| 09 | 37.4529 | 30.5304 | 1.22674 |
| 10 | 32.8530 | 27.2337 | 1.20634 |
| 11 | 29.3794 | 24.6016 | 1.19421 |
| 12 | 26.6251 | 22.4461 | 1.18618 |
| 13 | 24.3723 | 20.6457 | 1.18050 |
| 14 | 22.4883 | 19.1177 | 1.17631 |
| 15 | 20.8854 | 17.8036 | 1.17310 |
| 16 | 19.5030 | 16.6609 | 1.17059 |
| 17 | 18.2970 | 15.6577 | 1.16856 |
| 18 | 17.2350 | 14.7697 | 1.16692 |
| 19 | 16.2920 | 13.9778 | 1.16556 |
| 20 | 15.4486 | 13.2673 | 1.16441 |
| 21 | 14.6897 | 12.6260 | 1.16345 |
| 22 | 14.0029 | 12.0442 | 1.16263 |
| 23 | 13.3783 | 11.5140 | 1.16192 |
| 24 | 12.8077 | 11.0288 | 1.16130 |
| 25 | 12.2843 | 10.5830 | 1.16076 |
| 26 | 11.8024 | 10.1721 | 1.16027 |
| 27 | 11.3572 | 9.7920 | 1.15985 |
| 28 | 10.9447 | 9.4394 | 1.15948 |
| 29 | 10.5613 | 9.1114 | 1.15914 |
| 30 | 10.2041 | 8.8055 | 1.15884 |
| 31 | 9.8704 | 8.5195 | 1.15857 |
| 32 | 9.5580 | 8.2516 | 1.15832 |
| 33 | 9.2648 | 8.0001 | 1.15809 |
| 34 | 8.9893 | 7.7635 | 1.15790 |
| 35 | 8.7297 | 7.5405 | 1.15771 |
| 36 | 8.4848 | 7.3300 | 1.15755 |
| 37 | 8.2533 | 7.1310 | 1.15739 |
| 38 | 8.0341 | 6.9425 | 1.15724 |
| 39 | 7.8264 | 6.7637 | 1.15712 |
| 40 | 7.6291 | 6.5939 | 1.15699 |
| 41 | 7.4416 | 6.4325 | 1.15688 |
| 42 | 7.2631 | 6.2788 | 1.15677 |
| 43 | 7.0930 | 6.1323 | 1.15667 |
| 44 | 6.9308 | 5.9924 | 1.15659 |
| 45 | 6.7758 | 5.8589 | 1.15651 |
| 46 | 6.6276 | 5.7311 | 1.15643 |
| 47 | 6.4857 | 5.6088 | 1.15634 |
| 48 | 6.3499 | 5.4916 | 1.15628 |
| 49 | 6.2196 | 5.3793 | 1.15622 |
| 50 | 6.0945 | 5.2714 | 1.15614 |
| 51 | 5.9745 | 5.1678 | 1.15610 |
| 52 | 5.8590 | 5.0682 | 1.15604 |
| 53 | 5.7480 | 4.9723 | 1.15599 |
| 54 | 5.6411 | 4.8801 | 1.15595 |
| 55 | 5.5381 | 4.7911 | 1.15590 |
| 56 | 5.4388 | 4.7054 | 1.15586 |
| 57 | 5.3430 | 4.6227 | 1.15582 |
| 58 | 5.2505 | 4.5429 | 1.15577 |
| 59 | 5.1612 | 4.4657 | 1.15574 |
| 60 | 5.0749 | 4.3912 | 1.15571 |
| 61 | 4.9914 | 4.3191 | 1.15567 |
| 62 | 4.9106 | 4.2493 | 1.15563 |
| 63 | 4.8324 | 4.1817 | 1.15560 |
| 64 | 4.7567 | 4.1163 | 1.15559 |
| 65 | 4.6833 | 4.0529 | 1.15556 |
| 66 | 4.6121 | 3.9914 | 1.15552 |
| 67 | 4.5431 | 3.9317 | 1.15551 |
| 68 | 4.4761 | 3.8738 | 1.15548 |
| 69 | 4.4110 | 3.8176 | 1.15544 |
| 70 | 4.3479 | 3.7630 | 1.15544 |
| 71 | 4.2865 | 3.7099 | 1.15542 |
| 72 | 4.2268 | 3.6583 | 1.15539 |
| 73 | 4.1687 | 3.6082 | 1.15536 |
| 74 | 4.1123 | 3.5593 | 1.15536 |
| 75 | 4.0573 | 3.5118 | 1.15533 |
| 76 | 4.0038 | 3.4656 | 1.15531 |
| 77 | 3.9517 | 3.4205 | 1.15530 |
| 78 | 3.9009 | 3.3766 | 1.15527 |
| 79 | 3.8515 | 3.3338 | 1.15528 |
| 80 | 3.8032 | 3.2921 | 1.15525 |
| 81 | 3.7562 | 3.2514 | 1.15525 |
| 82 | 3.7103 | 3.2117 | 1.15523 |
| 83 | 3.6655 | 3.1730 | 1.15521 |
| 84 | 3.6218 | 3.1352 | 1.15521 |
| 85 | 3.5791 | 3.0983 | 1.15519 |
| 86 | 3.5374 | 3.0622 | 1.15517 |
| 87 | 3.4967 | 3.0270 | 1.15517 |
| 88 | 3.4569 | 2.9926 | 1.15516 |
| 89 | 3.4180 | 2.9589 | 1.15515 |
| 90 | 3.3799 | 2.9260 | 1.15512 |
| 91 | 3.3427 | 2.8938 | 1.15511 |
| 92 | 3.3064 | 2.8623 | 1.15513 |
| 93 | 3.2707 | 2.8315 | 1.15509 |
| 94 | 3.2359 | 2.8014 | 1.15509 |
| 95 | 3.2018 | 2.7719 | 1.15509 |
| 96 | 3.1684 | 2.7430 | 1.15508 |
| 97 | 3.1357 | 2.7147 | 1.15507 |
| 98 | 3.1036 | 2.6870 | 1.15504 |
| 99 | 3.0723 | 2.6598 | 1.15507 |
| 100 | 3.0415 | 2.6332 | 1.15505 |

