


Forest cover changes are influenced by socioeconomic and biophysical dynamics. However, the relative importance of both social and biophysical factors to forest loss and gain remains in debate. Previous research has focused mainly in identifying determinants of deforestation, while less is known regarding forest regrowth, especially in tropical forests. Here we investigated the spatial pattern and determinants of forest cover changes within a landscape which is representative of the biophysical and socioeconomic conditions found in the Atlantic Forest, and also presents an exceptional conservation value within this global biodiversity hotspot. Events of deforestation and regrowth were identified by comparing land cover maps from aerial images taken in 1975 and 2010. We controlled the spatial autocorrelation among events and used a machine learning algorithm and a selection model approach to build linear models explaining forest loss and gain. Main determinants of both forest loss and gain were biophysical factors, although some of they may also reflect socioeconomic underlying processes. Distance from Strictly Protected Areas (SPAs) was the single socioeconomic determinant important to forest change, in loss events. Both deforestation and forest regrowth were strongly associated with forest edges. Deforestation occurred more intensively on concave or flat areas, low solar radiation conditions, near forests, and far from SPAs. Diversely, forest regrowth occurred mostly in high slopes, low elevation areas, high solar radiation and near to forest edges. Our findings reinforce the important role of topography and protected area on forest change, and highlight edge zones are “hotspots” of forest cover dynamics. .
Land use cover changes such as the conversion of forests to agricultural and pasture lands threaten biodiversity conservation, carbon sequestration, and the maintenance of global environmental services (Lambin and Meyfroidt, 2011; Li et al., 2017; FAO et al., 2021). Although forest cover continues to decrease all over the world (Kim et al., 2015; Hansen et al., 2013), an opposite tendency is occurring in a few places (Viña et al., 2016; Li et al., 2017). Such transformations from net loss to gain in forest cover occurred in many European and North American countries in the last century and more recently in developing economies in Asia and Latin-America (Rudel et al., 2005; Mather, 2007; Meyfroidt and Lambin, 2009). Even though studies on this topic are abundant, the causes of forest cover changes are still in debate (Rosa et al., 2015; Dlamini, 2016; Rudel et al., 2019; Molinario et al., 2020). Because net changes in forest cover results from the balance between deforestation and forest regrowth, understanding the causes of forest cover change requires identifying drivers of both forest loss and gain.
Previous research on the drivers of tropical forest cover change have focused mainly on identifying factors that influence loss of forest cover (e.g. Bawa and Dayanandan, 1997; Geist and Lambin, 2002). Deforestation has been shown to be associated with both biophysical and socioeconomic factors (Bhattarai et al., 2009; Gao and Liu, 2012; Mon et al., 2012; Du et al., 2014), although their relative importance remains unclear (Geist and Lambin, 2002; Phompila et al., 2017). Drivers of forest regrowth are less understood but are receiving increasing attention due to the potential of natural regrowth to help achieve large-scale restoration goals (e.g. Crouzeilles et al., 2021). Nonetheless, few studies have attempted to simultaneously identify determinants of forest cover loss and gain (e.g., Teixeira et al., 2009; Calaboni et al., 2018).
The most often determinants associated to forest cover gain are steeper slopes, areas close to forest remnants and protected areas, and far from population centers (Borda-Niño et al., 2019). Abandonment of lands is usually associated to forest gain (Nanni, 2019, Aide et al., 2019), in which socioeconomic changes act as underlying processes (Nanni, 2019), just like environmental policies incentivizes forest cover gain (Calaboni et al., 2018; Nanni, 2019). There are also factors associated to forest regrowth such as average annual rain, Gross Domestic Product, armed conflicts (Fagua et al., 2019).
Specially in the Atlantic Forest, deforestation uses to be associated to areas more suitable for agriculture and infrastructure expansion (Armenteras et al., 2017; Calaboni et al., 2018), whereas forest gain occurs mostly in less suitable areas (Calaboni et al., 2018). Other factors positively associated with deforestation are forest edge density, the length of roads and waterways, elevation and terrain; and negatively associated with distance to urban areas, roads, and indigenous lands, area designated as protected or indigenous territory, and Gross Domestic Product (Fagua et al., 2019; Jaffé et al., 2021).
The Atlantic Forest is one of the most important biodiversity hotspots on Earth due to its exceptionally high rates of species endemism and high degree of habitat loss (Myers et al., 2000; Mittermeier et al., 2005; Silva and Pontes, 2008; Figueiredo et al., 2022). Currently, less than 30% of the original forest cover remains (Rezende et al., 2018) and most remnants are small, isolated, and highly prone to edge effects (Ribeiro et al., 2009). A recent decrease in the deforestation rates of the Atlantic Forest (SOS Mata Atlântica and INPE, 2009, 2011, 2015, 2016, 2017) coupled with widespread forest natural regrowth (Crouzeilles et al., 2020), possibly indicate a tendency toward a forest transition in the biome (Lira et al., 2012; Rezende et al., 2015; Costa et al., 2017). Nevertheless, studies about forest cover dynamics are still scarce in the Atlantic Forest (e.g., Teixeira et al., 2009; Lira et al., 2012; Calaboni et al., 2018).
In this paper we investigated spatial patterns and local determinants (sensuMeyfroidt, 2016) of deforestation and forest regrowth within an Atlantic Forest landscape of exceptional conservation importance, the São João River Basin (SJRB). Specifically, we asked: What is the relative importance of environmental and socioeconomic factors for forest loss and gain? We hypothesize that distinct environmental and socioeconomic conditions determine the occurrence of deforestation and forest regrowth, while distance from forest edges determines both. To answer this question, we compared land cover maps from 1975 and 2010 to identify events of deforestation and forest regrowth and then employed a machine learning algorithm and a model selection approach to identify the environmental and socioeconomic drivers of deforestation and forest regrowth.
MethodsStudy areaThe São João River Basin (SJRB) is in Rio de Janeiro State, southeastern Brazil (Fig. 1). It covers an area of 2160 km² comprising coastal lowlands and coastal-facing slopes of the Serra do Mar Mountain range with a maximum elevation of approximately 1700 m above sea level. Annual precipitation ranges from 1300 mm in the São João river mouth to 2500 mm in the higher slopes of the Serra do Mar (Mello et al., 2008). Vegetation varies from seasonal forests in the coastal lowlands to cloud forests in the higher ridges (>1000 m), with typical rain forests covering the foothills and lower to mid-slopes. The SJRB is of high importance to the conservation of threatened birds and mammals, including the endangered collared-sloth (Bradypus torquatus) and the golden lion tamarin (Leontopithecus rosalia), whose distribution is almost entirely restricted to the SJRB (Jenkins et al., 2011; Kierulff et al., 2012; Tavares et al., 2015). The SJRB also presents a rich flora that includes at least 460 tree species belonging mainly to Leguminosae, Lauraceae, Myrtaceae, Euphorbiaceae, Moraceae, Annonaceae, Rubiaceae and Sapotaceae (Carvalho et al., 2008).

Land use and cover in the SJRB has changed markedly since the XVIII century, when extensive areas were deforested to allow the establishment of sugar cane plantations. Cattle grazing and timber extraction appeared next, and coffee plantations dominated the landscape in the XIX century (Mello et al., 2008). In the second half of the XX century the landscape of the SJRB was substantially altered due to the construction of several drainage channels in the alluvial plains and a dam in the São João river that created the Juturnaíba reservoir (Rocha and Neto, 2018). About 30% of the watershed area are covered by forest remnants, which are located predominantly at mid to high elevations (Mello et al., 2008; Seabra and Cruz, 2013). Additionally, Seabra and Cruz (2013) found that most of the unchanged landscape was maintained as pasture or agriculture from 1975 to 2010, while 21% of the watershed remained as conserved native forests since 1975.
Changes in forest coverTo assess forest cover changes in the SJRB we used maps of land cover and land use from aerial images taken in 1975 and 2010 (Seabra and Cruz, 2013). These maps were generated through object-based digital classification using Landsat 4 and Landsat 5 TM (2010) images. To perform analyses of deforestation and forest regrowth we considered only the classes forest and non-forest, meaning that land uses differing from forest were reclassified to the class non-forest (Fig. 2). For all maps, we used the spatial resolution of 30 meters and the SIRGAS 2000 UTM 23S projection.
 and 2010 (B).")
Changes in forest cover were assessed by verifying the difference between the final map (2010) and the initial map (1975), so that when a cell turned from forest to non-forest, this characterizes a deforestation event, and the opposite constitutes a forest regrowth event. We highlight that forest regrowth events analyzed in this work include only natural regrowth, since projects of active restoration (i.e. tree planting) in the SJRB started only in 1995, according to the Golden Lion Tamarin Association (Mello et al., 2008). We verified that these areas undergoing active restoration were not classified as forests in the 2010 map.
Variables and model selectionSpatial autocorrelation in the occurrence of deforestation/regrowth events was controlled through the Nearest Neighbor Mean function in ArcMap 10.3. According to the Nearest Neighbor function, the expected distance to avoid clustered events was 792.95 m (z-score = 22.803469, p < 0.001), and therefore distances higher than 800 m would result in a random spatial pattern for the events. We rarefied both deforestation and forest regrowth spatial events keeping only those further than 1000 m from any other event of the same type. This procedure resulted in the selection of 1022 sample points for forest regrowth, 1196 for deforestation, and 1200 for non-events.
Then we mapped for all selected pixels 58 biophysical and socioeconomic predictor variables that could potentially influence the occurrence of deforestation and/or forest regrowth events (Table S-1). Categorical variables with n states were decomposed into n-1 binary (i.e. dummy) variables. Correlation analysis was the first step to select variables among the first 58 to both deforestation and forest regrowth models. Eliminating highly correlated variables resulted in 46 potential predictor variables of deforestation events and 42 potential predictor variables of forest regrowth events. We calculated Pearson correlation coefficients using the “corrplot” package (Wei & Simko, 2016) in R 3.2.2 software (R Core Team, 2015) to eliminate highly correlated variables (r ≥ 0.7 and r ≤ −0.7). Then, we employed the Random Forest algorithm in the “randomForest” R package (Liaw and Wiener, 2002), more specifically, the Variable Importance Plot function to select the most important predictor variables for each forest cover change. At this point, we detected a break in both plots highlighting the importance of the first seven variables listed (Fig S-1). Because of that, we selected only those first seven variables for both deforestation and regrowth to the next step, which is the model selection approach. Then, we calculated the Akaike Information Criteria corrected (AICc) for small samples (Hurvich and Tsai, 1989) to compare all possible logistic Generalized Linear Models (GLM) for deforestation or forest regrowth events. Among all models with a ΔAICc ≤ 2, we selected the model with the highest parameter significance as indicated by the Z test. Finally, we calculated the Akaike weights (ωi) to identify within each model the predictor variables that more influenced the occurrence of forest loss or gain. We summarized the steps in Fig. 3.
Results
In 1975, forest cover in the watershed occupied 79,586.58 hectares, of which 28,145.79 were deforested till 2010 (312,731 pixels or events). Meanwhile, the watershed presented 132,197.52 hectares of non-forest cover in 1975, of which forests regenerated in 16,971.03 hectares (188,567 pixels or events) till 2010 (Fig. 4).

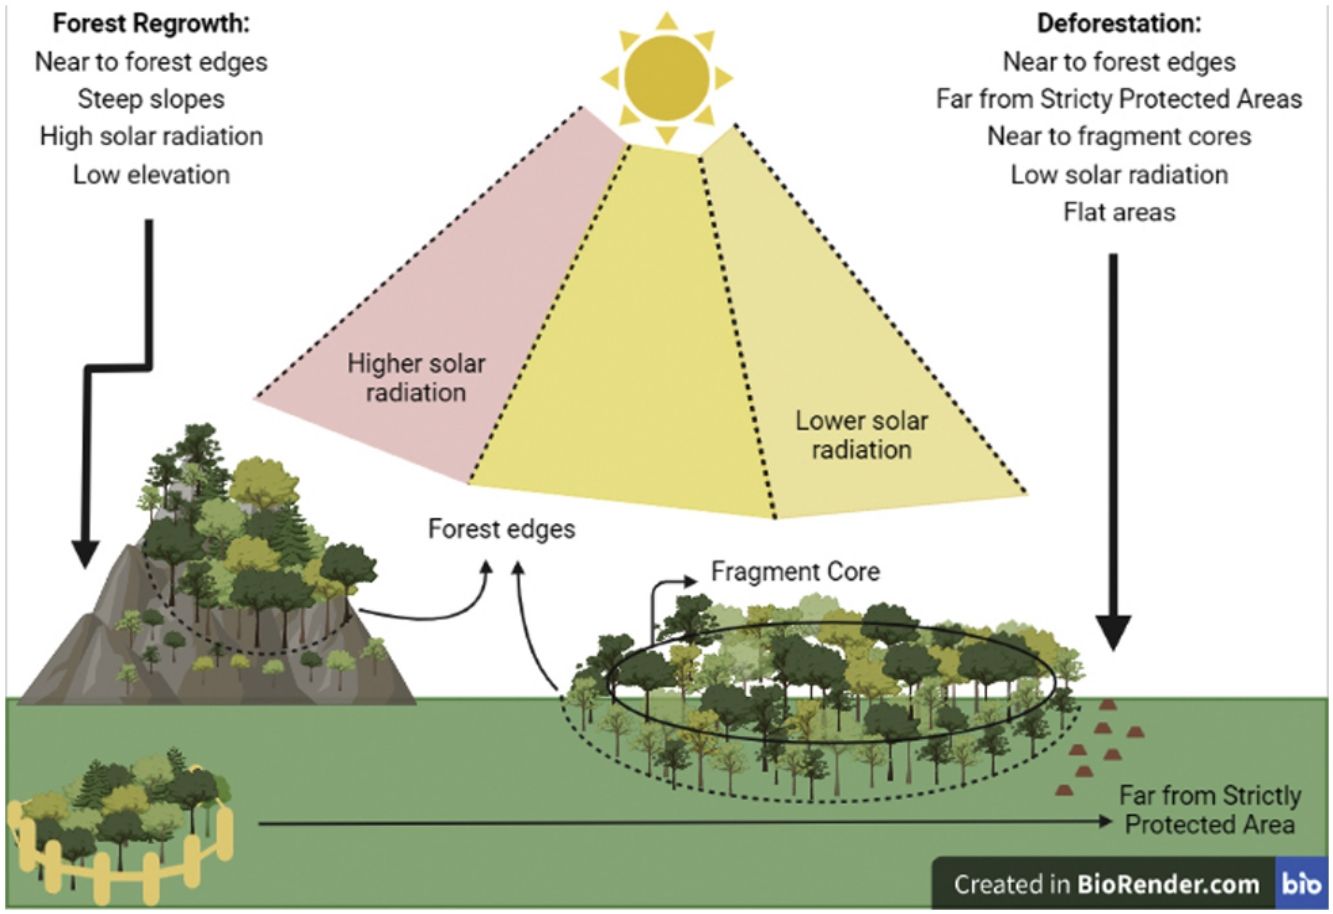
According to the model selection approach, deforestation was driven by distance to edges, Topographic Position Index (TPI), distance to core areas, solar radiation, and distance to Strictly Protected Areas. Distance to edges, distance to core areas, solar radiation, and TPI were inversely related to deforestation, while distance to Strictly Protected Areas was directly related. Therefore, deforestation occurs near forest edges, near fragment cores, in areas receiving low radiation, at flat areas (low TPI), and far from Strictly Protected Areas.
Concerning forest regrowth, the most important variables were distance to edges, slope, elevation, and solar radiation. Forest regrowth occurs near forest edges, in steep slopes, at lower elevations, and under higher solar radiation (Fig. S-3).
After that, we ran the Random Forest algorithm and its rank of variable importance indicated that the distance to forest edges in 1975 was the most important predictor of both deforestation and forest regrowth events (Fig. S-1).
Regarding deforestation, three out of 128 models with all possible combinations of variables predicting its events had ΔAICc ≤ 2 and therefore were equally plausible to explain the occurrence of deforestation in the SJRB (Table 1). The null model was clearly implausible (ΔAICc = 1020,8) and occupied the last position in the rank of all possible models. The plausible models contained similar variables. Variables weights were calculated by summing up Akaike weights for each model containing them (Table S-2). Despite the three plausible models were statistically similar, variables were more significant at the first, which was the lowest AICc deforestation model (Table S-3). According to the chosen model and the variable importance/weight, the best variables to explain the occurrence of deforestation were distance to edges, TPI, distance to cores, solar radiation, and distance to Strictly Protected Areas. All of them were inversely proportional to deforestation, except for distance to Strictly Protected Areas which was directly proportional (Fig. S-2). Thus, deforestation occurs mostly near to edges and cores, at lower TPI and solar radiation places, and far from Strictly Protected Areas. Elevation and distance to patches larger than 500 ha were not significant variables.
Plausible models explaining the occurrence of deforestation in the SJRB.
| Rank | Models | K | LogLike | AICc | ΔAICc | ωi |
|---|---|---|---|---|---|---|
| 1 | ∼DED + DCO + SOL + TPI + DSPA | 6 | −1145.3610 | 2302.7572 | 0.0000 | 0.3256 |
| 2 | ∼DED + DCO + ELE + SOL + TPI + DSPA | 7 | −1144.6800 | 2303.4069 | 0.6497 | 0.2353 |
| 3 | ∼DED + DCO + SOL + D500+TPI + DSPA | 7 | −1145.0580 | 2304.1629 | 1.4057 | 0.1612 |
| 128 | Null | 1 | −1660.7770 | 3323.5557 | 1020.8 | 0.0000 |
DED, distance to edges; DCO, Distance to core patches; ELE, elevation; SOL, solar radiation; TPI, Topographic Position Index; DSPA, Distance to Strictly Protected Areas; D500, Distance to patches bigger than 500 ha; K, variable amount; LogLik, log likelihood; AICc, corrected Akaike's information criterion; ΔAICc, difference between selected AICc and the lower AICc; ωi, variable weight.
For forest regrowth, among 128 possible models, only six were plausible according to the ΔAICc criteria. The null model was clearly implausible (ΔAICc = 345,4919) and occupied the penultimate position in the rank of all possible models (Table 2). The plausible models contained similar variables. The second model presented the highest variables weights, and its four significant variables (Table S-4), were selected to better explain forest regrowth (Table S-5). Distance to edges and elevation were inversely proportional to forest regrowth, while slope and solar radiation were directly proportional (Fig. S-1). Thus, forest regrowth happens especially near fragment edges, at lower elevations, and at higher slopes and solar radiation places. According to plausible models, CTI, HLI, distance to patches between 10 and 100 hectares were not significant.
Plausible models explaining the occurrence of forest regrowth in the SJRB.
| Rank | Models | K | Loglike | AICc | ΔAICc | ωi |
|---|---|---|---|---|---|---|
| 1 | ∼DED + SLO + ELE + SOL + CTI | 6 | −1355.2720 | 2722.5819 | 0.0000 | 0.2522 |
| 2 | ∼DED + SLO + ELE + SOL | 5 | −1356.3830 | 2722.7931 | 0.2112 | 0.2269 |
| 3 | ∼DED + SLO + ELE + SOL+HLI + CTI | 7 | −1354.9990 | 2724.0486 | 1.4667 | 0.1211 |
| 4 | ∼DED + SLO + ELE + SOL + D10-100+CTI | 7 | −1355.1510 | 2724.3526 | 1.7707 | 0.1041 |
| 5 | ∼DED + SLO + ELE + SOL + D10-100 | 6 | −1356.1910 | 2724.4199 | 1.8380 | 0.1006 |
| 6 | ∼DED + SLO + ELE + SOL+HLI | 6 | −1356.2100 | 2724.4579 | 1.8760 | 0.0987 |
| 127 | Null | 1 | −1533.0360 | 3068.0738 | 345.4919 | 0.0000 |
DED, distance to edges; SLO, slope; ELE, elevation; SOL, solar radiation; CTI, Compound Topographic Index; HLI, Heat Load Index; D10-100, Distance to 10-100ha patches; K, variable amount; LogLik, log likelihood; AICc, corrected Akaike's information criterion; ΔAICc, difference between selected AICc and the lower AICc; ωi, variable weight.
We identified a high number of spatially-independent events of deforestation and forest regrowth in the SJRB between 1975 and 2010, indicating an intense dynamics of landscape forest cover. Deforestation and regrowth have distinct spatial patterns as they tend to occur under distinct environmental conditions within the landscape. The presence of Strictly Protected Areas was the only socioeconomic factor affecting forest cover change, with deforestation tending to occur far from reserves. Identifying spatial patterns of forest cover change can help to prevent deforestation and promote natural forest regrowth, which is necessary to revert net forest loss in human-modified tropical forest landscapes.
Forest edges as hotspots of forest cover dynamicsBoth deforestation and forest regrowth events are strongly associated with forest edges, indicating that edges are “hotspots” of forest cover dynamics. Convergently, a recent work in a tropical rain forest show that deforestation and reforestation were spatially auto-correlated forming hotspots (Fagua et al., 2019). It has been already shown that natural regrowth in the Atlantic Forest tends to occur close to edges (Seabra and Cruz, 2013Crouzeilles et al., 2020; Borda-Niño et al., 2021), which is expected given the strong seed dispersal limitation of tropical forest plants in open areas (Holl, 1999; Cubiña and Aide, 2001; Hooper et al., 2005). Furthermore, deforestation events in the SJRB also tend to occur close to fragment cores and close to the larger fragments. Selective logging was already observed in the Atlantic Forest, which is related to forest supply and accessibility (Cunha et al., 2021). Therefore, not only total forest cover in the landscape has decreased in the analyzed period, i.e. net forest loss (Seabra and Cruz, 2013), but also a “secondarisation” process is occurring through which old-growth forests are being deforested while natural forest regrowth is simultaneously occurring in other areas (Rosa et al., 2021). Recover period for plant biodiversity and carbon pool in tropical secondary forests may take decades or centuries (Martin et al., 2013). Thus, the increasing prevalence of secondary forests coupled to deforestation in the landscape will negatively impact tree biodiversity and carbon stocks (Sansevero et al., 2017), as well as the capacity to support animal populations (Bowen et al., 2007, Parry et al., 2007). The fact that forest edges are hotspots of both deforestation and regrowth is worrying because of the edge effects (Malcolm, 1994), which may provoke a decline in habitat quality through time due to possible edge effects advances edge-to-interior. Also, it is possible that the proximity of regenerated areas to forest edges means low capacity of seed dispersal in the landscape (Beckman and Rogers, 2013).
What drives forest cover dynamics in the SJRBForest regrowth was determined by elevation and slope, occurring at steep slopes and in low elevation locations. Steep slopes are prone to forest regrowth because they are not propitious to human occupation or agricultural activities (Yackulic et al., 2011; Rezende et al., 2015; Molin et al., 2017; Calaboni et al., 2018; Borda-Niño et al., 2019, 2021; Jimenez et al., 2022). In contrast, deforestation occurred on flat areas or uniform slopes, as demonstrated by the lower Topographic Position Index (TPI, Weiss, 2001) values associated with forest loss. This pattern is recurrent in the literature (Sader and Joyce, 1988; Pfaff, 1999; Teixeira et al., 2009; Yackulic et al., 2011; Miranda-Aragón et al., 2012; Kumar et al., 2014; Rezende et al., 2015; Bavaghar, 2015) which states that deforestation tends to happen in flat areas since they are most suitable to human activities.
Concerning elevation, some previous works pointed that deforestation tends to occur mostly in higher elevations due to the greater availability of forest fragments in these remote regions (Nagendra et al., 2003; Yackulic et al., 2011; Phompila et al., 2017) while others affirmed that deforestation is likely to happen in lower elevations due to greater accessibility (Miranda-Aragón et al., 2012; Bavaghar, 2015). However, the availability of forests depends on each landscape context. Here, mostly of higher elevation locations are occupied by the biggest forest patches, which have been conserved for decades. Thus, low elevations might have determined forest regrowth simply because of higher availability of matrix prone to be recovered in these locations. This idea could be sustained by the TPI behavior regarding deforestation, since higher values of TPI refer to peaks (Weiss, 2001), and these locations are associated to low occurrence of deforestation as well as forest regrowth in the SJRB.
Effect of protected areasDistance to Strictly Protected Areas was the only socioeconomic forest change determinant, as deforestation tends to occur far from Strictly Protected Areas. In our study, distance to Strictly Protected Areas was not a determinant of forest regrowth, but it was a determinant of deforestation. This might indicate that Strictly Protected Areas are efficient to avoid forest loss in the Atlantic Forest, but further studies would be necessary to explore their conservation effectiveness, because this is not a causal relation (Meyfroidt, 2016). Some studies argue that Protected Areas may not be effective to avoid deforestation. Fonseca (1985) explained that areas protected by law in Brazil use to be deforested because it is more profitable than their conservation. However, in each region the effectiveness of Protected Areas may be different (Joppa et al., 2008) and among various categories of protection. In Brazil, the Strictly Protected Areas are supposed to present more rigorous conservation goals than the Sustainable Use Protected Areas. In this regard, Françoso et al. (2015) compared deforestation rates inside and outside distinct categories of protected areas and concluded that Sustainable Use Protected Areas had similar rates to non-protected areas while Strictly Protected Areas had significantly less deforestation in the Brazilian Cerrado. Discordantly, Pfaff et al (2014) concluded that in Amazonia the Sustainable Use Protected Areas are more effective to avoid deforestation than Strictly Protected Areas regarding highly threatening areas. Different from the Amazon, the Atlantic Forest is highly fragmented and presents its remaining forests mostly concentrated in Protected Areas, which remain forests due to its topography, laws, and practices that regulate deforestation (Joppa et al., 2008). Protected Areas are known to promote both conservation and restoration of native ecosystems (Borda-Niño et al., 2019). Here, Protected Areas are located in steep slopes, and some in high elevation areas, which may be related to lack of interest to socioeconomic activities, which may lead to less deforestation near those areas.
Sunlight influenceSolar radiation also influenced both deforestation and forest regrowth, but in separate ways. The solar radiation income was calculated from a Digital Elevation Model (DEM) in ArcMap 10.3, which considers the latitude and few time settings so that the forest cover did not influence its calculation. Despite that, solar radiation influenced forest cover change. In Rezende et al (2015), forest gain was associated with high (>1500 kWh/m²) and intermediated (∼1200 kWh/m²) values of solar radiation, respectively. Distinctly, here only deforestation was more likely to occur in places where solar radiation was lower, while forest regrowth tended to happen in places presenting higher values. Despite both works were developed in the Atlantic Forest and at a local scale, the difference between them might be due to different local socioeconomic factors not evaluated in this work, such as factors related to development of urban-industrial activities (Helmer et al., 2008) or Gross Domestic Products (Fagua et al., 2019). However, it makes sense to assume that regrowth is associated to higher (but not extreme) solar radiation places, once plant recruitment happens to high-light dependent tree species (Beckman and Rogers, 2013). It is worthy to mention that once low solar radiation is a determinant of deforestation, it is advisable that those areas become a focus to conservation policies.
Final considerationsHere we combined spatial analyses, machine learning, and statistical modeling to assess the determinants of forest cover changes in the São João River Basin over a 35-years period (1975-2010). The SJRB is representative of the biophysical and socioeconomic conditions found in the Atlantic Forest and constitutes an area of high importance to conservation within this global biodiversity hotspot. As we expected, our results indicated that distinct factors were associated to the occurrence of deforestation and forest regrowth, while both transition events were strongly associated with short distances from forest edges. Biophysical variables were the most important predictors of forest regrowth and deforestation, although some can reflect environmental and socioeconomic processes concomitantly. Distance from Strictly Protected Areas was the single socioeconomic predictor important for forest change, associated with loss events. Deforestation occurred mostly in concave or flat areas, low solar radiation conditions, near forest edges and cores, and far from SPAs. Distinctly, forest regrowth occurred mostly on high slopes, low elevation areas, high solar radiation, and near forest edges. Our results confirm a previous study about forest change in SBRJ (Seabra and Cruz, 2013). Based on a descriptive analysis of 1975, 1985, 1995, and 2010 land cover maps, these authors reported that forest regrowth tended to occur next to forest edges, and on steep slope, while deforestation tended to occur on fluvial plains. In line with a general trend in several previous studies, inclusive in the Atlantic Forest (Teixeira et al., 2009; Rezende et al., 2015; Molin et al., 2017), we found deforestation associated with gentle slopes and forest regrowth associated with steep slopes, reinforcing them as consistent patterns in landscape dynamics in this biome. Slope and topography are biophysical determinants that reflect land-use constraints and thereby become important drivers of forest cover. As deforestation is a human-induced change and forest regrowth is a natural process, human decisions determined forest cover changes through time in the studied region. We highlight the role of complex topography and the legal regulation of Strictly Protected Areas to buffer forests against deforestation. In the last years, Atlantic Forest has been suffering a cyclic process of loss and gain in its older forests, described by Rosa et al. (2021) as hidden destruction. Accordingly, several studies in the Atlantic Forest found a higher frequency of forest loss and gain events in the proximity of forest edges (Teixeira et al., 2009; Rezende et al., 2015; Molin et al., 2017). Our findings confirm these patterns, as we found both deforestation and forest regrowth strongly associated with forest edges. The proximity of edges can cause a double effect on forest cover, favoring loss by facilitating human access resulting in further deforestation, or favoring gain by providing seed dispersal and suitable micro-climatic conditions for spontaneous regeneration of new forest patches. We highlight the importance of forest edges as drivers of forest change and claim that edge zones are “hotspots” of forest cover dynamics. Neighborhoods of forest edges should thus receive special focus in conservation, restoration, and surveillance strategies in the Atlantic Forest.
Conflict of interestsNone.
Financial support was given by Coordenação de Aperfeiçoamento de Pessoal de Nível Superior (CAPES). The authors thank the following supporting institutions: Department of Ecology – Federal University of Rio de Janeiro (UFRJ), especially the Postgraduate Program in Ecology (PPGE), and the Biosciences Institute – Federal University of the Rio de Janeiro State (Unirio). MSLF has a postdoctoral scholarship from CAPES (PNPD-PPGBIO/UNIRIO/1808844/2018). MLL has the support of the National Institutes for Science and Technology in Ecology, Evolution and Conservation of Biodiversity (INCT EECBio). We also thank Dr. Jayme Augusto Prevedello from University of the Rio de Janeiro State (Uerj) for considerations given about this research.
The following are Supplementary data to this article:

