


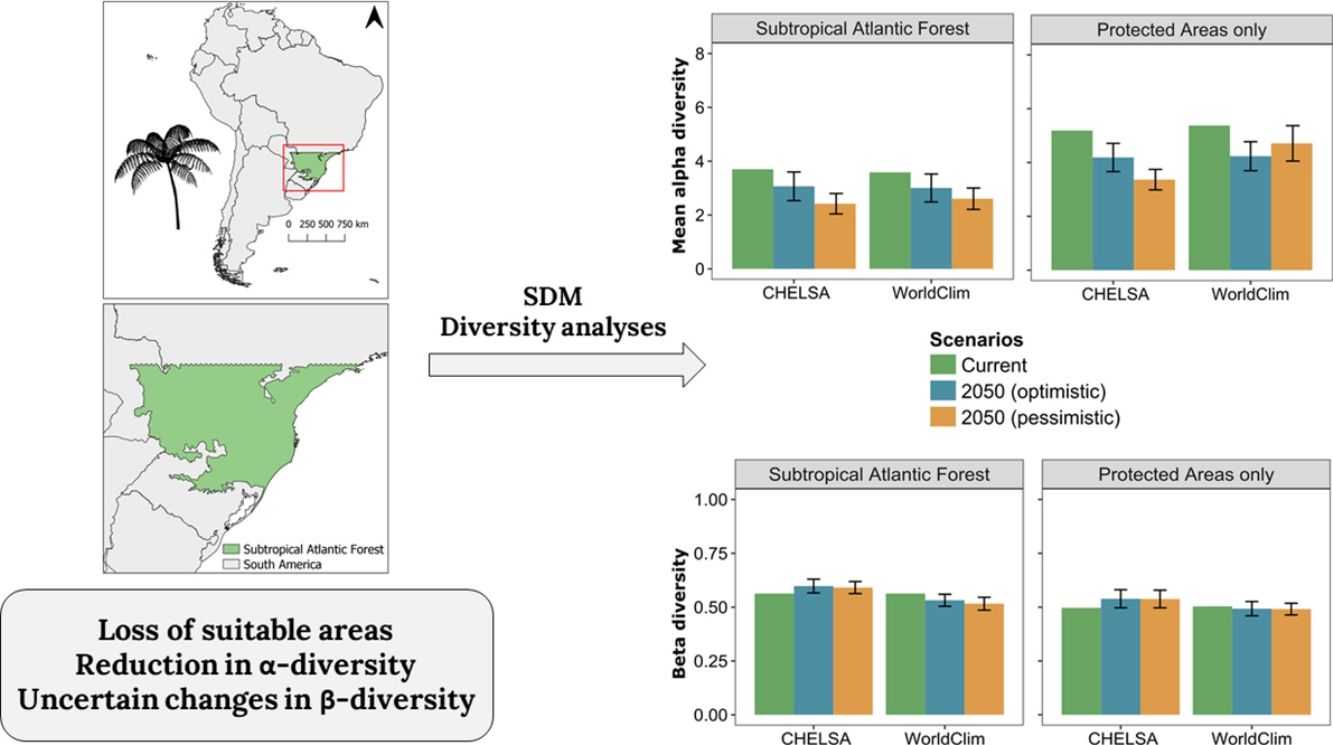
Tree ferns are common elements in the Atlantic Forest domain, sometimes reaching more than half of total dominance at forest sites. Just as in most groups, climate change might impact the distribution and diversity of tree ferns. To investigate the extent of these impacts in the subtropical Atlantic Rainforest, we measured the changes in species distribution, α- and β-diversity between current climate and future climatic scenarios for 2050. Most tree ferns species tend to have their area reduced. Hence, species richness tends to decrease in the future, especially in the Rainforest sites. In general, β-diversity tend to not change on the regional scale, but some sites can have their relative singularity in composition affected. Protected Areas (PAs) in subtropical Atlantic Forest harbor more α-diversity than sites outside PAs — the same applies to β-diversity. Our study offers new insights on the effects of climate change in tree ferns by integrating the evaluation of its impacts on distribution, α-, and β-diversity in all study areas and inside PAs.
Tree ferns are expressive elements in (sub)tropical forest formations (Tryon and Tryon, 1982), sometimes establishing monodominant forests (Schwartz and Gasper, 2020). Consequently, tree ferns take a significant part in the dynamics of ecosystems and may affect the regeneration of woody species and nutrient cycling (Brock et al., 2016). Besides, they contribute to ecological succession (Arens and Baracaldo, 1998), biomass stock in tropical forests (Sarmiento et al., 2005), and provide microhabitat for several epiphytic plants — many of them occurring exclusively on tree ferns’ caudices (Wagner et al., 2015).
In tropical forests, tree ferns have suffered intense exploitation due to the ornamental use of their caudices (Hoshizaki and Moran, 2001; Eleutério and Pérez-Salicrup, 2006), which caused populational exhaustion of many species (Santiago et al., 2013). Combined with this, the current fragmentation in the Atlantic Forest (Ribeiro et al., 2009) plus climate change (IPCC, 2014; Lima et al., 2019) are other sources of threat to tree ferns. Together, these threats might influence the density and distribution of these species as well as the locations of suitable areas to grow and reproduce.
Moreover, despite tree ferns being an important group in the structure of forests, these plants are historically neglected in floristic and ecological studies (Weigand and Lehnert, 2016). The main families of tree ferns in the subtropical Atlantic Forest are Cyatheaceae and Dicksoniaceae. The former (about 15 species) exhibit a preference for warm, humid, and low seasonal climates (Bystriakova et al., 2011). On the other hand, the latter is represented by Dicksonia sellowiana, a species that inhabits higher and colder environments (Gasper et al., 2011), and Lophosoria quadripinnata, a species that grows in ravines, doing best on moist, well-drained soils and in full sun up to 2000m in eastern Brazil (Lehnert and Kessler, 2018).
Ferns richness is associated with water availability (Kessler et al., 2011), and rainfall regime modifications could impact ferns distribution. So, the predicted shifts in rainfall and temperature in the subtropical Atlantic Forest, projected by the Intergovernmental Panel on Climate Change (IPCC) should impact these plants. Therefore, a reduction of colder environments and increase of warmer and moister environments may impact temperate species (VanDerWal et al., 2013), in particular, D. sellowiana — an already endangered species — through the restriction of colder areas.
In this regard, our study sought to predict the impacts of future climate changes in α- and β-diversity of tree ferns in the subtropical Atlantic Forest, as well as to understand the impacts in the potential distribution of each species. Our first hypothesis is that species from both families will suffer changes in their potential distribution areas. We expect Dicksoniaceae species will have their potential distribution area reduced (especially D. sellowiana) because of their association with colder habitats and Cyatheaceae species will increase their potential distribution areas since they generally occur along hot and humid regions. In conjunction with — and as a consequence of — these changes in species distribution, we also expect changes in α- and β-diversity. Since we expect that Cyatheaceae species will increase their distribution range, hence increasing the overlap in species areas, we also expect an increase in regional α-diversity and a decrease in β-diversity — i.e., less variation in species composition among sites, leading to a homogenization of our study region. These changes were evaluated both outside and inside protected areas.
Material and methodsStudy areaThe study area, delimited above by the Tropic of Capricorn (Fig. 1), is the subtropical Atlantic Forest (SAF), floristically distinct from the tropical Atlantic Forest (Eisenlohr and Oliveira-Filho, 2014). SAF occurs in the southernmost portion of Brazil as well as in parts of Argentina and Paraguay (Galindo-Leal and Câmara, 2005). The predominant climate type is Cfa (temperate humid with hot summer), with some areas fluctuating to Cfb (temperate humid with temperate summer) (Alvares et al., 2013). The relief ranges from sea level to altitudes near 1200m, including peaks that reach almost 1900m. Distinct forest types can be found, which includes “Restinga”, on the coastal areas; Rainforests, in low altitudes at the coastal region (<800–900m); Mixed Forests (Araucaria forest), generally in areas with altitudes >800m a.s.l.; and Semi-deciduous Forests in low areas with high seasonality in precipitation (Fig. 1).
Data gathering and cleaning procedure of tree ferns’ records used in the study.")
Among the species that occur in subtropical Atlantic Forest (following Brazilian Flora, 2020 in construction, 2020; Fernandes, 1997; Weigand and Lehnert, 2016), we obtained registers from the literature (Fernandes, 1997; Vibrans et al., 2010), digital herbaria (SpeciesLink — http://splink.cria.org), and a biodiversity database (GBIF — http://gbif.org). We found 2362 Neotropical records. To clean them, first, we selected only records that overlapped our study region. Secondly, occurrence records outside of the distribution reported in the literature were checked and, in case of any doubt, removed from the data set. Finally, since the systematic sampling effort of the Floristic and Forest Inventory of Santa Catarina (IFFSC; Vibrans et al., 2020) created a sampling bias (Fig. 1) in the major portion of our records locations, we spatially filtered them (Fourcade et al., 2014) using a buffer of 0.2° (≈20.5km) as the minimum distance between occurrences — value enough to disaggregate clustered registers. This procedure was done using the ecospat package (Di Cola et al., 2017). The aforementioned approach resulted in 661 valid records for 15 species. We opt to model using only points that intersected our study region since the subtropical Atlantic Forest is floristically (Eisenlohr and Oliveira-Filho, 2014) and phylogenetically (Rezende et al., 2020) distinct from the other regions of the Atlantic Forest domain. Like this, its populations may hold different intraspecific variations (Martin et al., 2020) on their niches and may present different ecological demands already adapted to the subtropical Atlantic Forest. Finally, due to its low number of registers, Cyathea uleana was removed from the data set. The occurrence records, as well as their respective references, are available in the GitHub repository (https://github.com/botanica-furb/treeferns).
Climatic dataCurrent climatic data were obtained from two high-quality data sets: CHELSA (Karger et al., 2017), based on the ERA-Interim climatic reanalysis (Dee et al., 2011), and WorldClim (Hijmans et al., 2005), based on spatially interpolated climatic data from meteorological stations around the world. Data for 2050 (2040–2060) were based on two IPCC scenarios: “optimistic” (RCP2.6) and “pessimistic” (RCP8.5). Briefly, the optimistic scenario assumes net negative CO2 emissions after 2020 (0 by 2100), and the pessimistic assumes a “business-as-usual” scenario (IPCC, 2014).
For future projections with CHELSA, the ten following General Circulation Models (GCMs) were selected: CanESM2 (Arora et al., 2011), CESM1-CAM5 (Hurrell et al., 2013), CNRM-CM5 (Voldoire et al., 2013), FGOALS-g2 (Li et al., 2013), GFDL-ESM2G (Dunne et al., 2012), HadGEM2-AO (Martin et al., 2011), MIROC-ESM (Watanabe et al., 2011), MPI-ESM-MR (Giorgetta et al., 2013), MRI-CGCM3 (Yukimoto et al., 2012), and NorESM1-M (Bentsen et al., 2013). To project future scenarios with WorldClim we also used ten GCMs: BCC_CSM1.1 (Xin et al., 2012), CCSM4 (Gent et al., 2011), CNRM-CM5 (Voldoire et al., 2013), GFDL-CM3 (Donner et al., 2011), GISS-E2-R (Schmidt et al., 2014), IPSL-CM5A-LR (Dufresne et al., 2013), MIROC5 (Watanabe et al., 2011), MRI-CGM3 (Yukimoto et al., 2012), and MIROC-ESM-CHEM (Watanabe et al., 2011), and MIROC-ESM (Watanabe et al., 2011)
All mentioned GCMs were chosen for being the most interdependent in both data sets, following Sanderson et al. (2015). In this sense, they encompass the highest amount of uncertainty in the future climate. The modeling and projection to future scenarios were made using 30' resolution (≈1km) for both CHELSA and WorldClim. To reduce the collinearity between the chosen 19 bioclimatic variables (BIOCLIM 1–19) we used the Variance Inflation Factor (VIF) via vifstep function of the usdm package (Naimi, 2015; R Core Team, 2020). This function generates 5000 random points across the climate layers and calculates the VIF for each variable. We used a step-by-step procedure to obtain a set of weakly correlated variables. At each step, the layer with the highest VIF was removed from the set. The process was repeated until only variables with a VIF below 5 remains. We chose a restrictive VIF since BIOCLIM variables are known for being multicorrelated.
This procedure reduced the 19 climate variables to seven in the CHELSA data set — Annual Mean Temperature (BIO01), Isothermality (BIO03), Temperature Seasonality (BIO04), Mean Temperature of Wettest Quarter (BIO08), Mean Temperature of Driest Quarter (BIO09), Annual Precipitation (BIO12), and Precipitation Seasonality (BIO15) — and seven in WorldClim data set — Isothermality (BIO03), Temperature Seasonality (BIO04), Minimum Temperature of Coldest Month (BIO06), Mean Temperature of Wettest Quarter (BIO08), Mean Temperature of Driest Quarter (BIO09), Precipitation of Wettest Month (BIO13), and Precipitation of Coldest Quarter (BIO19).
Species distribution modelingTo model each species distribution, we used the MaxEnt algorithm (Phillips et al., 2006) performed with several tunning settings, cloglog outputs (Phillips et al., 2017), and 10,000 background points (Phillips et al., 2009). The background points were sampled from the entire study area since (i) the subtropical Atlantic Forest does not have any significant biogeographical barrier; (ii) the mode of dispersion of tree ferns, spores, are easily transported by the wind and may reach very distant places (Muñoz et al., 2004); and (iii) the study area has a small extension when taking (ii) into consideration. We opted to model species distribution using a single ‘tuned’ algorithm since there is no consensus in the literature about ensembles × single algorithms (Hao et al., 2020; Marmion et al., 2009) and MaxEnt alone could perform just as well as an ensemble (Kaky et al., 2020).
Despite MaxEnt being a high-performance algorithm, some studies have shown that MaxEnt's default settings can result in overfitted models (Warren and Seifert, 2011; Radosavljevic and Anderson, 2014; Warren et al., 2014), which is problematic especially when the objective is to extrapolate the model to other periods (Merow et al., 2014). This overfitting occurs because MaxEnt automatically chooses its feature classes (FC) based on the sample size and the regularization multiplier (RM), a penalization parameter, is fixed at 1. Thus, to maximize the predictive performance (Warren and Seifert, 2011) and avoid overfitting (Warren et al., 2014) it is recommended to first generate multiple combinations of RM and FC and then select the most parsimonious model out of the RM×FC combinations using Akaike's Information Criterion corrected for small sampe sizes (AICc; Burnham and Anderson, 2002). In this manner, for each species (13) in each climate data set (separately), we generated 70 models based on the combination of ten RM values (0.5–5, increasing by 0.5) and seven combinations of FC (L, H, LQ, LQH, LQP, LQHP, LQHPT). From the set of 70 available models for each species, the one with the lowest value of ΔAICc was selected as the optimal. To evaluate the performance of each model selected by AICc, we calculated the Continuous Boyce Index (CBI; (Boyce et al., 2002)), a calibration metric that measures how much a model prediction differs from random expectation (Hirzel et al., 2006). CBI measures the predicted-to-expected (P/E) ratio with increasing habitat suitability. It varies from −1 to +1, with values close to +1 indicating good models. Since CBI only needs presence data, it is the optimal evaluation metric for presence-only methods and does not carry the issues of common discrimination metrics such as AUC, Kappa, and TSS (Lobo et al., 2008; Leroy et al., 2018; Warren et al., 2020). For our analyses, we used only species that obtained a CBI evaluation ≥+0.5 — this removed Cyathea hirsuta from our analyses.
The CBI evaluation was based on a geographically structured cross-validation procedure (Radosavljevic and Anderson, 2014). This procedure partitioned as equally as possible our presence and background points into four spatial bins. Then, the training was conducted in three bins and the remaining one was used for testing (Muscarella et al., 2014). The process was performed four times so that all the bins were tested once. This partitioning method (block) is known for providing the best spatial independence between training and testing data sets (Radosavljevic and Anderson, 2014) and providing the best estimates of model transferability across space and time (Fourcade et al., 2014).
The best MaxEnt model for each species, selected via AICc and evaluated by CBI, was projected into two different future scenarios (optimistic and pessimistic) represented by different GCMs predictions (10 in CHELSA and WorldClim) in each scenario. We did not ensemble the GCMs to preserve the intrinsic variability among them. Thus, we can account for the uncertainty in the future climate (Porfirio et al., 2014), and hence the uncertainty in the changes in species distribution and diversity. The modeling procedure above was conducted using the dismo R package (Hijmans et al., 2020).
Finally, we used a site-specific approach to turn the continuous maps generated by MaxEnt into binary maps of presence-absence. The pS-SDM+PRR method (Scherrer et al., 2018) consists of first summing the continuous probabilities of each species occurring in each site to obtain the predicted species richness (decimal points were standardly rounded). Then, the species were ranked in decreasing order of probability of occurrence in each site. Following the ranking, the best-classified species were considered present in the site until the predicted species richness to that site was obtained.
Diversity metricsTo understand how climate change will affect diversity patterns, the study area was divided into 2521 hexagonal cells of ≅195km2 (±53), not always regular due to the shape of our study region. All binary SDM predictions were rescaled to these hexagon cells for diversity analysis. A species was considered present in a cell if MaxEnt's prediction covered more than 25% of the hexagonal cell. Then, based on scaled species distribution in each hexagonal cell, we measured for each scenario α- and β-diversity.
We measured α-diversity as the number of species present in each cell, i.e., species richness. β-diversity was calculated using two indices: total β-diversity (BDTOTAL) and Local Contribution to β-Diversity (LCBD; Legendre and De Cáceres, 2013). BDTOTAL is calculated as the total variance of the site-by-species community matrix and LCBD is the relative contribution of a site to the total variation (Legendre and De Cáceres, 2013). Thus, LCBD represents the compositional singularity of each cell. Before conducting the calculations above, the community matrix was first Hellinger-transformed. All β-diversity metrics were calculated using adespatial (Dray et al., 2019) and beta.div. All analyses were conducted in R (R Core Team, 2020).
Evaluating changes in distribution and diversityWe used two basic statistic metrics to evaluate changes in species distributions, α-, and β-diversity in each future scenario: (1) mean differences and (2) confidence intervals (CI; at 95%) based on the differences between current and future maps. In each future scenario (optimistic, pessimistic) predicted by each GCM — 10 in CHELSA and WorldClim – we measured the difference between each GCM prediction and current values for each metric of interest. From these values of differences, we calculated the mean and CI. The upper and lower CIs were calculated as x¯±tn−1σ/n, where x¯ is the sample mean; tn−1 is the critical t-value with n−1 degrees of freedom and area of α/2 in each tail; σ is the standard deviation, and n is the sample size. We decided to use a Student's t-distribution since it is a better fit for small sample sizes (10 GCMs in each data set). Hence, we can obtain a significant p at α=0.05 for a standard t-distribution.
To evaluate the changes in the species distribution area, we calculated 100×(Fa−Ca/Ca), where Fa is the area of distribution in the future climate scenario and Ca is the area of distribution in the current climate scenario. This equation returns the changes in areas as a percentage: positive values indicate an increase in species area, while negative values indicate a decrease. We calculated these changes in area based on the number of cells that each species was predicted to occur in the resolution of our environmental data sets (30'). To assess the changes in α-diversity we measured the differences in richness in each one of the 2521 hexagonal cells and calculated the mean and CI as described above. Following, we built maps that show mean differences for sites in which the range of CI does not include 0 (i.e., the change is statistically significant). The same procedure was used to evaluate the changes in LCBD. On a regional scale, we measured the changes in α-diversity calculating differences of the mean richness of sites between each future GCMs predictions and current maps. Then, the mean and CI were calculated from the differences in mean richness. Changes in total β-diversity were also calculated as mean differences between future GCMs predictions and current maps.
Further, we evaluated α- and β-diversity changes using only grid cells that overlap Protected Areas (PAs) in the study region — applying the same procedure described above. Boundaries of PAs were obtained from the World Database on Protected Areas (UNEP-WCMC, 2019). We used all IUCN categories of protected areas (Lausche and Burhenne-Guilmin, 2011) plus indigenous areas, which indirectly safeguard the environment. Therefore, we were able to compare the change in diversity indices between protected and non-protected areas in any specific scenario and climatic data set.
ResultsSpecies distributionThe projected impacts of climate change on species distribution were similar in both climatic data sets and future scenarios (Table S01; Fig. S01-12). The changes inside PAs were also similar (Fig. 2). However, some species differ in behavior between CHELSA and WorldClim. For example, while in CHELSA's optimistic scenario Sphaeropteris gardneri more than doubled its distribution, the same did not occur in WorldClim's optimistic scenario, where the species tended to lose more than 40% of its distribution area; Cyathea atrovirens and Cyathea delgadii suffered a reduction in distribution in CHELSA while an increment in distribution occurred in WorldClim. In PAs, if a species distribution was expected to decline in either climate data set or scenario the same pattern arises in the other — except in C. delgadii and S. gardneri. Taking into consideration all possible combinations (96) of climatic data sets (2)×studied region (inside and outside PAs) (2)×scenarios (2)×species (12), only 18 outcomes (25% — out of 72 significant outcomes) had the potential to increase its distribution. Both Dicksoniaceae species are predicted to lose suitable areas. Individual maps of species distribution can be seen in the supplementary material (Figs. S01–12) and online in a Shiny interface (https://avrodrigues.shinyapps.io/tferns). Chosen model parameters and evaluation can be seen in Table S02.
Diversity patternsα-Diversity, future scenario (Optimistic×Pessimistic), and region (Entire Study Region×PAs only). Confidence intervals that touch 0 (dashed line) are considered non-significant.")
In CHELSA, the highest α-diversity values (current and future scenarios, Fig. 3; https://avrodrigues.shinyapps.io/tferns) were found in the Atlantic rainforests area. The same pattern was found in WorldClim. In addition, WorldClim also exhibited elevated richness in a transitional zone between Araucaria forest and Semideciduous forest in Rio Grande do Sul, Brazil. In Araucaria and semi-deciduous forests, where α-diversity is lower, few changes are observed between climatic data sets and scenarios. The current regional mean richness in CHELSA is 3.70 (sd: ±2.39) in all subtropical region and 5.18 (sd: ±2.80) in areas within PAs. In WorldClim these values are 3.58 (sd: ±2.84) and 5.37 (sd: ±3.44), respectively. A reduction in the regional mean richness occurs in both future scenarios and climatic data sets, being more intense in the pessimistic scenario.
 CHELSA and (B) WorldClim. The first-panel column shows current richness, the second – shows the mean richness change in the optimistic scenario, and the third – shows the mean richness change in the pessimistic scenario.")
Patterns of tree ferns species richness in the subtropical Atlantic Forest at the current time and the predicted change in the future scenarios using environmental data set from (A) CHELSA and (B) WorldClim. The first-panel column shows current richness, the second – shows the mean richness change in the optimistic scenario, and the third – shows the mean richness change in the pessimistic scenario.
The regional BDTOTAL in current time is 0.56 in CHELSA and WorldClim. In areas within PAs these values are lower: 0.49 and 0.50, respectively. BDTOTAL increases in both CHELSA's scenarios and studied region and decreases in WorldClim's both scenarios when all subtropical Atlantic forest is analyzed. For PAs analyzed with WorldClim, no significant changes occurred.
LCBD presented similar patterns in both CHELSA and WorldClim predictions (Fig. 4). At the current time, higher LCBD values are detected in the north and west of the study area. These same areas are predicted to experience larger changes in the future, losing their current uniqueness, i.e., less LCBD than in the current time. Still, some areas in the Araucaria forest are predicted to increase its composition uniqueness.
 in the subtropical Atlantic Forest at the current time and the predicted change in the future scenarios using environmental data set from (A) CHELSA and (B) WorldClim. The first-panel column shows the current LCBD, the second- shows the mean LCBD change in the optimistic scenario, and the third- shows the mean LCBD change in the pessimistic scenario.")
Patterns of tree ferns Local Contribution to β-diversity (LCBD) in the subtropical Atlantic Forest at the current time and the predicted change in the future scenarios using environmental data set from (A) CHELSA and (B) WorldClim. The first-panel column shows the current LCBD, the second- shows the mean LCBD change in the optimistic scenario, and the third- shows the mean LCBD change in the pessimistic scenario.
Our first hypothesis, which stated changes in species distribution due to climate changes, was partially supported. Dicksoniaceae species indeed suffered a reduction in its distribution. However, contrary to our expectations, most of Cyatheaceae species also showed a decrease in their extents. Our second hypothesis, that climate change will drive changes in species diversity (α- and β-diversity) on a regional scale — due to the impacts of species distribution change — was supported. We found support for both changes in α- and β-diversity. Following the decrease in Cyatheaceae species distribution, regional mean richness did not increase, as we expected, but decreased.
Our approach of incorporating uncertainties in GCMs’ predictions allowed us to assess the coherence among future scenario models. Thus, we were able to guarantee a confidence level in the predictions of future change of species distribution and diversity patterns. The accounting of such uncertainties in the measure of future predicted changes is needed because different GCMs affect differently the predicted distribution of species (Diniz-Filho et al., 2009; Buisson et al., 2010).
Changes in species distributionA global analysis of Cyatheaceae distributional patterns showed a clear preference of the family for hotter and wetter locations with low seasonality — although some species show a capacity to occupy relatively cold regions, rarely where minimum temperatures drop below freezing (Bystriakova et al., 2011). Since an increase in temperature is expected, Cyatheaceae species would be able to expand their range into parts of the Araucaria forest as the effects of higher temperatures could reduce the cold intensity (Wilson et al., 2019) and set up favorable conditions for some of Cyatheaceae. Nonetheless, our results show that few Cyatheaceae species can expand their potential areas into the Semideciduous forest, where there is a higher seasonality in precipitation than areas of rainforest and eastern Araucaria forest (Oliveira-Filho et al., 2015). The two species that could increase their distribution, A. sternbergii and Cyathea leucofolis, are restricted toward the northeastern areas of the subtropics, with few populations having an austral distribution.
Cyathea phalerata, a common species in southern Brazil, is expected to lose distribution. This species thrives in warmer temperatures, in vivo, or in vitro (Marcon et al., 2017) — although temperatures above 32°C seem to inhibit spore germination. If this pattern recurs in all Cyatheaceae, a major increase in temperatures could restrict even more the species range in the future. Alsophila setosa — one of the most common tree ferns in forest communities within the subtropical Atlantic Forest (Schwartz and Gasper, 2020), usually favored by forest degradation since it can proliferate through vegetative growth (Schmitt and Windisch, 2005) — is also expected to lose distribution.
As we expected from Dicksoniaceae, both species tend to show an abrupt reduction in their distribution. For instance, in the pessimistic scenario, more than 65% of D. sellowiana distribution — an already endangered species — may be lost (more than 70% in L. quadripinnata). D. sellowiana is a species capable of withstanding colder environments (Gasper et al., 2011). For this reason, its future distribution tends to be restricted to higher and colder locations of the Araucaria forest (Figure S09).
L. quadripinnata seems able to inhabit the colder regions of the Araucaria forest as well as part of the rainforest. This species, just as D. sellowiana, will suffer a reduction in its distribution, being limited especially to the former vegetational type. The species has been recorded in both temperate (Ricci, 1996) and tropical (Bernabe et al., 1999) rainforests. In this sense, precipitation — rather than temperature — seems to be the main determinant of this tree fern occurrence.
Changes in diversity patternsThe second hypothesis was that distinctive responses of Dicksoniaceae and Cyatheaceae species should drive changes in α- and β-diversity patterns. We expected that species richness (α-diversity) would increase, following the increase in overlapping distributions of Cyatheaceae species which in turn would drive a decrease in β-diversity — leading to diversity homogenization. Our expectations about α-diversity were not supported since a decrease in regional richness is predicted for the entire studied region and also on sites within PAs (Fig. 3 and Table 1). The current locations that uphold more richness are the ones that will be strongly affected by climate change. This summarizes most of the losses toward the north portion of the Atlantic rainforest, the coastal region of our study area (Fig. 1). These losses may affect the conservation of other biological groups that depend on tree ferns, such as epiphytes that have a substrate preference for them (Mehltreter, 2008; Bartels and Chen, 2012).
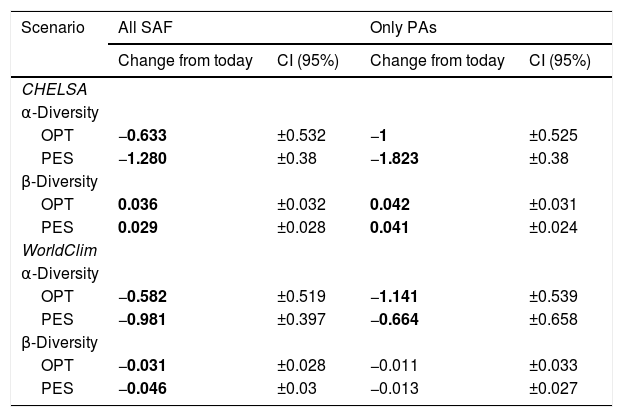
Regional mean changes in α- and β-diversity between each climate data set, region, and scenario. A significant change exists when the absolute mean change is greater than the absolute confidence interval (CI). Significant changes are in bold. SAF=subtropical Atlantic Forest; PA=Protected Areas; OPT=optimistic future scenario; PES=pessimistic future scenario.
| Scenario | All SAF | Only PAs | ||
|---|---|---|---|---|
| Change from today | CI (95%) | Change from today | CI (95%) | |
| CHELSA | ||||
| α-Diversity | ||||
| OPT | −0.633 | ±0.532 | −1 | ±0.525 |
| PES | −1.280 | ±0.38 | −1.823 | ±0.38 |
| β-Diversity | ||||
| OPT | 0.036 | ±0.032 | 0.042 | ±0.031 |
| PES | 0.029 | ±0.028 | 0.041 | ±0.024 |
| WorldClim | ||||
| α-Diversity | ||||
| OPT | −0.582 | ±0.519 | −1.141 | ±0.539 |
| PES | −0.981 | ±0.397 | −0.664 | ±0.658 |
| β-Diversity | ||||
| OPT | −0.031 | ±0.028 | −0.011 | ±0.033 |
| PES | −0.046 | ±0.03 | −0.013 | ±0.027 |
All observed changes may be associated with variations in precipitation since water availability seems to be an important species richness predictor for ferns, as pointed out by several authors (Aldasoro et al., 2004; Kessler et al., 2011; Gasper et al., 2015). Thus, the current low α-diversity of tree ferns observed in the Araucaria and Semideciduous forests, as well as the reduction of α-diversity in future scenarios, may be caused by rainfall regimes and higher climatic seasonality (Bystriakova et al., 2011; Cabré et al., 2016).
LCBD values point out to changes in the relative uniqueness of species composition in some areas. In the west, a region with few species in the current climate and few losses in the future, LCBD is higher in the current climate and tends to decrease in the future. It seems that richness loss in the east region causes the composition of west sites to become more similar to other sites. Conversely, the Mixed Forest region shows a tendency to become more unique, perhaps because richness becomes more similar to the other sites — while species composition differed due to its sites occurring within the center of a climatic gradient, i.e., in a transitional zone of species distribution.
Implications for biodiversity conservation agendaOur results provide relevant insights into the conservation of tree ferns by predicting which species will lose suitable habitats in the future (Fig. 2; Table S01; Figs. S01–12). Also, our results demonstrate higher richness inside PAs than outside, indicating that the actual PAs are established in the richest areas of the subtropical Atlantic Forest — at least for tree ferns.
We note that almost all species of tree ferns will lose suitable areas inside the subtropical Atlantic rainforest — not only Dicksoniaceae species as we thought. Species that occupy higher areas such as G. capensis, L. quadripinnata, and D. sellowiana seem to be exposed to more distribution constraints than species occurring in the rainforest. Historically endangered species such as D. sellowiana had their potential distribution area greatly diminished. Also, climatic changes may alter their threatened status from endangered (Santiago et al., 2013) to critically endangered (considering IUCN 2012 criteria of population size reduction: A1cB1b).
Unfortunately, some PAs in higher altitudes, such as Parque Nacional de São Joaquim — where D. sellowiana, as well as other threatened species (such as Araucaria angustifolia; Wilson et al., 2019) may find suitable areas in the future — are threatened to be downsized (see the workgroup created to study the protected area boundaries; ICMBio – Instituto Chico Mendes de Conservação da Biodiversidade, 2019).
More than half of the studied species are predicted to lose suitable areas, even inside PAs, where the losses are greater in some scenarios when compared to all subtropical regions (Fig. 4 and Table S01). So, to safeguard these species, not only new PAs will be needed, but the environmental legislation that protects the Atlantic Forest domain must be respected (Rajão et al., 2020). This includes protecting forest remnants inside particular properties, as they play an essential role in sheltering species in situ (Chape et al., 2005; Metzger et al., 2019). Yet, new PAs may lose their long-term effectiveness in species conservation since they are also going to be impacted by climate change. To optimize cost-benefit analysis of implementing new PAs, lawmakers and specialists should always consider species conservation now and in the future (Araújo et al., 2011).
The authors are grateful to the Fundação de Amparo à Pesquisa e Inovação de Santa Catarina (FAPESC) for supporting IFFSC and for Coordenação de Aperfeiçoamento de Pessoal de Nível Superior – Brasil (CAPES) – Finance Code 001, for postgraduate research grants. Finally, we are also thankful for FUMDES (SC) and PIPE (SC, FURB) for funding students to research at the undergraduate level. ALG also thank CNPq for the productivity grant (311303/2020-0).
The following are Supplementary data to this article:

