


Plant invasion has been proved to threaten biodiversity conservation and ecosystem maintenance at a global scale. It is a challenge to project suitable habitat distributions of invasive plant species (IPS) for invasion risk assessment at large spatial scales. Interaction outcomes between native and invasive plant species are dependent as a function of trait context, which may contribute to suitable habitat distributions of IPS. Here, we explored the effect of functional trait context on suitable habitat distribution of invasive plant species at a global scale. The plant functional trait context was quantified based on the community mean values of specific leaf area, leaf nitrogen concentration, height, and woody density. Habitat suitability modeling was used to project suitable habitat distributions of IPS based on functional trait and abiotic (climate, soil, and human footprint) contexts. There were significant differences in contexts between functional traits and abiotic conditions for IPS across different biomes at a global scale. Community mean functional traits, particularly, height could contribute to habitat suitability of IPS. The functional trait context could have a large effect on the habitat suitability of IPS in Boreal forests/Taiga, Tropical and subtropical grasslands, savannas and shrublands, Tundra, Mediterranean forests, woodlands and scrub, and Mangroves. Functional trait context could affect suitable habitat distributions of IPS at a global scale, indicating that functional trait context should be used as the input for modeling habitat suitability of IPS. The study provided new insights into the application of habitat suitability modeling on plant invasion risk assessment.
Plant invasion is an important threat to biodiversity conservation and ecosystem maintenance under global changes (Bradley et al., 2010; Peltzer et al., 2010; Allen and Bradley, 2016). Rapid economic development and fast changes in climatic conditions are the primary drivers of plant invasion (Lin et al., 2007; Fuentes et al., 2015; van Kleunen et al., 2020). For example, global trade and economic use can drive plant invasion around the world (Lin et al., 2007; Seebens et al., 2015; Chapman et al., 2016). Numerous studies (e.g., Bradley et al., 2010; Seebens et al., 2015; Allen and Bradley, 2016; Shrestha and Shrestha, 2019) have shown that climate change can enhance plant invasion from regional (e.g., South Africa) to global scales. Therefore, ecologists and conservation managers must prevent and control this global plant invasion issue. The identification of areas at risk has been received significant research attention over the past years based on the suitable habitat distribution of invasive plant species (IPS) (e.g., Neilson et al., 2005; Allen and Bradley, 2016; Shrestha and Shrestha, 2019). Projecting suitable habitat distributions of IPS is thus, essential for anticipating their potential spread and impact on global ecosystems.
Hutchinson niche hypothesis indicates that IPS can become established and spread successfully when occupying environmental niche spaces that are unused by the resident community (Broennimann et al., 2007; Catford et al., 2009; MacDougall et al., 2009; Fried et al., 2019). Based on this niche hypothesis, Blonder (2016) showed that observed hypervolumes (e.g., realized niches) could have holes, defined as unoccupied hyperspace, which may drive plant invasion. This may be at the disadvantage for native species due to the climatic differences between native and invasive regions (Wan et al., 2017; Atwater et al., 2018; Perret et al., 2019; van Boheemen et al., 2019; Christina et al., 2020). Recent studies (e.g., Petitpierre et al., 2012; Liu et al., 2020) have shown the existence of climatic niche conservatism between native and invasive ranges at a global scale. Based on this hypothesis, habitat suitability modeling has been used widely to predict the suitable habitat distributions of IPS on global scales based on species occurrences, abiotic context, and the conduction of risk assessments for plant invasion (Bradley et al., 2010; O’Donnell et al., 2012; Ramírez-Albores et al., 2016; Lamsal et al., 2018; Sherpa et al., 2019). However, in some cases, there may be the uncertainties on the prediction of habitat suitability modeling on plant invasion based on the observation of associations between plant invasion and an abiotic context (e.g., climate, soil, and human influence; Kelly et al., 2014; West et al., 2016; Pili et al., 2020). Biotic and abiotic contexts shape suitable habitat distributions of plant species across different spatial scales (Richardson et al., 2000; Araújo and Luoto, 2007; Meier et al., 2010; Wisz et al., 2013; Carboni et al., 2018). Therefore, there may be uncertainties associated with the prediction results of suitable habitat distributions of IPS if only abiotic variables are being considered.
Interaction outcomes between plant species are dependent on the biotic or abiotic contexts for plant invasion (Araújo and Luoto, 2007; Catford et al., 2009; Drenovsky et al., 2012; Funk and Cornwell, 2013; Fraterrigo et al., 2014). Hutchinson niche hypothesis states that environmental conditions (i.e., species abiotic niche contexts) are the ones limiting species distribution at large spatial resolutions and extents (Soberón and Nakamura, 2009). From the perspective of biotic contexts, Eltonian noise hypothesis showed that biotic interactions may be a major driver of abundance at smaller spatial resolutions, but not at large geographical scales (Soberón and Nakamura, 2009; De Araújo et al., 2014; Fraterrigo et al., 2014). In other words, that biotic context does not have any effect on species distributions on large geographical scales (Soberón and Nakamura, 2009; De Araújo et al., 2014; Fraterrigo et al., 2014; Jenkins et al., 2020). Some studies (e.g., De Araújo et al., 2014; Alvarez‐Martínez et al., 2015; Jenkins et al., 2020) tested the Eltonian noise hypothesis using a case of parrots and provided implications for the importance of biotic interactions in modeling suitable habitat distributions of IPS on large geographical scales. The integration of biotic interactions into habitat suitability modeling may improve the performance for modeling suitable habitat distributions (Soberón and Nakamura, 2009; De Araújo et al., 2014; Alvarez‐Martínez et al., 2015). However, few studies (e.g., Bradley et al., 2010; O’Donnell et al., 2012; Ramírez-Albores et al., 2016; Wittmann et al., 2016; Lamsal et al., 2018; Sherpa et al., 2019) have shown whether or not interaction outcomes between plant species could contribute to suitable habitat distributions of IPS on large geographical scales.
The functional traits of IPS (e.g., seed mass, leaf traits, and height) can capture population processes linked to growth rate and mortality, explicitly as functional responses to resources and other abiotic factors (Russo et al., 2010). Carboni et al. (2018) showed that functional traits modulate the response of IPS within biotic contexts. Blonder et al. (2018) indicated that functional-trait context dependence can predict alpine plant community dynamics. Furthermore, functional trait diversity (i.e., functional richness, functional evenness, and functional divergence) can reveal mechanisms of species coexistence in the plant communities (Mason et al., 2012; Adler et al., 2013; Gross et al., 2017). Interaction outcomes between native and invasive plants play a key role in plant invasion processes worldwide (Araújo and Luoto, 2007; Catford et al., 2009; Drenovsky et al., 2012; Funk and Cornwell, 2013). Substantial trait differences exist widely between invasive and non-invasive plant species (van Kleunen et al., 2010). Furthermore, functional trait differences and trait plasticity mediate the biotic resistance of native communities to potential plant invaders (Conti et al., 2018). Trait plasticity of IPS can drive a positive feedback of the competitive mechanisms in the invaded native community (Conti et al., 2018). Thus, the effects of the interaction outcomes between the native and invasive plants indicate that functional traits regulate the distributions of IPS. The functional traits of both native and invasive plants are related to resource use and competition across different habitats. Different functional traits can lead to various resource-use strategies in plant communities (Drenovsky et al., 2012; Blonder et al., 2018; Carboni et al., 2018). Functional trait diversity may increase the ability of plant communities to resist plant invasion (Pokorny et al., 2005; Maron and Marler, 2007; Funk et al., 2008; Byun et al., 2018). Functional trait context dependence plays an important role as biotic conditions in shaping suitable habitats of IPS (Drenovsky et al., 2012; Blonder et al., 2018; Carboni et al., 2018). Thus, the functional trait-based approach can be included in ecological niche-based species distribution modeling (SDM) of IPS (Gove et al., 2009; Moor et al., 2015; Wittmann et al., 2016). However, few studies have explored the effects of using functional trait contexts on IPS distribution modelling at a global scale.
To improve the robustness of SDMs for predicting plants invasion, plant functional traits should be considered as a biotic context in IPS SDM across different spatial scales. The main objective of our study was to quantify the potential areas of invasion for plants at a global scale based on functional trait (biotic) and abiotic contexts. To quantify the effects of the functional trait context on the habitat distribution of IPS, the following three hypotheses were tested:
(1) Hypothesis 1: Differences between abiotic and biotic variables. The functional trait context may be independent of an abiotic context. There may be differences in niche spaces between trait (biotic) and abiotic contexts across different species and biomes. If this hypothesis is established, we should take community mean functional traits as a biotic context into consideration for quantifying ecological niches, as differentiate from abiotic context (e.g., climate, soil and elevation). Modeling algorithms and species data characteristics generate habitat suitability models with varying sensitivity to collinearity among environmental predictors (De Marco and Nóbrega, 2018). Collinearity among predictors decreases the efficiency and increases the uncertainty of habitat suitability modelings (De Marco and Nóbrega, 2018). Previous studies (e.g., Butler et al., 2017; Blonder et al., 2018; Boonman et al., 2020) showed that plant functional trait distributions may be closely associated with environmental factors. Therefore, it is necessary to test the differences in niche spaces between trait (biotic) and abiotic contexts across different species and biomes for decreasing negative the effects of collinearity among abiotic and biotic variables on habitat suitability modeling. Differences between abiotic and biotic variables could enhance habitat suitability modeling performance for reducing uncertainties on habitat suitability modeling for plant invasion risk.
(2) Hypothesis 2: Contribution of functional traits in habitat suitability modeling. Functional traits can regulate species interaction, e.g., species competition and resistance of native species to plant invasion in plant communities (Funk and Cornwell, 2013; Kunstler et al., 2016; Carboni et al., 2018; Blonder et al., 2018). Furthermore, community mean functional traits could change habitat suitability of plant species significantly due to the roles of functional traits on species competition and resistance in plant communities. Hence, it is necessary to integrate the dependence of plant functional traits into the application of habitat suitability modeling on suitable habitat distributions of IPS. The functional trait context could provide large contributions to the variation in habitat suitability of IPS at spatial scales. If this hypothesis is established, we could determine that the functional traits are affecting the suitable habitat distributions of IPS.
(3) Hypothesis 3: IPS dependence of biomes. The effects of the functional trait context on habitat suitability may vary depending on the types of biomes. A biome is defined as a region in which the similar structure or appearance of terrestrial vegetation as well as some characteristics of plant communities (Olson et al., 2001). Different biomes lead to the variation in plant functional trait diversity and resistance ability of plant community to biological invasion (De Deyn et al., 2008; Reu et al., 2011; Bellard et al., 2013; Dantas and Pausas, 2020). Thus, it is potential that the habitat suitability of IPS may be different across a variety of biomes. If this hypothesis is established, the application of habitat suitability modeling on the suitable habitat distributions of IPS should depend on the types of biomes.
We have quantified the habitat suitability of 37 IPS found in the list of the “100 of the world’s worst invasive alien species” established by the Invasive Species Specialist Group using the global maps of functional traits and an abiotic context (Luque et al., 2014; http://www.iucngisd.org/gisd/). The functional trait context was based on plant height, leaf nitrogen concentration, specific leaf area, and woody density; the abiotic context was based on climate, soil, and human influence. In this study, we calculated community mean values of plant functional traits to quantify the functional trait context at a global scale based on the study of Boonman et al. (2020). We used habitat suitability modeling to project potential suitable areas of invasion for plant species at all global scale based on functional trait and abiotic contexts.
Materials and methodsSpecies dataThe Invasive Species Specialist Group (ISSG) of the International Union for Conservation of Nature (IUCN) has compiled a list of the “100 of the world’s worst invasive alien species” (http://www.iucngisd.org/gisd/). Among these 100 species, 37 are plants (Luque et al., 2014; http://www.iucngisd.org/gisd/). In this study, we used 37 IPS that have been identified as the most noxious around the world, causing significant impacts on biodiversity and/or human activities (Luque et al., 2014). Occurrence data with geographic coordinates were obtained for each IPS from several online databases including: (1) Global Biodiversity Information Facility (GBIF; www.gbif.org), (2) LIFEMAPPER (www.lifemapper.com), (3) SPECIESLINK (www.splink.cria.org.br), and (4) IUCN/SSC ISSG. The bias and error of occurrence records were corrected according to the study of Zizka et al. (2019). We removed occurrences with potential geographical errors including data entry errors, or coordinates recorded for capitals, country centroids, and biodiversity institutions, namely, deleting geographical error records on radius around capitals, country centroids, and biodiversity institutions. We removed the replicated occurrence data within equal area polygons of a 0.5° spatial resolution (loosely resembling the scale of 0.5° latitude × 0.5° longitude cells). The details of species data are being shown in Table S1.
Data on functional traits and abiotic variablesThe functional trait data on plant species that included height, leaf nitrogen concentration (LNC), specific leaf area (SLA), and woody density (WD) were obtained from the study of Boonman et al. (2020; http://doi.org/10.6084/m9.figshare.11559852). Global distributions of community mean height, LNC, SLA, and WD were mapped using an ensemble modeling approach, respectively based on georeferenced, locally measured trait data representative of the plant community from the TRY database (Kattge et al., 2020). The spatial resolution of functional trait maps was 0.5°. We obtained the four maps representing each functional trait evaluated; and used these layers as inputs for habitat suitability modeling based on height, LNC, SLA, and WD, respectively. We used four layers including height, LNC, SLA, and WD as the inputs of habitat suitability modeling to project suitable habitat distributions of IPS on global scales.
To run habitat suitability modeling, four climatic variables (annual mean temperature (°C × 10); temperature seasonality (standard deviation × 100); annual precipitation (mm); and precipitation seasonality (coefficient of variation)) were downloaded at a 10.0 arc-minutes resolution from the CHELSA database (averaged from 1950 to 2000; https://chelsa-climate.org/downloads/). Six soil variables (bulk density (kg/cubic meter); cation exchange capacity (cmolc/kg); coarse fragments volumetric (%); soil organic carbon density (tonnes per ha); soil pH; and soil texture fraction silt (%)) were also obtained at a 0.5 arc-minutes resolution from SoilGrids (https://www.soilgrids.org/). Finally, one human footprint layer of a 0.5 arc-minutes resolution was downloaded from Socioeconomic Data and Applications Center (sedac; https://sedac.ciesin.columbia.edu/data/set/wildareas-v2-human-footprint-geographic/data-download). The four climatic variables have been proved to affect the distribution and physiology of plant species across different spatial extents from local to global scales and have been widely used to project suitable habitat distributions of plant species (Bellard et al., 2013; Wan et al., 2014; Kelly et al., 2014; Bradie and Leung, 2017; Wang et al., 2019; Amiri et al., 2020). The soil variables (e.g., percentage of clay, silt, and sand contents) can contribute to the habitat suitability of plant species on macroecological scales (Belgacem and Louhaichi, 2013; Bradie and Leung, 2017; Hageer et al., 2017; Figueiredo et al., 2018). Numerous studies (e.g., Beans et al., 2012; Gallardo et al., 2015; Humair et al., 2015) have shown that human activities (e.g., global trade and ornamental plants) are the drivers of global plant invasion, and affect the potential size of the range and niche overlap with human-disturbed environments (Soberón and Peterson, 2005; Gallien et al., 2019). Human footprints provide an index of anthropogenic impacts on the environment and indicate the degree of disturbance based on multiple indicators including human population pressure, human land use and infrastructure, and human access. Based on the study of Gallien et al. (2019), human footprint is an indicator of human-disturbed environments. These environmental variables can potentially have a large impact on the habitat suitability of IPS on large spatial scales (Callaway et al., 2004; Kelly et al., 2014; Gallardo et al., 2015; Chapman et al., 2016; Atwater et al., 2018). A Pearson’s correlation analysis was used to determine the relationships among all the climatic variables; the findings showed that relationships were weak due to (r) < |0.75|, expect for precipitation seasonality and annual mean temperatures. However, both precipitation seasonality and annual mean temperatures play important roles in the habitat suitability of plant species and are the most important climatic drivers of suitable habitat distributions of IPS across different spatial scales from local to global scales (Beans et al., 2012; Dellinger et al., 2016; Bradie and Leung, 2017; Wan et al., 2016; Wang et al., 2019). The data resolution of climate, soil, and human footprints were transformed to 0.5° using a resampling technique in ArcGIS 10.6 (https://www.esri.com/software/arcgis/arcgis-for-desktop).
Testing hypothesesDifferences between abiotic and biotic variables (H1)We used principal components analysis (PCA) to quantify functional trait (biotic) and abiotic contexts on the global scale based on functional trait data (i.e., height, LNC, SLA, and WD) and abiotic data (i.e., climate, soil, and human footprint; Janžekovič and Novak, 2012). All the abiotic data were standardized by Ln-transformation as the inputs of PCA for evaluating the abiotic context. The human footprint has effects on resource availability and variability of invaded environments for IPS, which can be related to species interactions (Gallien et al., 2019). Hence, we evaluated whether a human footprint acted as an abiotic or biotic variable based on the loading values of the PCA. The first three Principal components (PCs) could explain 63.39% of the variance of functional trait and abiotic data. The representation on PCs was based on loading values of PCA for functional trait (biotic) and abiotic contexts (Table S2). PC1 was related to functional traits including height, LNC, SLA, and WD (Table S2). PC2 was related to bulk density, cation exchange capacity, and soil organic carbon density (Table S2). PC3 was related to temperature seasonality, annual precipitation, and soil pH (Table S2). Thus, PC1 could represent the functional trait context (i.e., biotic context), PC2 could represent soil context, and PC3 could represent the climate context for IPS at a global scale. The human footprint was independent of the first three PCs based on the loading values of PCA. Here, we considered PC1 as a functional trait context, and PC2 and PC3 as soil and climate contexts, respectively.
We calculated the log response ratio of context values as: RR = ln (Xa/Xt), where, RR is the log response ratio of the average context values of grid cells for 37 IPS in each biome, and Xa and Xt are the average PC values of grid cells in a specific biome in the abiotic context (soil context: PC2, and climate context: PC3) and biotic context (PC1; namely; trait context), respectively (Arnqvist and Wooster, 1995; Wallace et al., 2017; Wan et al., 2019). A paired-samples ANOVA test was used to examine the significant differences of average PC values between trait and abiotic contexts across different species and biomes. Thus, we could test whether the functional trait context was independent of an abiotic context or not. The biome map of global biomes was obtained from the study of Olson et al. (2001). A total of 14 biomes including Tropical and subtropical moist broadleaf forests, Tropical and subtropical dry broadleaf forests, Tropical and subtropical coniferous forests, Temperate broadleaf and mixed forests, Temperate conifer forests, Boreal forests/Taiga, Tropical and subtropical grasslands, savannas and shrublands, Temperate grasslands, savannas and shrublands, Flooded grasslands and savannas, Montane grasslands and shrublands, Tundra, Mediterranean forests, woodlands and scrub, Deserts and xeric shrublands, and Mangroves.
Contribution of functional traits in habitat suitability modeling (H2)We used the Maxent algorithm (https://biodiversityinformatics.amnh.org/open_source/maxent/) as habitat suitability modeling to identify potential suitable area of invasion at a global scale based on the two datasets, namely abiotic data, and both functional trait data and abiotic data (Phillips et al., 2006). We constructed the sets of Maxent habitat suitability modeling following the recommendations of Merow et al. (2013); Radosavljevic and Anderson (2014), and Phillips et al. (2017) to produce a relatively low modeling complexity in order to minimize over-fitting. The detailed parameters used for Maxent modeling were as follows: (1) 2.0 was employed as the set of regularization multiplier to produce a smooth and general response shape, which represented a biologically realistic behavior because setting the regularization levels to two rather than the lower yielded values substantially can reduce overfitting; (2) we used 10,000 background points sampled randomly within a buffer of size at a radius of 500 km around occurrence points for each species (Fourcade et al., 2014). (3) the output of the Maxent modeling was set to complementary log-log (cloglog; Phillips et al., 2017); (4) a five-fold cross-validation approach with 80% of the occurrence data acting as the training set and the remaining 20% as the test set in each run of five replicates was applied to remove bias in the recorded occurrence points, thereby improving the robustness of the habitat suitability modeling (Merow et al., 2013). The results of the Maxent modeling produced habitat suitability ranging from 0 to 1 (Phillips et al., 2017). We used automatic features to assess the output of the Maxent algorithm as follows: (1) Linear + Quadratic features used for 10–79 occurrences; and (2) Hinge features were used for cases with more than 79 occurrences. The accuracy of the habitat suitability modeling was assessed using the area under the curve (AUC) of the receiver operating the characteristic plot, which was based on the calculation of the corresponding values of sensitivity and specificity (Phillips et al., 2006; 2017). Based on the cross-validation approach, five AUC assessments were used for the habitat suitability modeling of each IPS. In the current study, AUCs of all models were greater than 0.7 and considered for a good performance (Phillips et al., 2006; Merow et al., 2013; Table S1).
We used a jackknife method to assess the contribution of functional traits and abiotic variables to the habitat suitability of IPS under the Maxent algorithm constructed by both functional trait and abiotic data (Pearson et al., 2007; Phillips et al., 2006, 2017). The test removes one variable at a time and records the change in the chosen gain metric (Pearson et al., 2007). Each variable was excluded in turn, and a model was created with the remaining variables (Phillips et al., 2006). Each step of the Maxent algorithm increases the gain of the model by modifying the coefficient for a single feature, and the program assigns the increase in the gain to the environmental variable(s) that the feature depends on (Phillips et al., 2006). This is a heuristic approach to model importance in which the contribution values are determined by the increase in gain in the model provided by each variable (Phillips et al., 2006). The output format of the jackknife method showed the contribution of functional traits and abiotic variables to habitat suitability with values from 0 to 100%, with 0 representing the smallest contribution and 1 representing the largest (Pearson et al., 2007; Phillips et al., 2006; 2017). We used a five-fold cross-validation approach to run habitat suitability modeling across all 37 invasive species. In each run, the training and test occurrences are changed as the inputs of habitat suitability modeling. Hence, the contribution estimates were conducted five times based on different sets of invasive species occurrences for each IPS during the Maxent algorithm. We calculated the average values of the contribution of functional traits and abiotic variables to the habitat suitability of each IPS. Finally, we used simple and binary linear regression modeling to explore the relationship between functional trait contexts and habitat suitability for IPS across different biomes. Here, we used the linear regression modeling with coefficient of determination (R2) for further analysis.
IPS dependence of biomes (H3)We used suitable areas for IPS by effect sizes based on two datasets, namely abiotic data, and both functional trait and abiotic data, for assessing the effects of the dependence of the functional trait context on the habitat suitability of IPS at a global scale. The size of the effects was quantified using the log response ratio of habitat suitability values of grid cells as RR = ln (Yb/Ya), where, RR is the log response ratio of average habitat suitability values of grid cells for 37 IPS in each biome, and Yb and Ya are the average values of habitat suitability in a specific biome in both abiotic and biotic contexts, and the abiotic context, respectively. An ANOVA test was used to examine the significant difference of the average habitat suitability of IPS between the two datasets mentioned above, and for each IPS across different biomes.
All analyses were shown in Fig. 1, and conducted in QGIS (https://qgis.org/en/site/), ArcGIS 10.6 (https://www.esri.com/software/arcgis/arcgis-for-desktop), R environment (https://www.r-project.org/), and JMP 11.0 (https://www.jmp.com/zh_cn/home.html).
Results
In this study, significant differences of contexts were observed between traits (PC1) and abiotic conditions (PCs 2 and 3) for 37 IPS across 14 biomes (ANOVA tests: P < 0.05; Fig. 2 and Table S3). The context differences between traits and soils were the largest in Tropical and subtropical grasslands, savannas and shrublands, Flooded grasslands and savannas, and Montane grasslands and shrublands (Fig. 2 and Table S3). The differences between trait and climate contexts were larger in Tropical and subtropical moist broadleaf forests, Temperate grasslands, savannas and shrublands, Mediterranean forests, and woodlands and scrub (Fig. 2 and Table S3). Cinchona pubescens and Acacia mearnsii showed a significant difference between trait and soil contexts, and Cecropia peltate and Rubusel lipticus showed a significant difference between trait and climate contexts.
 across 37 IPS for 14 biomes at a global scale. Boxplot showed the mean (white line), 25% and 75% quartiles (box) for the log response ratio of context values. PC1 represents the functional trait context (i.e., biotic context), PC2 represents the soil context, and PC3 represents the climate context for IPS at a global scale. For each biome, the blue and red boxes represented the differences of average PC values between PC1 and PCs 2 and 3, respectively. Biome codes: 1: Tropical subtropical moist broadleaf forests; 2: Tropical subtropical dry broadleaf forests; 3: Tropical subtropical coniferous forests; 4: Temperate broadleaf mixed forests; 5: Temperate conifer forests; 6: Boreal forests/Taiga; 7: Tropical subtropical grasslands, savannas shrublands; 8: Temperate grasslands, savannas & shrublands; 9: Flooded grasslands & savannas; 10: Montane grasslands & shrublands; 11: Tundra; 12: Mediterranean forests, woodlands, & scrub; 13: Deserts xeric shrublands; 14: Mangroves. (For interpretation of the references to color in the figure legend, the reader is referred to the web version of this article.)")
Context comparison between traits and abiotic conditions (climates and soils) across 37 IPS for 14 biomes at a global scale. Boxplot showed the mean (white line), 25% and 75% quartiles (box) for the log response ratio of context values. PC1 represents the functional trait context (i.e., biotic context), PC2 represents the soil context, and PC3 represents the climate context for IPS at a global scale. For each biome, the blue and red boxes represented the differences of average PC values between PC1 and PCs 2 and 3, respectively. Biome codes: 1: Tropical subtropical moist broadleaf forests; 2: Tropical subtropical dry broadleaf forests; 3: Tropical subtropical coniferous forests; 4: Temperate broadleaf mixed forests; 5: Temperate conifer forests; 6: Boreal forests/Taiga; 7: Tropical subtropical grasslands, savannas shrublands; 8: Temperate grasslands, savannas & shrublands; 9: Flooded grasslands & savannas; 10: Montane grasslands & shrublands; 11: Tundra; 12: Mediterranean forests, woodlands, & scrub; 13: Deserts xeric shrublands; 14: Mangroves. (For interpretation of the references to color in the figure legend, the reader is referred to the web version of this article.)
Based on Maxent’s jackknife method for variable selection, it was found that temperature seasonality and annual precipitation had the largest contribution toward the habitat suitability of IPS (Fig. 3). Community mean functional traits were believed to contribute to the habitat suitability of IPS (Fig. 3). However, the contributions of height, LNC, SLA, and WD to habitat suitability of IPS could vary depending different plant species (Table S4). Specifically, community mean height had the largest contribution to the habitat suitability of Caulerpa taxifolia and Sphagneti colatrilobata (Fig. 3; Table S4). The fitted performances of binary linear regression modeling were better than simple linear regression modeling based on R2 values (Table 1). Hence, the results of binary linear regression model were used for further analyses (Table 1).
, 25% and 75% quartiles (box) for the log response ratio of context values across 37 IPS. Codes of functional trait and abiotic contexts: LNC: leaf nitrogen concentration; SLA: specific leaf area; WD: woody density; Bio1: annual mean temperature (°C × 10); Bio4: temperature seasonality (standard deviation × 100); Bio12: annual precipitation (mm); Bio15: precipitation seasonality (coefficient of variation); BLD: bulk density (kg/cubic meter); CECSOL: cation exchange capacity (cmolc/kg); CRFVOL: coarse fragments volumetric (%); OCDENS: soil organic carbon density (tonnes per ha); PHIHOX: soil pH; SLTPPT: soil texture fraction silt (%); HF: human footprint.")
Contribution of functional trait and abiotic contexts to the habitat suitability of 37 IPS. Boxplot showed the mean (white line), 25% and 75% quartiles (box) for the log response ratio of context values across 37 IPS. Codes of functional trait and abiotic contexts: LNC: leaf nitrogen concentration; SLA: specific leaf area; WD: woody density; Bio1: annual mean temperature (°C × 10); Bio4: temperature seasonality (standard deviation × 100); Bio12: annual precipitation (mm); Bio15: precipitation seasonality (coefficient of variation); BLD: bulk density (kg/cubic meter); CECSOL: cation exchange capacity (cmolc/kg); CRFVOL: coarse fragments volumetric (%); OCDENS: soil organic carbon density (tonnes per ha); PHIHOX: soil pH; SLTPPT: soil texture fraction silt (%); HF: human footprint.
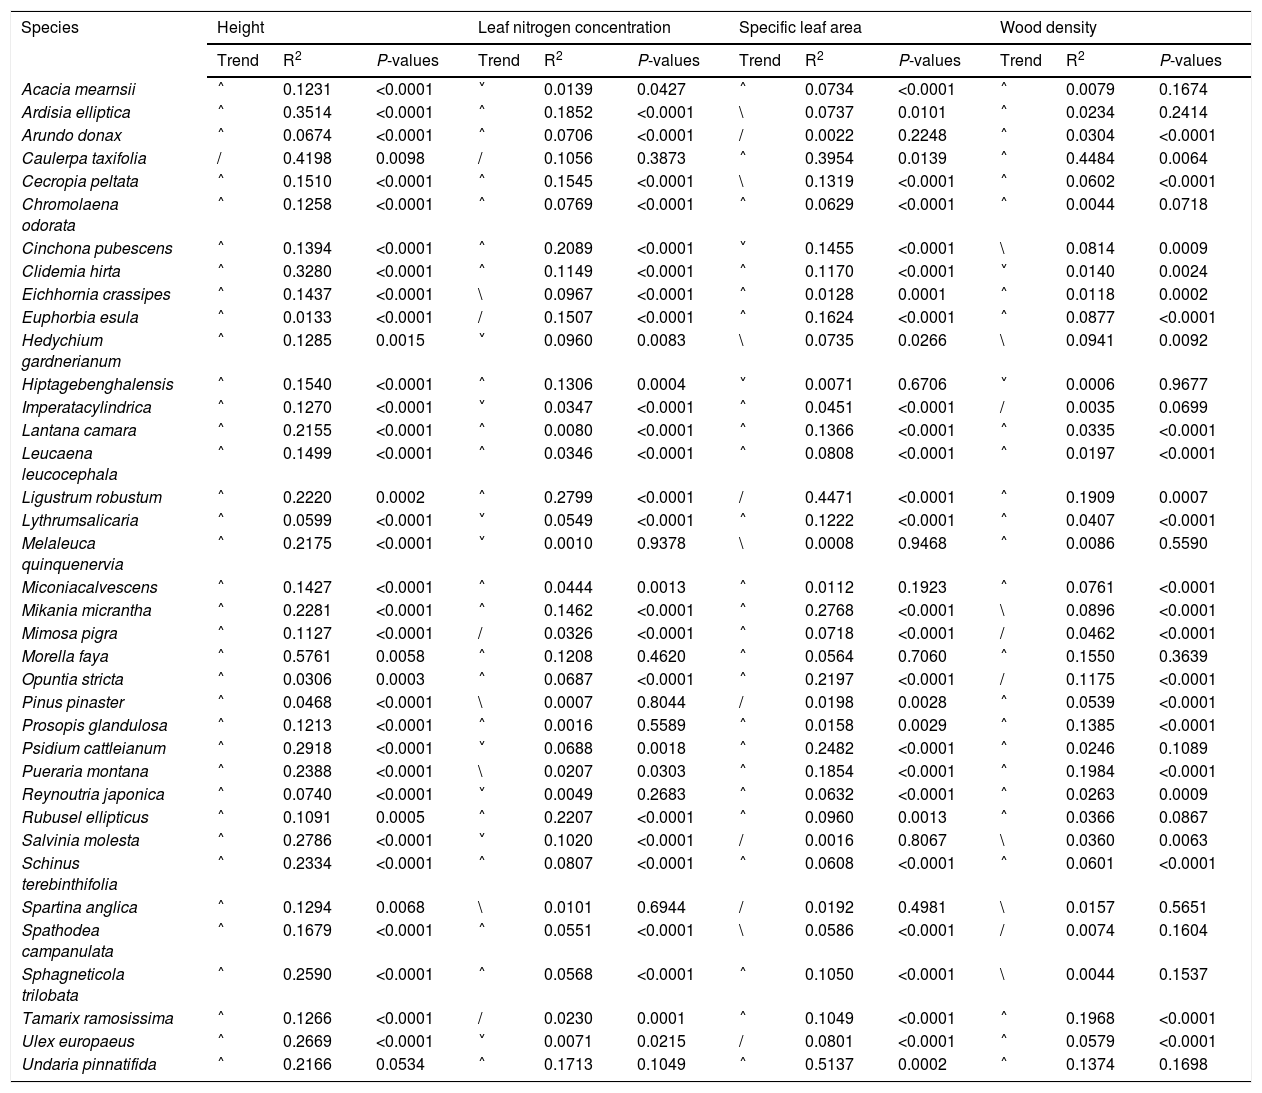
Relationships between community mean functional trait and habitat suitability for IPS at a global scale based on binary linear regression modellings.
| Species | Height | Leaf nitrogen concentration | Specific leaf area | Wood density | ||||||||
|---|---|---|---|---|---|---|---|---|---|---|---|---|
| Trend | R2 | P-values | Trend | R2 | P-values | Trend | R2 | P-values | Trend | R2 | P-values | |
| Acacia mearnsii | ˄ | 0.1231 | <0.0001 | ˅ | 0.0139 | 0.0427 | ˄ | 0.0734 | <0.0001 | ˄ | 0.0079 | 0.1674 |
| Ardisia elliptica | ˄ | 0.3514 | <0.0001 | ˄ | 0.1852 | <0.0001 | \ | 0.0737 | 0.0101 | ˄ | 0.0234 | 0.2414 |
| Arundo donax | ˄ | 0.0674 | <0.0001 | ˄ | 0.0706 | <0.0001 | / | 0.0022 | 0.2248 | ˄ | 0.0304 | <0.0001 |
| Caulerpa taxifolia | / | 0.4198 | 0.0098 | / | 0.1056 | 0.3873 | ˄ | 0.3954 | 0.0139 | ˄ | 0.4484 | 0.0064 |
| Cecropia peltata | ˄ | 0.1510 | <0.0001 | ˄ | 0.1545 | <0.0001 | \ | 0.1319 | <0.0001 | ˄ | 0.0602 | <0.0001 |
| Chromolaena odorata | ˄ | 0.1258 | <0.0001 | ˄ | 0.0769 | <0.0001 | ˄ | 0.0629 | <0.0001 | ˄ | 0.0044 | 0.0718 |
| Cinchona pubescens | ˄ | 0.1394 | <0.0001 | ˄ | 0.2089 | <0.0001 | ˅ | 0.1455 | <0.0001 | \ | 0.0814 | 0.0009 |
| Clidemia hirta | ˄ | 0.3280 | <0.0001 | ˄ | 0.1149 | <0.0001 | ˄ | 0.1170 | <0.0001 | ˅ | 0.0140 | 0.0024 |
| Eichhornia crassipes | ˄ | 0.1437 | <0.0001 | \ | 0.0967 | <0.0001 | ˄ | 0.0128 | 0.0001 | ˄ | 0.0118 | 0.0002 |
| Euphorbia esula | ˄ | 0.0133 | <0.0001 | / | 0.1507 | <0.0001 | ˄ | 0.1624 | <0.0001 | ˄ | 0.0877 | <0.0001 |
| Hedychium gardnerianum | ˄ | 0.1285 | 0.0015 | ˅ | 0.0960 | 0.0083 | \ | 0.0735 | 0.0266 | \ | 0.0941 | 0.0092 |
| Hiptagebenghalensis | ˄ | 0.1540 | <0.0001 | ˄ | 0.1306 | 0.0004 | ˅ | 0.0071 | 0.6706 | ˅ | 0.0006 | 0.9677 |
| Imperatacylindrica | ˄ | 0.1270 | <0.0001 | ˅ | 0.0347 | <0.0001 | ˄ | 0.0451 | <0.0001 | / | 0.0035 | 0.0699 |
| Lantana camara | ˄ | 0.2155 | <0.0001 | ˄ | 0.0080 | <0.0001 | ˄ | 0.1366 | <0.0001 | ˄ | 0.0335 | <0.0001 |
| Leucaena leucocephala | ˄ | 0.1499 | <0.0001 | ˄ | 0.0346 | <0.0001 | ˄ | 0.0808 | <0.0001 | ˄ | 0.0197 | <0.0001 |
| Ligustrum robustum | ˄ | 0.2220 | 0.0002 | ˄ | 0.2799 | <0.0001 | / | 0.4471 | <0.0001 | ˄ | 0.1909 | 0.0007 |
| Lythrumsalicaria | ˄ | 0.0599 | <0.0001 | ˅ | 0.0549 | <0.0001 | ˄ | 0.1222 | <0.0001 | ˄ | 0.0407 | <0.0001 |
| Melaleuca quinquenervia | ˄ | 0.2175 | <0.0001 | ˅ | 0.0010 | 0.9378 | \ | 0.0008 | 0.9468 | ˄ | 0.0086 | 0.5590 |
| Miconiacalvescens | ˄ | 0.1427 | <0.0001 | ˄ | 0.0444 | 0.0013 | ˄ | 0.0112 | 0.1923 | ˄ | 0.0761 | <0.0001 |
| Mikania micrantha | ˄ | 0.2281 | <0.0001 | ˄ | 0.1462 | <0.0001 | ˄ | 0.2768 | <0.0001 | \ | 0.0896 | <0.0001 |
| Mimosa pigra | ˄ | 0.1127 | <0.0001 | / | 0.0326 | <0.0001 | ˄ | 0.0718 | <0.0001 | / | 0.0462 | <0.0001 |
| Morella faya | ˄ | 0.5761 | 0.0058 | ˄ | 0.1208 | 0.4620 | ˄ | 0.0564 | 0.7060 | ˄ | 0.1550 | 0.3639 |
| Opuntia stricta | ˄ | 0.0306 | 0.0003 | ˄ | 0.0687 | <0.0001 | ˄ | 0.2197 | <0.0001 | / | 0.1175 | <0.0001 |
| Pinus pinaster | ˄ | 0.0468 | <0.0001 | \ | 0.0007 | 0.8044 | / | 0.0198 | 0.0028 | ˄ | 0.0539 | <0.0001 |
| Prosopis glandulosa | ˄ | 0.1213 | <0.0001 | ˄ | 0.0016 | 0.5589 | ˄ | 0.0158 | 0.0029 | ˄ | 0.1385 | <0.0001 |
| Psidium cattleianum | ˄ | 0.2918 | <0.0001 | ˅ | 0.0688 | 0.0018 | ˄ | 0.2482 | <0.0001 | ˄ | 0.0246 | 0.1089 |
| Pueraria montana | ˄ | 0.2388 | <0.0001 | \ | 0.0207 | 0.0303 | ˄ | 0.1854 | <0.0001 | ˄ | 0.1984 | <0.0001 |
| Reynoutria japonica | ˄ | 0.0740 | <0.0001 | ˅ | 0.0049 | 0.2683 | ˄ | 0.0632 | <0.0001 | ˄ | 0.0263 | 0.0009 |
| Rubusel ellipticus | ˄ | 0.1091 | 0.0005 | ˄ | 0.2207 | <0.0001 | ˄ | 0.0960 | 0.0013 | ˄ | 0.0366 | 0.0867 |
| Salvinia molesta | ˄ | 0.2786 | <0.0001 | ˅ | 0.1020 | <0.0001 | / | 0.0016 | 0.8067 | \ | 0.0360 | 0.0063 |
| Schinus terebinthifolia | ˄ | 0.2334 | <0.0001 | ˄ | 0.0807 | <0.0001 | ˄ | 0.0608 | <0.0001 | ˄ | 0.0601 | <0.0001 |
| Spartina anglica | ˄ | 0.1294 | 0.0068 | \ | 0.0101 | 0.6944 | / | 0.0192 | 0.4981 | \ | 0.0157 | 0.5651 |
| Spathodea campanulata | ˄ | 0.1679 | <0.0001 | ˄ | 0.0551 | <0.0001 | \ | 0.0586 | <0.0001 | / | 0.0074 | 0.1604 |
| Sphagneticola trilobata | ˄ | 0.2590 | <0.0001 | ˄ | 0.0568 | <0.0001 | ˄ | 0.1050 | <0.0001 | \ | 0.0044 | 0.1537 |
| Tamarix ramosissima | ˄ | 0.1266 | <0.0001 | / | 0.0230 | 0.0001 | ˄ | 0.1049 | <0.0001 | ˄ | 0.1968 | <0.0001 |
| Ulex europaeus | ˄ | 0.2669 | <0.0001 | ˅ | 0.0071 | 0.0215 | / | 0.0801 | <0.0001 | ˄ | 0.0579 | <0.0001 |
| Undaria pinnatifida | ˄ | 0.2166 | 0.0534 | ˄ | 0.1713 | 0.1049 | ˄ | 0.5137 | 0.0002 | ˄ | 0.1374 | 0.1698 |
Trend represented the changing trends of habitat suitability with increasing community means of functional trait. / indicated that the relationship between community mean functional trait and habitat suitability were positive, and vice versa for \; ˄ indicated the relationship between community mean functional trait and habitat suitability were unimodal, namely, positive and then negative, and vice versa.
The binary linear regression modeling established a significant relationship between community mean height and habitat suitability compared to the relationship between SLA, LNC, and WD, and habitat suitability for IPS at a global scale (Table 1). A significant relationship was noted between community mean height and habitat suitability for Morella faya (R2 = 0.5761; P < 0.01), Caulerpa taxifolia (R2 = 0.4198; P < 0.01), Ardisia elliptica (R2 = 0.3514; P < 0.01), and Clidemia hirta (R2 = 0.3280; P < 0.01; Table 1). Community mean LNC was significantly related to the habitat suitability of Ligustrum robustum (R2 = 0.2799; P < 0.01), Rubusel lipticus (R2 = 0.2207; P < 0.01), and Cinchona pubescens (R2 = 0.2089; P < 0.01; Table 1). The responses of habitat suitability to community mean LNC were unimodal, being positive in the beginning and then negative for Ligustrum robustum, Rubusel lipticus, and Cinchona pubescens (Table 1). The relationships between SLAs and habitat suitability were found to be significant for Undaria pinnatifida (R2 = 0.5137; P < 0.01), Ligustrum robustum (R2 = 0.4471; P < 0.01), and Caulerpa taxifolia (R2 = 0.3954; P < 0.01; Table 1). WD was largely related to the habitat suitability of Caulerpa taxifolia (R2 = 0.4484; P < 0.01; Table 1). For most of the IPS, the responses of habitat suitability to community mean functional traits, particularly height, were found to be unimodal, being positive in the beginning and then negative (Table 1).
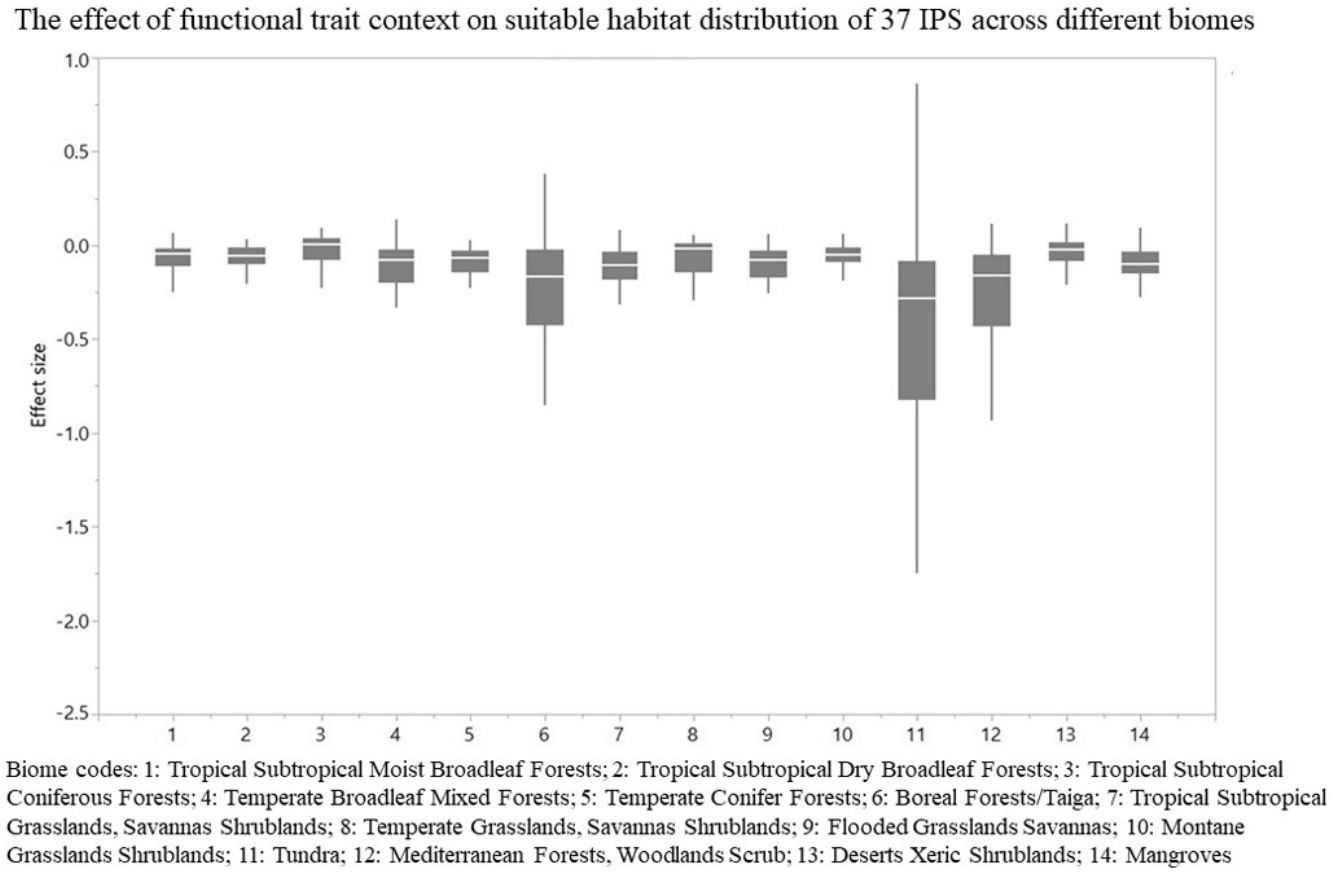
For each IPS, there were significant differences in the average habitat suitability of IPS between the functional trait data and abiotic data mentioned above (Fig. 4). For example, these significant differences existed for Morella faya, Ligustrum robustum, Undaria pinnatifida, and Caulerpa taxifolia (Fig. 5). For all 14 biomes the average habitat suitability of grid cells was significantly higher for all 37 invasive species based on both functional trait and abiotic data, compared to abiotic data only (ANOVA tests: P < 0.05; Figs. 4 and 6). The IPS had the highest habitat suitability in Tropical and subtropical moist broadleaf forests, Tropical and subtropical dry broadleaf forests, and Tropical and subtropical coniferous forests based on two habitat suitability models, using both functional trait and abiotic data, compared to using abiotic data only (Fig. 5). The result therefore indicated that functional trait context dependence could affect the habitat suitability of IPS (ANOVA tests: P < 0.05; Fig. 5). The functional trait context could have the largest effects on the habitat suitability of IPS in Boreal forests/Taiga, Tropical and subtropical grasslands, savannas and shrublands, Tundra, Mediterranean forests, woodlands and scrub, and Mangroves (Fig. 6).
 and abiotic contexts across 37 IPS at a global scale. Boxplot showed the mean (white line), 25% and 75% quartiles (box) for the log response ratio of context values across 37 IPS. The blue and red boxplots represented habitat suitability under abiotic context, and both biotic (i.e., functional trait) and abiotic contexts across 37 IPS at a global scale. Biome codes: 1: Tropical subtropical moist broadleaf forests; 2: Tropical subtropical dry broadleaf forests; 3: Tropical subtropical coniferous forests; 4: Temperate broadleaf mixed forests; 5: Temperate conifer forests; 6: Boreal forests/Taiga; 7: Tropical subtropical grasslands, savannas shrublands; 8: Temperate grasslands, savannas & shrublands; 9: Flooded grasslands & savannas; 10: Montane grasslands & shrublands; 11: Tundra; 12: Mediterranean forests, woodlands, & scrub; 13: Deserts xeric shrublands; 14: Mangroves. (For interpretation of the references to color in the figure legend, the reader is referred to the web version of this article.)")
Biome comparison of habitat suitability under abiotic context, and both biotic (i.e., functional trait) and abiotic contexts across 37 IPS at a global scale. Boxplot showed the mean (white line), 25% and 75% quartiles (box) for the log response ratio of context values across 37 IPS. The blue and red boxplots represented habitat suitability under abiotic context, and both biotic (i.e., functional trait) and abiotic contexts across 37 IPS at a global scale. Biome codes: 1: Tropical subtropical moist broadleaf forests; 2: Tropical subtropical dry broadleaf forests; 3: Tropical subtropical coniferous forests; 4: Temperate broadleaf mixed forests; 5: Temperate conifer forests; 6: Boreal forests/Taiga; 7: Tropical subtropical grasslands, savannas shrublands; 8: Temperate grasslands, savannas & shrublands; 9: Flooded grasslands & savannas; 10: Montane grasslands & shrublands; 11: Tundra; 12: Mediterranean forests, woodlands, & scrub; 13: Deserts xeric shrublands; 14: Mangroves. (For interpretation of the references to color in the figure legend, the reader is referred to the web version of this article.)
, Ligustrum robustum (c and d), Undaria pinnatifida (e and f), and Caulerpa taxifolia (g and h) under abiotic context, and both biotic (i.e., height, leaf nitrogen concentration, specific leaf area, and woody density) and abiotic contexts. The color from blue to red represented the increasing habitat suitability of IPS at a global scale. (For interpretation of the references to color in the figure legend, the reader is referred to the web version of this article.)")
Habitat suitability maps of Morella faya (a and b), Ligustrum robustum (c and d), Undaria pinnatifida (e and f), and Caulerpa taxifolia (g and h) under abiotic context, and both biotic (i.e., height, leaf nitrogen concentration, specific leaf area, and woody density) and abiotic contexts. The color from blue to red represented the increasing habitat suitability of IPS at a global scale. (For interpretation of the references to color in the figure legend, the reader is referred to the web version of this article.)
, 25% and 75% quartiles (box) for the log response ratio of context values across 37 IPS. Biome codes: 1: Tropical subtropical moist broadleaf forests; 2: Tropical subtropical dry broadleaf forests; 3: Tropical subtropical coniferous forests; 4: Temperate broadleaf mixed forests; 5: Temperate conifer forests; 6: Boreal forests/Taiga; 7: Tropical subtropical grasslands, savannas shrublands; 8: Temperate grasslands, savannas & shrublands; 9: Flooded grasslands & savannas; 10: Montane grasslands & shrublands; 11: Tundra; 12: Mediterranean forests, woodlands, & scrub; 13: Deserts xeric shrublands; 14: Mangroves.")
The effect of functional trait context on suitable habitat distribution of 37 IPS across different biomes at a global scale based on effect sizes. Boxplot showed the mean (white line), 25% and 75% quartiles (box) for the log response ratio of context values across 37 IPS. Biome codes: 1: Tropical subtropical moist broadleaf forests; 2: Tropical subtropical dry broadleaf forests; 3: Tropical subtropical coniferous forests; 4: Temperate broadleaf mixed forests; 5: Temperate conifer forests; 6: Boreal forests/Taiga; 7: Tropical subtropical grasslands, savannas shrublands; 8: Temperate grasslands, savannas & shrublands; 9: Flooded grasslands & savannas; 10: Montane grasslands & shrublands; 11: Tundra; 12: Mediterranean forests, woodlands, & scrub; 13: Deserts xeric shrublands; 14: Mangroves.
Based on maps of functional trait and abiotic contexts, we have provided evidence for the effects of functional trait contexts on suitable habitat distributions of IPS at a global scale. Habitat suitability modeling has been widely used in the modeling of suitable habitat distributions of IPS across different spatial scales from community-wide to global scales based on abiotic contexts (Bradley et al., 2010; Gallardo et al., 2015; Allen and Bradley, 2016; Chapman et al., 2016; Shrestha and Shrestha, 2019; Christina et al., 2020). Chamberlain et al. (2014) showed that community contexts could have a regulating net effect on the interspecific interactions of individuals and populations by trait-mediated ways. A BAM diagram of niche modeling indicates that suitable habitat distribution is related to a species’ biotic interaction (B), its abiotic environment (A), and the motility and accessible area (Soberón and Nakamura, 2009; Soberón, 2010; Barve et al., 2011; Peterson, 2011). An M hypothesis may be established for IPS in the presence of human activities such as economic use and ornamental trade (Barve et al., 2011). B and A hypotheses should be considered for modeling IPS distributions using ecological niche models. Our study considered the effects of both B and A on species distributions and integrated M into the modeling based on species occurrence intensity buffer. Based on the Eltonian noise hypothesis, Eltonian factors (e.g., competition) may not affect spatial distributions at the large extents and low resolutions characteristic of geographic distribution maps (Soberón and Nakamura, 2009). However, recent studies (e.g., Rödder and Engler, 2011; De Araújo et al., 2014; Alvarez-Martínez et al., 2015; Simões and Peterson, 2018; Jenkins et al., 2020) have provided evidence of the contribution of species interactions and competition to invasive species on large geographic scales. Biotic interaction (or the B hypothesis) could affect the prediction of IPS distributions (Soberón and Nakamura, 2009; Soberón, 2010; Peterson, 2011). Therefore, the functional trait context plays an important role in the biotic interactions between native and invasive plant species across different spatial scales. However, most studies (e.g., Bradley et al., 2010; Gallardo et al., 2015; Allen and Bradley, 2016; Chapman et al., 2016) have projected the IPS distribution and assessed the invasion risk by considering the A hypothesis only. It is however necessary to integrate biotic interaction into habitat suitability modeling for studying plant invasion, in line with the findings of the present study.
Many previous studies (e.g., Diaz et al., 1998; Ordoñez et al., 2009; Bruelheide et al., 2018; Šímová et al., 2018; Wieczynski et al., 2019) have shown that abiotic factors (e.g., climatic factors) may shape a plant’s functional trait diversity and variation on large spatial scales. Plants’ functional traits have exhibited consistent effects on the coexistence and competition among plant species at a global scale (Kunstler et al., 2016). Furthermore, a functional trait context could contribute to the ability of native plant species and communities to resist plant invasion (Mason et al., 2012; Adler et al., 2013; Kunstler et al., 2016; Gross et al., 2017). Functional trait differences and trait plasticity mediate biotic resistance to potential plant invaders (Conti et al., 2018). The competitive suppression of growth and reproduction of the IPS may be affected by the functional trait context in the case of native plant communities (Kunstler et al., 2016; Conti et al., 2018). Moreover, resource availability and watering conditions can affect plant invasion in the functional trait context (Hierro and Callaway, 2003; Hulvey and Teller, 2018; Chen et al., 2019). High functional trait diversity could enhance the ability of native plant species to utilize available resources and water (Gross et al., 2017; Canessa et al., 2018; Conti et al., 2018). Our results also revealed that the functional trait context could affect the habitat suitability of IPS at a global scale. The traits (e.g., SLA and LNC) are related to water potential and gas exchange, and nitrogen allocation and conservation (Díaz et al., 2016; Gross et al., 2017; Bruelheide et al., 2018; Šímová et al., 2018; Wieczynski et al., 2019). Thus, native plant species may have advantages in water and nitrogen intake compared to the non-native species (Mason et al., 2012; Adler et al., 2013; Díaz et al., 2016; Kunstler et al., 2016; Gross et al., 2017; Bruelheide et al., 2018; Wieczynski et al., 2019). Hence, this proves the impact of the functional trait context on the suitable habitat distributions of IPS amidst the competition of native species at a global scale.
The community means represent plant community average trait values, thereby making the values not directly transferable to a specific individual or class of species (Boonman et al., 2020). It could also represent a functional trait context at a global scale (Boonman et al., 2020). The current study results show that there was a significant relationship between community mean functional traits and habitat suitability for invasive plants, thus indicating that functional trait context dependence could affect habitat suitability of IPS at a global scale. Furthermore, the responses of habitat suitability to community mean functional traits varied depending on different IPS. It was found that the responses of the habitat suitability of IPS to community mean functional traits, particularly, height, were unimodal, namely, positive and then negative, thus indicating that IPS needed moderate community mean functional traits. Hence, it can be stated that the high community mean could enhance the resistance of native communities to plant invasion. The study also found that height may be a good predictor of the habitat suitability of IPS at a global scale. Height may be associated with whole-plant fecundity and the facilitation of seed dispersal (Moles et al., 2009; Díaz et al., 2016; Stovall et al., 2019). Thus, a large increase in the vegetation height could regulate the resistance of native communities to plant invasion. The four functional traits (i.e., height, LNC, SLA, and WD) could contribute to ecosystem functioning and services (Díaz et al., 2007; Lavorel, 2013; Gross et al., 2017). Some studies (e.g., Funk et al., 2008; Gross et al., 2017; Byun et al., 2018) have shown that ecosystem restoration should be based on the ecosystem functioning recovery from the perspective of a functional trait context. Indeed, plant functional trait diversity can maximize ecosystem multifunctionality (Gross et al., 2017). Hence, the advantages of plant functional trait recovery may have a function in allowing native ecosystems to resist plant invasion in the context of high community mean functional traits (i.e., height, LNC, SLA, and WD).
We found that functional trait contexts could have a great impact on the habitat suitability of IPS on large spatial scales. Such effects may depend on the type of biome. This study provides references for the application of habitat suitability modeling on the habitat suitability of IPS taking into consideration the plant functional trait context. We found that the functional trait context could have the largest effects on the habitat suitability of IPS in Boreal forests/Taiga, Tropical and subtropical grasslands, savannas and shrublands, Tundra, Mediterranean forests, woodlands and scrub, and Mangroves. Functional trait contexts should be considered in habitat suitability modeling for plant invasion assessments in these biomes. Habitat suitability modeling could project suitable habitat distributions of IPS for invasion risk assessments based on occurrence records and, both biotic and abiotic variables. However, we found that the habitat suitability of IPS was significantly higher based on abiotic data than both functional trait and abiotic data. Based on the BAM diagram, the B, A, and M hypotheses could support the prediction accuracy of habitat suitability modeling for IPS (Soberón and Nakamura, 2009; Soberón, 2010; Barve et al., 2011; Peterson, 2011). Many studies (e.g., Jiménez-Valverde et al., 2011; O’Donnell et al., 2012; Bellard et al., 2013; Chapman et al., 2016) used habitat suitability to assess plant invasion risk at spatial scales based on abiotic factors (e.g., climate and soil; A hypothesis). The buffer of occurrence records can be used to assess the motility and accessible area in our study. However, B hypothesis was limited for consideration for large-scale plant invasion risk. Functional traits (height, LNC, SLA, and WD) are related to biotic interactions (Díaz et al., 2016). To a certain degree of the B hypothesis based on the BAM diagram, we provided an approach to integrate functional traits into habitat suitability modeling to avoid over-estimations of habitat suitability modeling on the suitable habitat distributions of IPS. Previous studies (e.g., Moles et al., 2009; Jiménez-Valverde et al., 2011; Lamanna et al., 2014; Butler et al., 2017; Šímová et al., 2018) have developed effective approaches to map the distribution patterns of plant functional trait contexts. For example, Butler et al. (2017) mapped local and global variability in plant trait distributions. Particularly, the plant functional trait context should be included in modeling suitable habitat distributions of IPS in the 14 biomes.
CaveatsAlthough our study provides implications for modeling the suitable habitat distributions of IPS, there may be two limitations: (1) In our study, we did not identify differences of functional trait contexts between native and invasive plant species. However, the differences in functional traits between native and invasive plant species may change species interaction and competition, as well as resource availability, which have a large potential to affect the plant invasion process. Hence, future studies should identify the differences of functional trait contexts between native and invasive plant species on small spatial scales. Furthermore, the effects of the functional traits of native and invasive plant species on habitat suitability should be integrated into modeling suitable habitat distribution of IPS on large geographical scales. (2) We should take global trade and economic use into consideration effectively for modeling the suitable habitat distributions of IPS on the global scale. Global trade and economic use can drive the expansion of IPS on global scales. Hence, future studies should explore ways of integrating global trade and economic use into the distribution prediction of IPS around the world.
ConclusionsThe study concluded that functional trait context dependence could affect suitable habitat distributions of invasive plant species at a global scale, indicating that functional trait context should be used as the input for modeling habitat suitability of IPS. Plant functional traits including height, LNC, SLA, and WD may be independent as biotic contexts from abiotic context for plant invasion. We suggested to use community mean functional traits, particularly, height to predict suitable habitat distributions of IPS at large spatial scales. This study could support the performance improvement of habitat suitability modeling for risk assessment on plant invasion. Future studies should integrate plant functional trait context into modeling suitable habitat distributions of IPS at large spatial scales.
Conflict of interest statementAll the authors have approved the manuscript and agree with submission to your esteemed journal. There are no conflicts of interest to declare.
Data availability statementAll the data used in this manuscript are publicly available and sources described in the text. Species data are available from the following download links of GBIF as shown as Table S1.
Author contributionsCJW and JZW designed the research. JZW analyzed the data, and CJW wrote the article.
Many thanks for helpful and insightful comments of the editor and two anonymous reviewers on earlier drafts of the manuscript. This work has been supported by the Basic Research Project of Qinghai Province, China (2019-ZJ-936Q), the National Natural Science Foundation of China (Nos. 31800464 and 31800449), and the Ten Thousand Talent Program of Qinghai Province.
The following is Supplementary data to this article:

