


The rapid land use change in tropical forests is a severe threat to Earth nature’s contributions to people (NCPs) and biodiversity. Effectively conserving ecosystems is a global target that requires clearly prioritizing areas that provide multiple benefits. The goal of this study is to identify potential NCPs and biodiversity hotspots of forest and evaluate their single and multiple representativeness within the Protection Areas (PA) in Peru. To do so we (1) analyzed the spatial distribution of three NCPs indicators at national and regional scales (carbon stock and sequestration in two components aboveground carbon density and soil organic carbon stock, water balance and erosion control) and one biodiversity indicator (biodiversity relative priority index) and identified their hotspots areas; (2) identified the single and overlapped hotspot areas within PAs; (3) identified synergies and trade-off among indicators. Our analysis shows that the distribution of NCPs and biodiversity varied across regions. Most hotspot areas were in the High and Not Flooded Rainforest regions due to favorable conditions for vegetation and lower levels of anthropic transformation. We found that the current PAs inadequately protect a significant percentage of hotspots, with few overlap areas. Synergies may shift to trade-offs at different scales or among regions, meaning a conservation plan solely focused on biodiversity cannot adequately preserve NCPs. Furthermore, multiple hotspot areas cannot be conserved in a single location, emphasizing the importance of hotspot identification as the first step towards achieving multifunctional PAs. Our analysis offers recommendations for achieving multifunctional PAs that can apply to megadiverse countries.
The world’s forests carry out fundamental ecological functions that are direct and indirect determinants of human well-being, widely known as ecosystem services (ES) (Millennium Ecosystem Assessment, 2005) or, in the recent evolution of the term, as nature’s contributions to people (NCPs). NCPs are a broader conception of coproduced contributions by nature and people through different worldviews and knowledge (Díaz et al., 2015; IPBES, 2017). Forty-four per cent of global forest area is found in tropical countries (Keenan et al., 2015). Tropical forests contain most of the world's biodiversity and produce a large number of NCPs (Foley et al., 2007). They provide 50% of carbon stored in plant biomass (Abbas et al., 2020) and 32% in the soil (Pan et al., 2011). Furthermore, the interference of water balance through evapotranspiration and moisture recycling are among the major contributions of rainforests (Weng et al., 2018) and, in these ecosystems, vegetation and litter cover controls water erosion. Although the role of biodiversity (in this case forests) in supplying these and other NCPs has been demonstrated, i.e., the interdependence between biodiversity and NCPs, the effectiveness of actions to confront the impacts of current land-use trends is unclear and does not yet guarantee human well-being and the fulfillment of the sustainability agenda (Guerry et al., 2015; Manes et al., 2022).
The spatial distribution of NCPs and biodiversity is a function of biophysical conditions and land uses and varies across spatial scales (Bastian, 2013). Moreover, the relationships between NCPs and biodiversity, as well as between different NCPs, are complex and also differ according to the scale of the analysis (global, national, or subnational/regional) and the biomes (Lecina-Diaz et al., 2018; Steur et al., 2020). Although the scale of analysis affects the relationships between NCPs and biodiversity, this effect have been poorly analyzed and understood in tropical forests (Steur et al., 2020). The relationship between NCPs and biodiversity can be characterized as either a synergy, where both increase or decrease together, or a tradeoff, where an increase in one results in a decrease in the other (Vallet et al., 2018). It is important to analyze both the spatial coincidence and the relationship between NCPs and biodiversity together, as the spatial match between them does not necessarily indicate an increase or decrease in either (Davids et al., 2016).
Protected Areas (PAs) are widely considered essential for the conservation of biodiversity and provision of vital NCPs (Jung et al., 2021). Aichi Target 11 of the Strategic Plan for Biological Diversity 2011–2020 of the Convention on the Biological Diversity (CBD) established that PAs and Other Effective Conservation Measures (OECMs) should increase to 17% of terrestrial and inland water areas by 2020 (CBD, 2020). This target increased to 30% in the new Global Biodiversity Framework adopted in 2022 (CBD, 2022). The protection of NCPs and their interaction with biodiversity has only recently been included in conservation planning (Bastian, 2013; Jung et al., 2021). The representation of biodiversity in PAs has been widely evaluated globally, and in tropical areas in particular (Lee and Abdullah, 2019). Studies that focus on the representation of NCPs in PAs are few: some focus on evaluating the representation of a single NCP (Tang et al., 2011), while others focus on multiple NCPs (Mitchell et al., 2021; Pellegrini Manhães et al., 2016). Currently, no single indicator assesses protected area coverage of areas with more NCPs at the global level (Gannon et al., 2019) nor how the degree of protection influences the NCPs they provide (Lecina-Diaz et al., 2019). However, the effectiveness of PAs in the provision of multiple NCPs has been highlighted in many cases (Lecina-Diaz et al., 2019): carbon storage, water regulation and climate regulation. Few of the analyses of the spatial coincidences and the relationship between NCPs and biodiversity hotspots and the PA network are in South America (but see Armenteras et al., 2015; Pellegrini Manhães et al., 2016; Silveira et al., 2019). These studies identified the exclusion of significant areas in the PA network and highlighted the importance of NCPs mapping for planning PAs and carrying out conservation management.
Peru is a megadiverse country with a privileged forest cover, ranking ninth in the world and second in South America after Brazil (FAO, 2020). Peru is also one of the three countries with the largest area of protected forests in South America (FAO, 2020). In addition, currently Peru does not have national maps of NCPs or assessments with multiple NCPs at the national scale. This is probably one of the first studies to aim to analyze the spatial distribution of potential NCPs and biodiversity of forests and shrublands at different scales in Peru. Furthermore, we will identify single and overlapped NCPs and biodiversity hotspot areas (i.e., areas with the highest NCPs or biodiversity values in Peru) within and outside the current system of terrestrial protected areas (Sistema Nacional de Áreas Naturales Protegidas del Peru-SINANPE) in Peru. We ask the following questions: (1) How is the distribution of NCPs and biodiversity hotspots in Peru? (2) Are current protected areas effectively protecting them? (3) Can a biodiversity-focused conservation plan adequately preserve multiple NCPs in a megadiverse country? To answer these questions, we have analyzed at national and regional scale three potential indicators (carbon stock and sequestration divided on two complementary components, aboveground carbon density -ACD- and soil organic carbon stock -SOC-, water balance -WB- and erosion control -EC-) and one biodiversity indicator (biodiversity relative priority index -BD-), all of them considered as important NCPs in Peru, as recognized by the Law on Retribution Mechanisms for Ecosystem Services (MRSE, Law No. 30215).
Materials and methodsStudy areaThe study was carried out in Peru, a tropical country located at the central-western of South America in the Pacific coastline (borders at 0°02’ 00’’ North, 18°21’ 03’’ South, 68°39’ 00’’ East and 81°19’ 35’’ West). Peru covers approximately 1.28 million km2 in continental area, the third-largest country in South America after Brazil and Argentina (Fig. 1a). Around 60% of the Peruvian surface is covered by forests and shrublands, more than 90% corresponding to the Amazonia (FAO, 2020), the ecosystems considered in our study. The altitudinal range goes from the sea level to more than 6 000 m on the highest peaks of the Andes Mountains (IGN, 2021), which provides a wide range of temperature (−13.6–33.1 °C) (Fig. A6d) and precipitation (0–6 398 mm) (Fig. A5a) associated with elevation (Fig. A2). Peru has a high heterogeneous climate, geomorphology, physiography and ecosystem composition. Moreover, it is a megadiverse country with 84 of the 104 described life zones (Reynel et al., 2013). Thus, the number of vertebrate species reported is 1 755 birds, 494 mammals, 477 reptiles and 524 amphibians (MOL, 2021). The five regions considered here differed in its ecologies. The Coast Region is in the northern extreme of Peru. The climate is hot and dry. The Equatorial Countercurrent determines the seasonal precipitation. Seasonal dry forests and xeric scrublands are the main covers. They are distributed from the sea level to approximately 1,500 or 2,000 m in the mountains and along watercourses. The Andean Region extends throughout the national territory, being wider and higher in the center and south (Fig. A.2). The climate ranges from semi-warm arid to cold wet or cold dry. Scrublands (woody, shrubby, and cactus vegetation of variable composition and structure) are the main covers from 1,500 to 4,500 m. Inter-Andean seasonally dry and relict forests have a restricted distribution in the region. The High Rainforest Region or Yunga is on the eastern flank of the Andes Mountains, from 600 to approximately 3,600 m. The ecosystems are humid or sub-humid dense mountain forests with strong slopes (Fig. A.2 and A.3), in some areas with permanent fog. The Low Rainforest or Amazon Rainforest is a humid and rainy forest of the Amazon plain with a dry season in the southern zone (June–July). The flooded rainforest (d) and not flooded rainforest (e) were analyzed separately throughout the manuscript. The flooded rainforest is mainly composed by floodplain alluvial forests (flooded several meters during the river crescent) and palm wetlands (permanently or nearly permanently water-saturated). The Not Flooded Rainforest (7 ecosystems; 47.9% of the whole surface) is also located in the Amazon plain, and it is mainly composed by hill and terrace forests.
Data setsRegions Distribution of forests by regions considering terrestrial PAs (b) Distribution of forests by protection degree. The Coast and Andean regions also included shrublands.")
We focused our study on the 24 ecosystems, mainly forests, following the definition by MINAM (2019). In addition, because the high and historically forests transformation on the Coast and Andean regions we included shrublands ecosystem in these regions (Portillo-Quintero and Sánchez-Azofeifa, 2010; Schröder et al., 2021; Sylvester et al., 2017). We grouped these ecosystems in five regions (MINAM, 2019; Reynel et al., 2013; Fig. 1a and b): Coast (6 ecosystems; 4.1% of the whole surface); Andean (5; 13.0%); High Rainforest (3; 17.8%); Not Flooded Rainforest (3; 17.2%) and Flooded Rainforest (7; 47.9%) (see Table A1 for more information).
Protected areasWe have obtained the information of all terrestrial PAs in Peru (248 PAs, 17.7% of the national surface) (SERNANP-MINAM, 2021). Then, we have classified the whole Peruvian surface depending on their degree of protection in four categories using a vector data of SERNANP-MINAM (scale 1:100 000): strictly protected areas with indirect use- PA1 (areas with non-manipulative uses; 28 PAs; 12% of forest and shrubland surface); (b) protected areas with direct use- PA2 (areas with management of natural resources; 66; 10.6%); (c) other protected areas- PA3 (154; 0.9%); (d) unprotected areas (76.5% of forest and shrubland surface) (Fig. 1b and c and Table A2; SERNANP-MINAM, 2009). A more detailed explanation of Peruvian’s Protection Categories is provided in the Supplementary Material (Table A3).
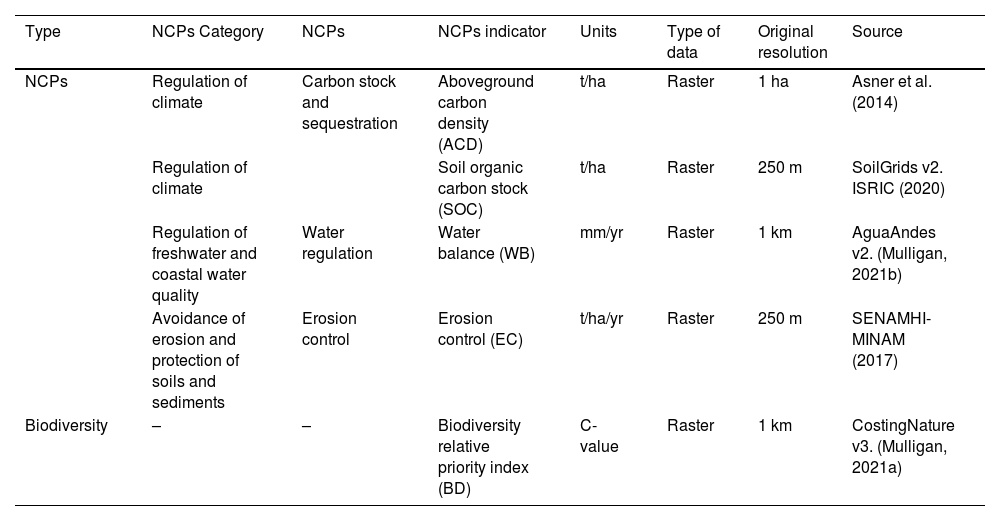
Nature’s contributions to people and biodiversity indicatorsWe selected three Nature's contributions to people (NCPs) indicators and one indicator of biodiversity (Table 1) based on their relevance to natural resource management, and on their data availability at high-resolution for the whole country. Our approach uses the NCPs hierarchical classification of Intergovernmental Science-Policy Platform on Biodiversity and Ecosystem Services (IPBES) (Díaz et al., 2015; IPBES, 2017). Forests and shrublands contribute to climate regulation by storing and sequestering carbon in the above-ground biomass and soil. They also moderate various physical and biological soil processes, affecting carbon storage. Additionally, they protect soil and prevent erosion by intercepting rain and reducing its energy, slowing runoff, and stabilizing the soil structure with their root system. Furthermore, these ecosystems aid in water regulation through evapotranspiration.
- •
Carbon stock and sequestration. We analyzed this NCP on two complementary components separately aboveground carbon density- ACD and soil organic carbon stock- SOC, due to regional heterogeneity in climate, geomorphology, physiography and ecosystem composition of Peru.
Aboveground carbon density, ACD (t/ha). We used a high-resolution map (1 ha) of aboveground carbon density (ACD) estimated for Peru using LIDAR (Light Detection and Ranging) technology, a wide network of field plots, satellite images, and geostatistical techniques, including Random Forest Machine Learning, at various scales (Asner et al., 2014).
Soil organic carbon stock, SOC (t/ha). We utilized SoilGrids (ISRIC, 2020) to obtain a global map of soil organic carbon (SOC) content at a depth of 30 cm. The model employed machine learning techniques to predict this soil property on a global scale. The predictions were refined using 196,000 standardized soil profiles from various locations, expert observations, and 158 covariates such as climate, relief, living organisms, water dynamics, and parent material (Hengl et al., 2017).
- •
Water balance, WB (mm/yr). The water balance (WB) was obtained from WaterWorld v.2 (a global raster-based model; Mulligan, 2021b). WaterWorld is an open-source GIS tool with a robust climatological base (1950–2000) based on the model Fog Interception for the Enhancement of Streamflow in Tropical Areas (FIESTA; Mulligan and Burke, 2005). The water balance was calculated using local water precipitation (rain + fog + snowmelt) minus actual evapotranspiration (AET). (Mulligan and Burke, 2005; Mulligan, 2013).
- •
Erosion control, EC (t/ha/yr). We estimated soil erosion prevented by vegetation by calculating the difference between potential erosion (if there were no vegetation) and actual erosion, following Roces-Díaz et al. (2021). To do this, we utilized the average of annual water erosion maps (1981–2000) from the National Service of Meteorology and Hydrology of Peru (SENAMHI-MINAM). This atlas uses the Revised Universal Soil Loss Equation (RUSLE; Renard et al., 1997) and incorporates precipitation data from the national multitemporal geospatial base, topography from Shuttle Radar Topography Mission (SRTM) v 4.1. 90 m, soil information from SoilGrids, and vegetation cover from GlobeLand30-2010, which defines the cover factor (SENAMHI-MINAM, 2017). We calculated potential soil erosion by assigning the bare ground cover factor instead of the forest or shrubland factor in RUSLE. We used the forest cover factor for all regions except the Andean region, where we used the shrubland factor because 92.7% of its ecosystem is comprised of shrublands (Table A1).
- •
Biodiversity relative priority index (C- value). We used the Costing Nature Relative Priority Index of Biodiversity (Mulligan, 2021a) due to the lack of national data. The index is based on the C-value, which combines species richness and endemism for species on the red list, using freely available data for mammals, amphibians, reptiles, and birds. The C-value for each pixel was calculated as the sum of C-values for all present species, and for each species, it was calculated as 1/G, where G represents the species' global range size, i.e., the number of pixels in which the species occurs in Peru.
Summary of the NCPs and biodiversity indicators considered and the dataset sources used.
| Type | NCPs Category | NCPs | NCPs indicator | Units | Type of data | Original resolution | Source |
|---|---|---|---|---|---|---|---|
| NCPs | Regulation of climate | Carbon stock and sequestration | Aboveground carbon density (ACD) | t/ha | Raster | 1 ha | Asner et al. (2014) |
| Regulation of climate | Soil organic carbon stock (SOC) | t/ha | Raster | 250 m | SoilGrids v2. ISRIC (2020) | ||
| Regulation of freshwater and coastal water quality | Water regulation | Water balance (WB) | mm/yr | Raster | 1 km | AguaAndes v2. (Mulligan, 2021b) | |
| Avoidance of erosion and protection of soils and sediments | Erosion control | Erosion control (EC) | t/ha/yr | Raster | 250 m | SENAMHI-MINAM (2017) | |
| Biodiversity | – | – | Biodiversity relative priority index (BD) | C-value | Raster | 1 km | CostingNature v3. (Mulligan, 2021a) |
To ensure consistency in the analysis of data sets (as shown in Table 1), a reference grid was established at a resolution of 1 × 1 km, and cell values from the original raster were extracted accordingly. Only forest or shrubland cells were used to extract information for each NCP and biodiversity indicator, with the latter being used only for the Coast and Andean regions. To test differences among regions for each NCPs and biodiversity, we conducted ANOVA for normally distributed indicators and Kruskal-Wallis tests for non-normally distributed indicators (ANOVA tests for soil organic carbon stock- SOC, water balance- WB, and biodiversity indicator- BD, and Kruskal-Wallis tests for aboveground carbon density- ACD and erosion control- EC). For each NCP and biodiversity indicator, 20% of the grid cells that had the largest values were classified as hotspots resulting in five single hotspots maps. This criterion of 20% of largest values is widely used in large-scale studies in different biomes and countries (Armenteras et al., 2015; Lecina-Diaz et al., 2018; Mitchell et al., 2021; Orsi et al., 2020; Pellegrini Manhães et al., 2016). We built binary maps from each single hotspot map (1 = hotspots values and 0 = other values or non-hotpots values). We then overlapped these five binary maps to obtain an overlapped hotspot map where the value range between 0 (non-hotpots for any of the indicators) and 5 (hotspot of all indicators). Finally, for each region and each category of protection degree, we calculated the percentage of land that was classified has a NCPs or biodiversity hotspot areas. A χ2 test was applied to determine whether the percentage of hotspots was dependent to the degree of protection.
We used pairwise correlations to assess synergies (positive correlations) and tradeoffs (negative correlations) among NCPs and biodiversity indicators at the national and regional scales. We tested the presence of spatial autocorrelation using Moran’s I coefficient (Moran, 1950). We evaluated the significance of the correlation coefficients among spatially-autocorrelated variables by applying Dutilleul's adjustment (Clifford et al., 1989; Dutilleul et al., 1993), consistent with work by (Casalegno et al., 2013; Morelli et al., 2017; Vallet et al., 2018) as implemented in the function "modified.ttest" of the R package "SpatialPack".
We used ArcGIS 10.5 (ESRI, 2016) for processing indicators and hotspots analysis. The statistical analyses were carried out using the R 4.1.0 software (R CoreTeam, 2021).
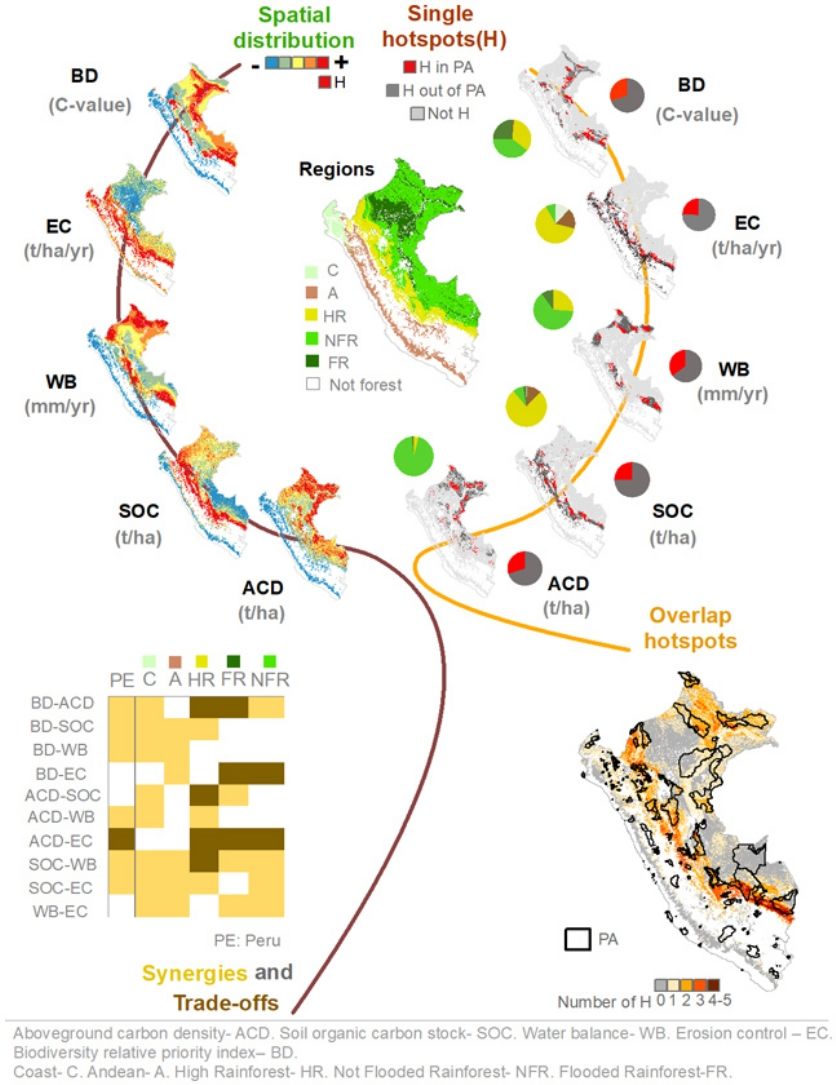
ResultsSpatial distribution of Nature’s contributions to people (NCPs) and biodiversity hotspotsThe spatial distribution of NCPs and biodiversity indicators varied drastically across the Peruvian forests and shrublands (Fig. 2). The High Rainforest region had the highest mean values for all indicators, except aboveground carbon density- ACD (Table A4). Moreover, all regions significantly differ from each other in all indicators (Table A4) according to the ANOVA tests for soil organic carbon stock -SOC- (F = 437 083, p < 0.001), water balance -WB- (F = 282 759, p < 0.001) and biodiversity -BD- (F = 696 828, p < 0.001) and Kruskal–Wallis tests for aboveground carbon density -ACD- (F = 540 660, p < 0.001) and erosion control -EC- (F = 540 660, p < 0.001). The regions that concentrated most single hotspots for each indicator were (Fig. 2 and Table A4): the Not Flooded Rainforest for ACD (18.9% of high indicators values- hotspots) and WB (12.8%); the High Rainforest region for SOC (15.4%); the High Rainforest region for EC (12.6%) and the three rainforest regions for biodiversity (7.8% in Not Flooded Rainforest, 6.8% in High Rainforest, and 5.1% in Flooded Rainforest). Furthermore, we identified the regions with the most surface covered by single hotspots for each indicator (Fig. 2 and Table A4): the Not Flooded Rainforest region for ACD (39.4% of the region surface); the High Rainforest region (85.3%) and the Andean region (17.8%) for SOC; the three rainforest regions for WB (29.4% in High Rainforest; 26.7% in Not Flooded Rainforest and 11.7% in Flooded Rainforest); the High Rainforest (70.7%) and the Coast (59.7%) regions for EC; and the three rainforest regions (38.1% in the High Rainforest region, 30% in the Flooded Rainforest region and 16.3% in Not Flooded Rainforest) for BD.
 and hotspots and not hotspots areas by region (f–j) for each NCPs and biodiversity indicators of Peruvian forest. (a–e) Spatial distribution shown according to a percentile 20th (i.e., each class represents 20% of Peruvian forests). (f–j) In red, hotspot areas, in gray non hotspot areas and in white no forest areas. The bar charts indicate the percentage of forest by region and above each bar the relative percentages of hotspots related to the region area are given. Indicators: aboveground carbon density -ACD- (t/ha); soil organic carbon stock -SOC- (t/ha); water balance -WB- (mm/yr); erosion control – EC- (t/ha/yr) and biodiversity relative priority index -BD- (C-value). Regions: Coast C; Andean A; High Rainforest HR; Not Flooded Rainforest NFR; Flooded Rainforest FR.")
Spatial distribution (a-e) and hotspots and not hotspots areas by region (f–j) for each NCPs and biodiversity indicators of Peruvian forest. (a–e) Spatial distribution shown according to a percentile 20th (i.e., each class represents 20% of Peruvian forests). (f–j) In red, hotspot areas, in gray non hotspot areas and in white no forest areas. The bar charts indicate the percentage of forest by region and above each bar the relative percentages of hotspots related to the region area are given. Indicators: aboveground carbon density -ACD- (t/ha); soil organic carbon stock -SOC- (t/ha); water balance -WB- (mm/yr); erosion control – EC- (t/ha/yr) and biodiversity relative priority index -BD- (C-value). Regions: Coast C; Andean A; High Rainforest HR; Not Flooded Rainforest NFR; Flooded Rainforest FR.
Single hotspot areas (20% of forest and shrubland) for all the NCPs and biodiversity indicators were mainly located outside PAs -UnPAs- (Table A5; 14% of the forest and shrubland for aboveground carbon density -ACD-; 14.6% for soil organic carbon stock -SOC-; 13.3% for water balance -WB-; 15% for erosion control -EC-; and 13.6% for biodiversity -BD-). The percentages of PAs in the different regions covered with single hotspots were: 25.5% for ACD; 22.9% for SOC; 28.6% for WB; 21.2% for EC and 27.5% for BD (Fig. 3). The percentages of hotspots between PAs and Un-PAs were significantly different for ACD (χ2 test, χ2 = 4 865.1, p < 0.01), SOC (χ2 = 1 638.3, df = 1, p < 0.001), WB (χ2 = 11 981.0, p < 0.01), EC (χ2 = 226.9, p < 0.01) and BD (χ2 = 9 121.0, p < 0.01). The degree of protection with the most area covered with single hotpots was PAs with Direct Use- PA2 for ACD (31.4%) and BD (30.1%) and Other PAs- PA3 for SOC (39.7%), EC (33.4%) and WB (33%) (Table A6). The percentage of single hotspots within PAs distributed by degree of protection of ACD (χ2 = 3 329.9, p < 0.01), SOC (χ2 = 1 818.7, p < 0.01), WB (χ2 = 1 014.4, p < 0.01), EC (χ2 = 1 674.5, p < 0.01) and BD (χ2 = 541.9, p < 0.01) were significantly different between PA1, PA2 and PA3. The single hotspot areas within PA were concentrated mainly in PA2, except for SOC and EC which were in PA1 (Table A6).
 Single hotspot and not hotspot areas for each NCPs and biodiversity indicator by degree of protection. Red and dark gray represent the single hotspot areas in PA and Un-Pas, respectively; the pie chart in the top right corner shows the percentage of single hotspots; the bar charts indicate the percentage of forest by degree of protection, and above each bar in number are given the relative percentages of hotspots related to the whole are. (f) Multiple hotspot overlap of NCPs and biodiversity indicators; gray and white represent non hotspot and no forest areas, while warm colors indicate overlap of 1 to 5 NCP and biodiversity indicators. Un-PAs: Unprotected Areas; PAs: Protected Areas; PA1: Strict Protected Areas with Indirect Use; PA2: Protected Areas with Direct Use; PA3: Others Protected Areas. Indicators: aboveground carbon density -ACD- (t/ha); soil organic carbon stock -SOC- (t/ha); water balance -WB- (mm/yr); erosion control -EC- (t/ha/yr), and biodiversity relative priority index -BD- (C-value).")
(a–e) Single hotspot and not hotspot areas for each NCPs and biodiversity indicator by degree of protection. Red and dark gray represent the single hotspot areas in PA and Un-Pas, respectively; the pie chart in the top right corner shows the percentage of single hotspots; the bar charts indicate the percentage of forest by degree of protection, and above each bar in number are given the relative percentages of hotspots related to the whole are. (f) Multiple hotspot overlap of NCPs and biodiversity indicators; gray and white represent non hotspot and no forest areas, while warm colors indicate overlap of 1 to 5 NCP and biodiversity indicators. Un-PAs: Unprotected Areas; PAs: Protected Areas; PA1: Strict Protected Areas with Indirect Use; PA2: Protected Areas with Direct Use; PA3: Others Protected Areas. Indicators: aboveground carbon density -ACD- (t/ha); soil organic carbon stock -SOC- (t/ha); water balance -WB- (mm/yr); erosion control -EC- (t/ha/yr), and biodiversity relative priority index -BD- (C-value).
We found low hotspot overlap between indicators (Fig. 3). Thus, 28% of the area of Peruvian forests and shrublands overlapped at least two indicator hotspots, while 9% overlapped 3 or more indicators (Table A7). Hotspot overlap (2–5 indicators) in PAs and Un-PAs was 9% (4.4% in PA1, 4.2% in PA2 and 0.3% in PA3) and 19.1% of Peruvian forests and shrublands, respectively (Table A7). Hotspot overlap covered 24.9% of Un-PAs and 38.4% of PAs; 37% of PA1, 39.2% of PA2, and 46.6% of PA3 (Table A7).
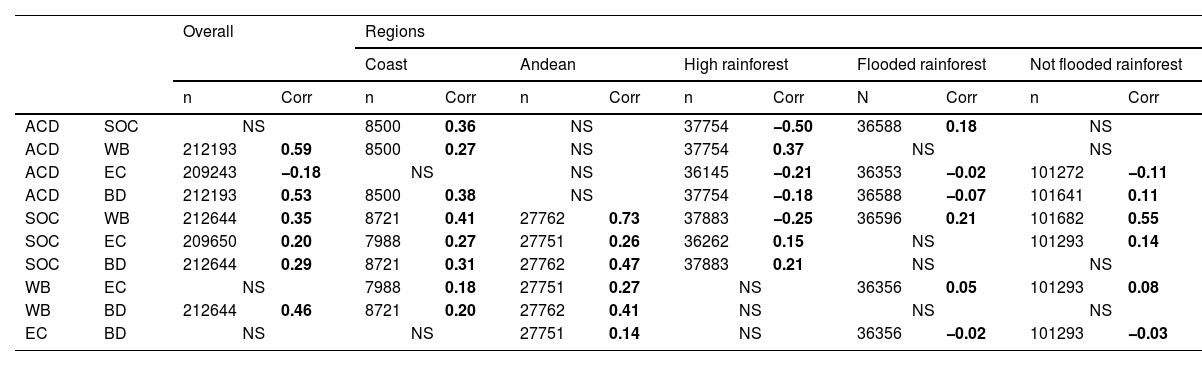
Synergies and trade-off between Nature's contributions to people (NCPs) and biodiversityWe observed positive spatial autocorrelation in all indicators (Fig. A11), with water balance (WB) having the highest except in the Coast region, while erosion control (EC) had the lowest. The Flooded Rainforest region exhibited weaker patterns of spatial autocorrelation compared to other regions and the overall area. The coefficients of correlation for the 10 pairs of five indicators at the national and regional scale are shown in Table 2. Not all correlations were significant at the national scale (aboveground carbon density and soil organic carbon stock ACD-SOC; WB-EC and EC and biodiversity-BD) or regional scale (all pairwise correlations except SOC-WB). We identified synergies at the national scale, except between ACD-EC. Furthermore, we observed synergies in the Coast and Andean regions, while trade-offs were present in some of the tree Rainforest regions (ACD-SOC in the High Rainforest region; ACD-EC in the three Rainforest regions; ACD-BD in High and Flooded Rainforest; SOC-WB in High Rainforest and EC-BD in Flooded and Not Flooded Rainforest).
Pairwise correlation of aboveground carbon density (ACD, in t/ha); soil organic carbon stock (SOC, in t/ha), water balance (WB, in mm/yr); erosion control (EC, in t/ha/yr) and biodiversity (C-value). Pairwise correlation values and the significance (i.e., p-value) of the corresponding modified t-test. Are shown Corr: significant r values (p < 0.05) are in bold; NS: Not significant values (p > 0.05); n: number of cases for each pairwise correlation.
| Overall | Regions | ||||||||||||
|---|---|---|---|---|---|---|---|---|---|---|---|---|---|
| Coast | Andean | High rainforest | Flooded rainforest | Not flooded rainforest | |||||||||
| n | Corr | n | Corr | n | Corr | n | Corr | N | Corr | n | Corr | ||
| ACD | SOC | NS | 8500 | 0.36 | NS | 37754 | −0.50 | 36588 | 0.18 | NS | |||
| ACD | WB | 212193 | 0.59 | 8500 | 0.27 | NS | 37754 | 0.37 | NS | NS | |||
| ACD | EC | 209243 | −0.18 | NS | NS | 36145 | −0.21 | 36353 | −0.02 | 101272 | −0.11 | ||
| ACD | BD | 212193 | 0.53 | 8500 | 0.38 | NS | 37754 | −0.18 | 36588 | −0.07 | 101641 | 0.11 | |
| SOC | WB | 212644 | 0.35 | 8721 | 0.41 | 27762 | 0.73 | 37883 | −0.25 | 36596 | 0.21 | 101682 | 0.55 |
| SOC | EC | 209650 | 0.20 | 7988 | 0.27 | 27751 | 0.26 | 36262 | 0.15 | NS | 101293 | 0.14 | |
| SOC | BD | 212644 | 0.29 | 8721 | 0.31 | 27762 | 0.47 | 37883 | 0.21 | NS | NS | ||
| WB | EC | NS | 7988 | 0.18 | 27751 | 0.27 | NS | 36356 | 0.05 | 101293 | 0.08 | ||
| WB | BD | 212644 | 0.46 | 8721 | 0.20 | 27762 | 0.41 | NS | NS | NS | |||
| EC | BD | NS | NS | 27751 | 0.14 | NS | 36356 | −0.02 | 101293 | −0.03 | |||
Almost the entire aboveground carbon density -ACD- hotspot area was in the forests ecosystems of the northeastern Not flooded Rainforest region (Fig. 2f) due to favorable conditions for vegetation growth as has also been reported in other national-scale studies by Asner et al. (2014) and Csillik et al. (2019). Furthermore, the most hotspot areas are locations hardly exploited due to difficulties to access and, for this reason, with historically lower forest degradation (Asner et al., 2014). Accessibility, by rivers and roads, is recognized at the literature as an important driver of deforestation and degradation of tropical forests (Aguirre et al., 2021; Geist and Lambin, 2002; Rudel, 2007). Otherwise, growth and survival of forest and shrubland (which determine ACD) are limited in the Andean, Coast and Flooded Rainforest regions due to extreme climatic conditions: reduced temperature and precipitation and geological limitations in the Andean and Coast regions (Asner et al., 2014; Girardin et al., 2010; Fig. A7), and hydrological conditions (anoxia) and low soil fertility in the Flooded Rainforest region (Asner et al., 2014; Draper et al., 2014). In addition, the anthropic factors (agricultural, livestock and forestry activities, fire and urban expansion) were also limiting factors for carbon storing in the Andean (Sylvester et al., 2017) and Coast region (Ektvedt et al., 2012).
Our study highlights the importance of the whole forests of the High Rainforest region as soil organic carbon stock -SOC- hotspot, and a lower, although significant, value in the forest and shrubland of the Andean region (Fig. 2g). Low temperature produces slow rates of organic matter decomposition and promotes SOC accumulation in these regions (Nottingham et al., 2016). In addition, SOC transfer from others eroded ecosystems to the soil surface in the High Rainforest region could also explain SOC accumulation in this forests and shrubland (De la Cruz-Amo et al., 2020; Li et al., 2019). However, the limited soil depth analyzed (only the first 30 cm) and the small number of Peruvian profiles included in the SOC model could limit the results obtained with this indicator (Fig. A9).
In the three Rainforest regions, the interaction of the winds, the diurnal cycle of solar radiation, the rugged physiography of the Andes and water recycled of evapotranspiration by forests produce constant and high annual precipitation (Weng et al., 2018; Fig. A7). In consequence, the hotspots areas of water balance- WB were concentrated in these forests (Fig. 2h). Precipitation in hotspots areas of the Not Flooded Rainforest region was associated with the dynamics of the intertropical convergence zone (ITCZ) (Schneider et al., 2014), while precipitation in the High Rainforest and Flooded Rainforest were strongly dependent on the evapotranspiration of the Amazonian forests (Weng et al., 2018). On the contrary, the Coast region (north of Peru) is seasonally dry, as a result of the very low precipitation and the high evapotranspiration rates of forests and shrublands because of the high temperatures characteristic of tropical ecosystems near to Equator (Sitters et al., 2012; Fig. A7). In the Andean region, rainfall occurs in summer and it is of orographic origin, resulting in contrasted wet and dry seasons (Garreaud, 2009; Fig. A7).
Our study highlights the crucial role of forests in controlling soil erosion in the High Rainforest region (Fig. 2i), which has extensive forest areas and a sloped to extremely steep relief. The region experiences high rainfall, which increases the potential for erosion in the absence of forests (Fig. A3). Additionally, some hotspots were identified in the Andean region, where the role of shrublands in erosion control was lower than that of forests (Domínguez-Castro et al., 2018; Tables A1; A4; Figs. A3; A7). In contrast, forest's role in mitigating soil erosion in the flat relief and high rainfall of the flooded and non-flooded rainforest areas was much less than in steep relief areas. On the other hand, more than half of the forests and scrublands in the Coast region were identified as erosion control hotspot areas, despite the slightly uneven topography, which is mainly flat. This region experiences high rainfall in a short period, which can generate soil erosion (Figs. A3, A7). Extreme rainfall events, such as those associated with the El Niño-Southern Oscillation (ENSO), can also cause considerable erosion. Although this study analyzed averages of several years, during which Peru experienced three hydrological years of strong El Niño and five of moderate El Niño (Lavado-Casimiro and Espinoza, 2014), it only partially captured these extreme events.
Peru is provided with different factors that influence the megadiversity registered across the different forest and shrubland ecosystems (Reynel et al., 2013). Therefore, biodiversity- BD hotspot areas are present in all Peruvian regions (Fig. 2j). The highest BD values are recorded in the forests of High Rainforest region, because of a large richness and a high presence of endemism in different groups of fauna, mainly amphibians and reptiles (Pacheco et al., 2021; Swenson et al., 2012). The BD hotspot areas in the forests of the Flooded and Not Flooded Rainforest regions are located at the convergence of global maxima for mammals, birds and amphibians (Harvey et al., 2014; Pitman et al., 2021; Reynel et al., 2013; Fig. A4). On other hand, in the forest and shrubland of the Andean and Coast regions there are small and isolated hotspot areas: only the hotspot areas close to the Ecuador "Zone Amopate-Huancabamba" is of particular interest because of elevated levels of diversity and narrow endemicity (Reynel et al., 2013).
Exploring changes in synergies and trade-off of NCPs and biodiversityThe synergy between aboveground carbon density and water balance ACD-WB in the national and Coast and High Rainforest regions is expected due to the effects of temperature and precipitation on biomass in tropical forests (Taylor et al., 2017). Erosion control and soil organic carbon stock EC-SOC synergy is also expected in the Coast, Andean, High, and Not Flooded Rainforest regions because high SOC conditions (i.e., altitude-slope or precipitation) also result in high EC. The synergy between EC-WB in the Coast, Andean, Flooded, and Not Flooded Rainforest regions can be explained by the role of vegetation cover in controlling erosion, which increases with rainfall. The WB-SOC synergy is explained by WB regional variations (Fig. A7) that promote SOC (i.e., the extremely arid conditions and the seasonality of rainfall in the Coast (Solano et al., 2018; Fig. A7) or the constant rainfall in a clay soil and the existence of partially or permanently flooded soils with low oxygen concentration in Flooded and Not Flooded Rainforest (Wang et al., 2018). However, the trade-off between WB-SOC in the High Rainforest region is likely because higher precipitation at greater altitude could increase mineralization rates, resulting in less SOC. The trade-off between ACD-SOC in the High Rainforest and Andean regions is due to the climatic conditions that favor plant growth, which also increase organic matter decomposition and SOC reduction (Taylor et al., 2017). However, the trade-off between ACD-SOC changes to synergy in the Coast, Flooded, and Not Flooded Rainforest regions due to extremely low decomposition rates of organic matter, resulting in SOC increase. Additionally, the trade-off between ACD-EC at the national scale and in the three Rainforest regions results from ACD reduction with altitude but greater erosion avoidance by vegetation on steep slopes. The conditions that promote ACD and EC in some regions (Flooded and High Rainforest and Flooded and Not Flooded Rainforest, respectively) did not increase the presence of endemic fauna species.
The role of the current system of Peruvian terrestrial protected areas protecting nature's contributions to people (NCPs) and biodiversity in PeruPrevious assessments of the representativeness of the Peruvian PA system have focused exclusively on biodiversity, reporting conservation gaps for the representation of fauna groups (Baldi et al., 2019; Rodríguez and Young, 2000; Shanee et al., 2017). A different approach has identified that the Peruvian PA system stores a great aboveground carbon (Asner et al., 2014). Here, we document for the first time the representativeness of both NCPs and biodiversity in the current PA system. The Peruvian PA system and the priority conservation areas (future Peruvian PA; SERNANP-MINAM, 2009) were established and increased with the main objective of conserving biodiversity based on specialist criteria as high biodiversity, endemism, and particular taxonomic groups (Rodríguez and Young, 2000; SERNANP-MINAM, 2009). However, the current PAs network and the priority conservation areas do not protect a great percentage of biodiversity hotspots, neither protect single or overlap NCPs hotspots (Fig. 3; Fig. A10). Concerning the degree of protection, a higher degree of protection (PA1) does not protect a lot more single or overlapped NCPs and biodiversity hotspot areas than lower degrees of protection (PA2 or PA3), as it has been also recognized in previous studies (Bastian, 2013; Lecina-Diaz et al., 2019). In fact, the intermediate degree of protection (PA2) mainly contains the most single and overlapped hotspot areas for NCPs and biodiversity (Fig. 3; Table A7). Therefore, large hotspot areas could be under management of natural resources without considering the preservation of single or multiple NCPs targets.
Beyond nature's contributions to people (NCPs) and biodiversity hotspots identification: implications for planning conservation in a megadiverse countryUnderstanding the spatial distribution, overlap, and synergies/trade-offs between NCPs and biodiversity, as well as the effectiveness of current PAs in preserving them, is crucial in deciding the future establishment of multifunctional PAs in megadiverse countries. Our recommendations aim to inform national forest policies and conservation planning to achieve multifunctional PAs in Peru and other countries.
The spatial distribution of hotspots and the variation in regional synergies and trade-offs between NCPs and biodiversity are influenced by biophysical characteristics and anthropic impact in each region (Fig. 2, Table 2). However, analyzing synergies and trade-offs at the national scale could oversimplify the reality, particularly in rainforest regions. Current PAs in Peru are insufficient to preserve single and multiple NCPs and biodiversity hotspots (Fig. 3), which is a common issue in many countries worldwide (Xu et al., 2017).
Overall, our findings highlight the need to consider the spatial distribution, overlap, and synergies/trade-offs between NCPs and biodiversity when establishing multifunctional PAs. We recommend improving national forest policies and conservation planning to address the challenges of preserving forests and scrublands in megadiverse countries. The overlap between biodiversity and NCPs hotspots (Fig. A12) suggests that some NCPs are preserved in current PAs in Peru. However, trade-offs exist between biodiversity and some NCPs at the regional scale (aboveground carbon density- ACD in the High and Flooded Rainforest regions and erosion control- EC in the Flooded and Not Flooded Rainforest regions; Table 2). Therefore, a conservation plan focused solely on biodiversity may not adequately preserve NCPs. Additionally, as the number of hotspots overlapped decreases, so do the areas that contain multiple hotspots (Fig. 3), which is consistent with other studies in highly heterogeneous areas (Mitchell et al., 2021; Orsi et al., 2020). Moreover, trade-offs between NCPs and biodiversity, as well as among NCPs at the national or regional scale, are possible. Consequently, multiple NCPs and biodiversity hotspots cannot be conserved in the same areas. Therefore, identifying hotspot areas is only the first step towards achieving the multifunctionality of PAs.
Reformulating AP categories is crucial to achieve multifunctional PAs. The new Director Plan for Peruvian PAs should prioritize conservation areas by identifying regions with high NCP and biodiversity values, as suggested in studies conducted in other countries (Jung et al., 2021; Lecina-Diaz et al., 2018). To achieve multifunctionality, NCPs and biodiversity bundles (Orsi et al., 2020) should be identified, and the main conservation objective should be defined based on an analysis of synergies and trade-offs at the regional scale. The distribution of regional hotspots could be considered when deciding the distribution of new PAs. Additionally, if the conservation of NCPs is not compromised, the management of resources, such as PA2 or PA3, could be allowed in the new PAs, which could close the gap in a politically feasible way (Xu et al., 2017). However, to define new PAs, more research is needed to (i) improve national data and the spatial quality of NCPs, (ii) analyze new indicators, including realized NCPs and the strength of synergies or trade-offs, and (iii) identify NCP and biodiversity bundles. Improving data is urgent for a better approach.
The spatial data used are derived from public repositories. We thank all the people involved in developing the source data. We would like to thank Mark Mulligan for providing the biodiversity priority index by Costing Nature for whole Peru. We also thank to Subdirección de Estudios e Investigaciones Hidrológicas of Servicio Nacional de Meteorología e Hidrología del Perú - SENAMHI (Evelin Sabino) and Dirección de Desarrollo Estratégico of Servicio Nacional de Áreas Naturales Protegidas por el Estado- SERNANP (Marisela Huancauqui) for supplying spatial data and useful information. We are grateful to Xavier Domene, Sady García and Giancarlo Orellana for constructive comments. We also wish to thank to Roberto Molowny for his statistical support and advice. We would like to thank the two anonymous reviewers that improved the manuscript. Maricel Móstiga received a predoctoral fellowship, Generación Bicentenario, funded by Peruvian Ministry of Education (Programa Nacional de Becas y Créditos Educativos- PRONABEC).
The following is Supplementary data to this article:

