


Conservation strategies often assume uniform response to habitat loss and fragmentation among species. We investigated whether bird species' responses to habitat changes vary based on their distribution range and local environmental suitability. Additionally, we explored associations between sensitivity responses and species traits, like dispersal ability, habitat specialization, and distribution range size. Our study focused on the Brazilian Atlantic Forest, encompassing 179 landscape sites and 81 bird species. Using additive and interactive relationships and used principal component analysis to correlate species traits with sensitivity patterns. We found four distinct patterns of population sensitivity patterns: no effect of geographical range or environmental suitability (21% of the species), higher sensitivity at the geographical edges or low suitability (14%), lower sensitivity in core or better areas (11%) or both extremes responding similarly (11%), with species showing no response to landscape changes (43%). Biogeographic and landscape factors interactively influenced population abundance, resulting in antagonistic or synergistic effects. Population responses to habitat loss and fragmentation varied based on range position or environmental suitability but weren’t consistently explained by species traits. Given these nuanced results, conservationists must refrain from generalizing species sensitivity without accounting for distribution range position and environmental suitability. To ensure the long-term survival of biodiversity, conservation efforts should be tailored to each species' specific needs, taking into account their spatial position and the synergistic or antagonistic effects of environmental stressors. Such targeted conservation efforts will be crucial in mitigating the impacts of habitat loss and fragmentation on bird populations within the Brazilian Atlantic Forest.
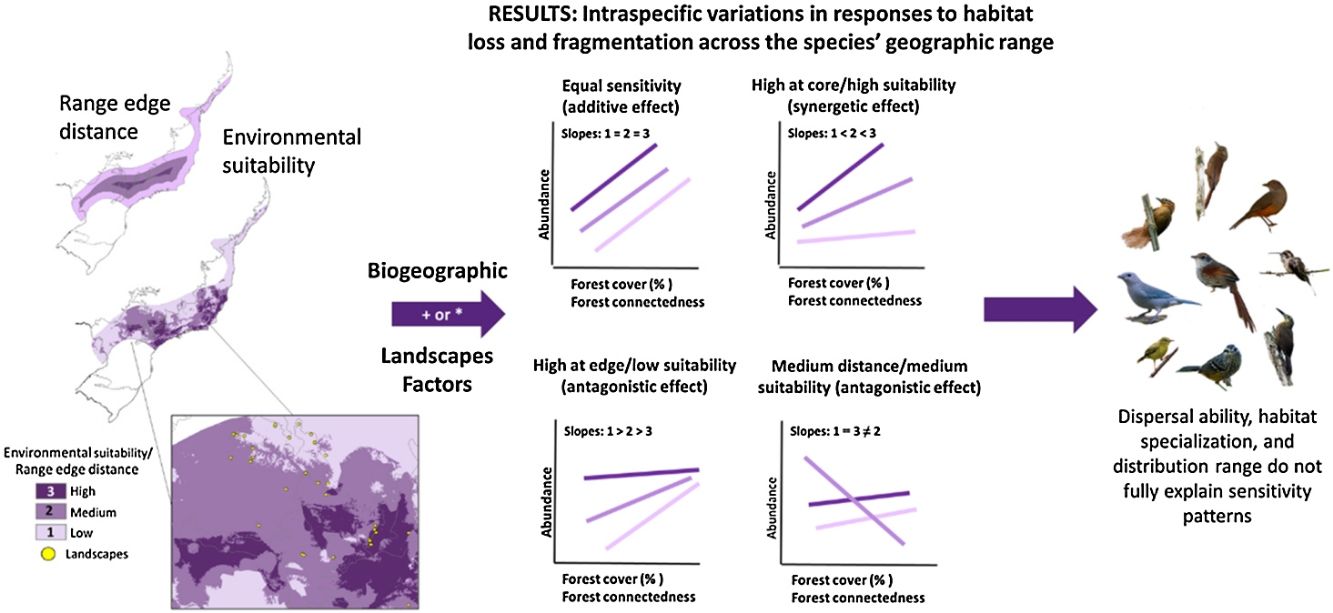
A recent macroecological study by Banks-Leite et al. (2022) has shed light on the potential for intraspecific spatial variation in response to habitat loss and fragmentation across species' geographic distribution ranges. Traditionally, it has been assumed that all individuals from the same species respond equally to these habitat changes (i.e., refer to habitat loss and fragmentation; Valladares et al., 2014), but recent evidence challenges this notion (Orme et al., 2019). Two main mechanisms that may contribute to spatial variation in response patterns are distance to the geographic distribution range edge and environmental suitability (Anjos et al., 2010; Weber et al., 2017).
The center-periphery hypothesis suggests that populations exhibit greater abundance at the center of a species' range, gradually declining towards the edge. This pattern is attributed to the more favorable environmental conditions at the center of the range (Brown, 1984; Sagarin and Gaines, 2002). Supporting this idea, studies by Orme et al. (2019) and (Prieto-Ramirez et al., 2020) have demonstrated that populations are more susceptible to habitat changes at the range edge.
In contrast, the physiological tolerance hypothesis suggests that variations in species' responses to habitat changes can be attributed to differences in tolerance to environmental factors. Williams and Newbold (2021) found that populations nearing their physiological limits are more sensitive to habitat fragmentation. However, in Atlantic Forest, these physiological limits may not coincide with the edge range of a species’ distribution due to the lack of spatial autocorrelation in environmental factors. They change abruptly toward the range edge due to the presence of coastlines and steep elevational gradients. Consequently, different patterns of abundance may emerge across species’ distribution ranges in response to habitat changes (Santini et al., 2019; Weber et al., 2017; Williams and Newbold, 2021). Understanding how species respond to habitat change across their distribution range is crucial for developing effective conservation strategies. These variations challenge the conventional understanding of equal sensitivity to habitat changes across distribution range and highlight the necessity for nuanced approaches to species conservation in this specific biome.
Despite the critical nature of the issue, there has been a lack of attention given to understanding the macroecological factors that influence species' responses to habitat loss and fragmentation. It is essential to recognize how populations respond to these habitat changes across a species' ranges to develop conservation strategies that mitigate severe population declines and negative cascading effects on ecosystem functioning and services (Betts et al., 2017; Ceballos et al., 2017).
In this study, we conducted an investigation on population sensitivity to habitat loss and fragmentation in 81 bird species from the Brazilian Atlantic Forest, building upon previous research (Brown, 1984; Safriel et al., 1994; Banks-Leite et al., 2022). Our study focused on two main hypotheses:
- 1
Equal sensitivity across the range: We hypothesized that species with higher dispersal ability or lower habitat specialization would demonstrate uniform sensitivity across their entire range to habitat loss and fragmentation. Conversely, species with lower dispersal ability or higher habitat specialization were expected to exhibit heightened sensitivity across habitat loss and fragmentation gradients.
- 2
Highest sensitivity at range edges and low environmental suitability: We predicted that populations located at the range edges or in regions with low environmental suitability would display the highest sensitivity to habitat loss and fragmentation.
- 1
To understand the influence of dispersal ability and habitat specialization on sensitivity to habitat loss and fragmentation, we considered these traits can play in shaping species' responses. Dispersal ability is critical in mitigating the risk of extinction or abundance variation, particularly in isolated and small patches, as individuals can recolonize these areas through migration from other patches (Levins 1970, Uezu and Metzger, 2011). Additionally, habitat specialization may influence sensitivity to habitat loss and fragmentation, with specialists being more susceptible to adverse impacts compared to generalists, given the reduced chance of their niche being represented in the remaining remnants (Saunders et al. 1991, Anjos et al., 2010).
To examine these hypotheses, we assessed the influence on species abundances of various factors, including forest loss, fragmentation, connectedness, environmental suitability, and distance to the range edge. Furthermore, we compared population responses among species based on their traits related to dispersal ability, habitat specialization, and range extension. Our goal was to contribute to identifying a variety of responses of bird populations to habitat changes, which can significantly impact the proposal formulation of conservation strategies in the Brazilian Atlantic Forest.
MethodsStudy areaOur study was conducted in the Brazilian Atlantic Forest, encompassing a total of 179 landscapes around areas with bird surveys, which include the Bahia Coastal Forests, Serra do Mar Coastal Forests, Araucaria Moist Forests, Bahia Forests, and transitional areas between the Atlantic Forest and the Cerrado (Silva et al., 2004; Fig. 1, Table S1). The Atlantic Forest has unfortunately experienced substantial loss, with only 28% of its original forest cover remaining. These forests are now predominantly found in small fragments, often less than 50 hectares in size, and are surrounded by various land uses such as pastures, croplands, Pinus and Eucalyptus plantations, and other human activities (Rezende et al., 2018; Ribeiro et al., 2009; Souza et al., 2020).
 and two transitional regions (Araucaria Moist Forests and Bahia Interior Forests). A few sites are in the transitional zone between the Atlantic Forest and the Cerrado.")
Map of the 179 landscape sites that are mainly located in the southeastern portion of the Brazilian Atlantic Forest biome and cover four biogeographical subregions: two centers of endemism (Bahia Coastal Forests and Serra do Mar Coastal Forests) and two transitional regions (Araucaria Moist Forests and Bahia Interior Forests). A few sites are in the transitional zone between the Atlantic Forest and the Cerrado.
In our study, the 179 landscape sites exhibit a clustered distribution with high variation in the distance among them, encompassing wide variability in land cover and environmental conditions across the study region. On average, the distance between each landscape's centroid and its nearest neighboring site is approximately 21.5 km. However, some clustered landscapes show overlaps of up to 50% overlap with others.
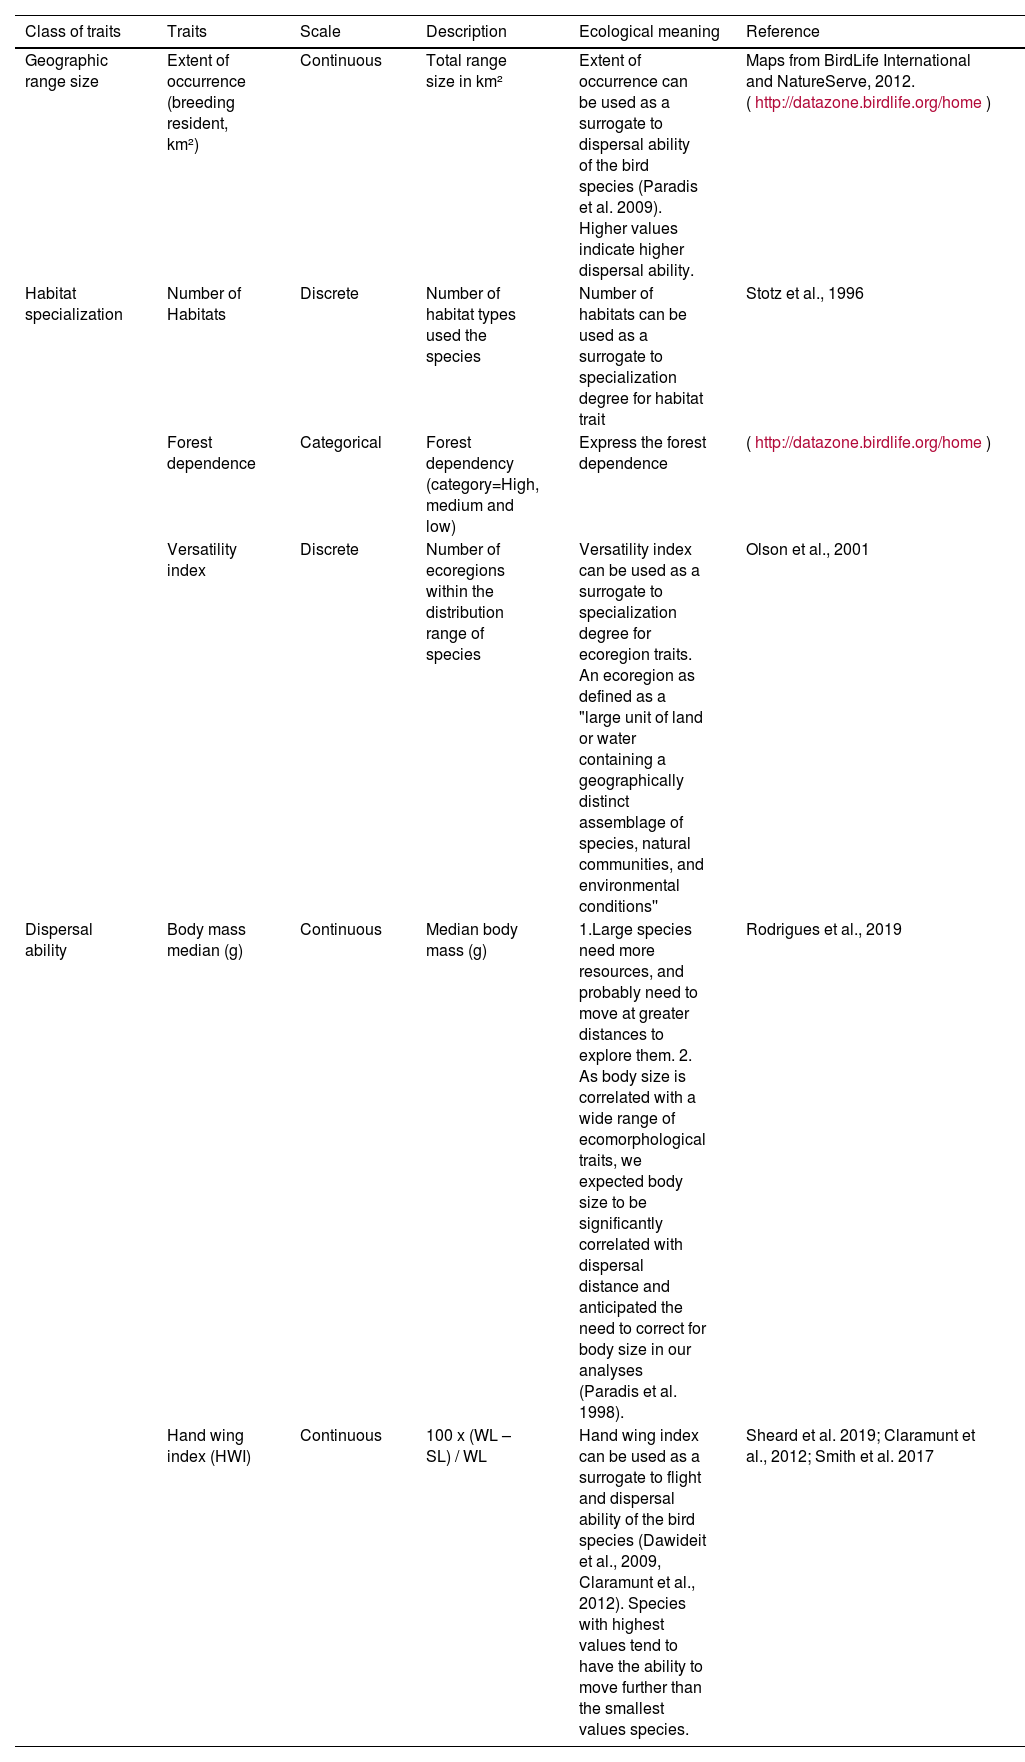
Species traitsWe used six biogeographical and ecomorphological traits from published datasets (Table 1 and S2), that were identified predictors of species sensitivity to fragmentation (Claramunt et al., 2012; Olson et al., 2001; Rodrigues et al., 2019; Stotz et al., 1996; Tobias et al., 2022). The six traits are geographic range size, habitat specialization, and morphological traits related to dispersal ability. These traits were previously suggested by Henle et al. (2004) as good indicators of species sensitivity to fragmentation, as they capture various dimensions of ecological niche, including spatial distribution, habitat preference, and dispersal ability.
Morphological and biogeographical traits of bird species used as a proxy for dispersal ability, habitat specialization, and spatial distribution.
| Class of traits | Traits | Scale | Description | Ecological meaning | Reference |
|---|---|---|---|---|---|
| Geographic range size | Extent of occurrence (breeding resident, km²) | Continuous | Total range size in km² | Extent of occurrence can be used as a surrogate to dispersal ability of the bird species (Paradis et al. 2009). Higher values indicate higher dispersal ability. | Maps from BirdLife International and NatureServe, 2012. (http://datazone.birdlife.org/home) |
| Habitat specialization | Number of Habitats | Discrete | Number of habitat types used the species | Number of habitats can be used as a surrogate to specialization degree for habitat trait | Stotz et al., 1996 |
| Forest dependence | Categorical | Forest dependency (category=High, medium and low) | Express the forest dependence | (http://datazone.birdlife.org/home) | |
| Versatility index | Discrete | Number of ecoregions within the distribution range of species | Versatility index can be used as a surrogate to specialization degree for ecoregion traits. An ecoregion as defined as a "large unit of land or water containing a geographically distinct assemblage of species, natural communities, and environmental conditions'' | Olson et al., 2001 | |
| Dispersal ability | Body mass median (g) | Continuous | Median body mass (g) | 1.Large species need more resources, and probably need to move at greater distances to explore them. 2. As body size is correlated with a wide range of ecomorphological traits, we expected body size to be significantly correlated with dispersal distance and anticipated the need to correct for body size in our analyses (Paradis et al. 1998). | Rodrigues et al., 2019 |
| Hand wing index (HWI) | Continuous | 100 x (WL – SL) / WL | Hand wing index can be used as a surrogate to flight and dispersal ability of the bird species (Dawideit et al., 2009, Claramunt et al., 2012). Species with highest values tend to have the ability to move further than the smallest values species. | Sheard et al. 2019; Claramunt et al., 2012; Smith et al. 2017 |
We collected abundance data for 81 bird species from the quantitative dataset of ATLANTIC BIRDS (Hasui et al., 2018). To ensure data quality and comparability, we only considered mist-net data that included precision data of sampling location coordinates and effort information. The effort was standardized across landscape sites by including only unique captures per 100 net-hours (1 net-hour representing 1 mist-net open for 1 h), excluding any recaptures of the same individual.
For our analysis, we selected species that were sampled in at least 15 landscapes between 1990 and 2017, specifically in natural habitats that remained mostly unchanged for over 20 years. To better understand the temporal dynamics of the landscapes, we assessed the difference in forest cover between 1990 and 2015, utilizing data from MapBiomas (Project MapBiomas, 2023). The median forest cover value in the landscapes that remained unchanged was 94.36% (standard deviation = 2.37%), with 1.64% (standard deviation = 1.68%) experiencing loss, and 3.47% (standard deviation = 1.78%) showing gain. To ensure a focus on natural habitats and eliminate the influence of strong anthropogenic factors, we excluded urban landscapes from our study. For further information on the selected species and landscape sites, please refer to Table S1, which provides details on our data selection process.
Predictor variablesWe selected five predictor variables to investigate the intraspecific responses to habitat loss and fragmentation in 81 bird species. These predictors included two biogeographic metrics and three landscape metrics (see Table S1 for details). The biogeographic metrics, namely distance from the nearest range edge and environmental suitability index served as proxies for a species' position within geographical or environmental space, which can offer valuable insights into species abundance. Previous research (Orme et al., 2019; Godsoe et al., 2017; Williams and Newbold, 2021) has commonly used distance from the nearest range edge and environmental suitability as proxies to explain species abundance, based on the "abundant center" hypothesis (Sagarin and Gaines, 2002). This hypothesis suggests that species' populations are more abundant at the center of their range, with abundance gradually declining towards the edge, where environmental conditions become less favorable. However, in the complex environmental patterns of the Atlantic Forest, such correlations may not be straightforward to detect (see Figs. S1 and S2; Dallas et al., 2017; Dallas and Hastings, 2018). To address these complexities and enhance the reliability of environmental suitability proxies, we incorporated both biogeographic metrics to gain a comprehensive understanding of the relationships between species abundance and their positions within the geographic and environmental space.
The environmental suitability index was calculated using species distribution modeling (SDM) and the maximum entropy method. We utilized 20 variables representing climate, topography, soil, and vegetation factors (see Table S3). These variables were selected based on their direct or indirect effects on ecophysiological processes, their potential as dispersal barriers for bird species, their prior usage in characterizing the distribution pattern of forest bird species and to minimize correlations between all possible pairs of variables (correlation threshold Pearson’s r = 0.7, Hasui et al., 2017).
For our analysis, we utilized occurrence data from the qualitative dataset of ATLANTIC BIRDS (Hasui et al., 2018), which includes information obtained from various sampling methods such as surveys focused on specific taxa or guilds, providing occurrence data (e.g., feeding bouts, museum records, and inventory surveys that combined multiple methods). We selected the occurrence data from the period between 1990 and 2017 and used them to constructed the SDMs. The SDMs demonstrated excellent discriminatory power, as assessed through the receiver operatoring characteristic (ROC) curve (Table S4).
To assess the distance from the nearest range edge of each species within our study, we used the Euclidean Distance tool available in ArcGIS software. This tool allowed us to calculate the Euclidean distance (in meters) from each centroid of the landscape site to the nearest edge of the species' geographic range, as predicted by the models described in the previous section. By employing this metric, we aimed to investigate whether populations situated close to the range edges exhibit different abundance compared to populations located further away. This phenomenon, known as the "range-edge effect", has been previously studied by Banks-Leite et al. (2022) and Hardie and Hutchings (2010). To derive these distances, we relied on the digital maps provided by Ridgely et al. (2007), which served as a crucial data source for our analyses.
To quantify the landscape metrics for all 179 sites, we used the tree cover map version 1.7 in year 2000 (treecover2000) produced by Hansen et al. (2013). This map was based on Landsat satellite images with a 30 m cell resolution and defined canopy closure for all vegetation ≥5 m in height. After reclassifying the map into forest and non-forest using a threshold ≥50% canopy cover as forest, we calculated the metrics within a circular buffer (1000 m radius size) around the central point of the mist-net line. This landscape size was chosen as it should be large enough to include most of the home range of small forest birds and has been identified as appropriate for evaluating bird assembly responses to landscape structure (Ribon, 1998; Boscolo and Metzger, 2009).
We used three landscape metrics (Table S1): forest cover (PLAND), fragmentation index (CLUMPY) and connectedness index (COHESION). Forest cover measures the percentage of forest in the landscape. Fragmentation index assesses fragmentation by isolating the configuration component from the cover component, giving an effective index of fragmentation not confounded by changes in cover (Olsoy et al., 2016). It ranges from −1 to 1, with −1 representing a maximally disaggregated landscape (greater dispersion), 0 representing randomly distributed patches, and 1 representing maximally clumped patches (greater contagion). Connectedness index measures the physical connectivity of forest patches and correlates well with dispersal success under various conditions (Opdam et al., 2003). It ranges from 0 to <100 and is proportional to the perimeter-area ratio divided by the shape index (Schumaker, 1996).
To ensure the robustness of our results, we used a single scale in model regressions after verifying the high correlation between landscape metrics at different scales, using radius buffers of 500 m, 1, 2, and 3 km. The results consistently showed high correlations between the metrics, with median correlation values of 0.89 for forest cover, 0.80 for fragmentation index, and 0.77 for connectedness index, indicating that the specific "scale of effect" of the species should not significantly impact the model performance in our analysis (Jackson and Fahrig, 2015). We used FRAGSTATS 4.2 to calculate these landscape metrics.
Abundance modelsWe employed a generalized mixed regression model (Zuur et al., 2009) to analyze the data and test two main hypotheses. The first scenario involved additive models, where the effect of habitat changes on species abundance would be consistent with our first hypothesis of equal sensitivity across species' geographic range. The second hypothesis was tested with interactive models, where the effect of habitat loss and fragmentation on species abundance would depend on the magnitude and direction of the biogeographic effect. In this case, we expected to observe the lowest sensitivity to habitat loss and fragmentation in populations located in regions with the highest environmental suitability, representing the core of the geographic range.
To explore potential curvilinear relationships between each biogeographic factor and species abundance, we tested two types of fits (linear and polynomial), considering theoretical predictions of species abundance distribution in geographical space (Pironon et al., 2017). The classical central-periphery model suggests low abundance at the extremes of geographic distribution and a peak of abundance in the geographic center, resembling a quadratic fit (Diniz-Filho et al., 2009). However, more complex fits were also considered if the environment exhibited a more intricate geographical pattern. Thus, we incorporated the possibility of linear or quadratic terms to account for different abundance patterns. Additionally, we included one landscape variable in our models to explain population responses to habitat loss and fragmentation (Rivadeneira et al., 2010; Pironon et al., 2017).
In our analysis, we log-transformed species abundance and fit it with a Gaussian error distribution using the lme4 package (Bates et al., 2015). We included terrestrial ecoregions (Olson et al., 2001) as a random effect to account for the spatial dependence of abundance sampling in each ecoregion. To address the heterogeneity in sampling effort among landscape sites, we incorporated the total sampling effort in each site as model weights.
To select the best model, we used multiple criteria, including statistical support based on the smallest values of BIC, BIC weights to estimate the probability of each model being the best model in the set, and residual diagnostic tests to ensure that the selected model had no residual diagnostic problems. Models with a ΔBIC ≤ 2 were considered equally supported, and the wi values indicated the probability of each model being the best in the set.
To visualize the results from the regression models, we generated plots using the plot model function from the 'sjPlot' package (Schoenbrodt and Rosseel, 2018). These plots allowed us to visualize the marginal effects of the continuous biogeographic metrics (range edge distance and environmental suitability index), which we grouped into three levels, including one standard deviation below and above the mean value. By choosing this classification, we effectively illustrated the impact of both predictive variables, landscape and biogeographic metrics, on species abundance. These visualizations provided a comprehensive understanding of the relationships between the predictor variables and species abundance, offering valuable insights into our analysis.
Classification of species into sensitivity variation across the geographic rangeTo classify species based on their sensitivity variation across the geographic range in response to forest loss, fragmentation, and connectedness, we implemented a two-step approach. Firstly, we determined whether each species' best model was an additive model, indicating equal sensitivity to habitat loss and fragmentation across the entire range, or an interactive model, suggesting varying sensitivities.
For species exhibiting interactive models, we conducted a spotlight analysis to explore the interactive effect between landscape and biogeographic metrics (Krishna, 2016). This involved decomposing each model interaction into three levels of biogeographic metrics and calculating the slope of the estimated regression for the relationship between the landscape metrics and species abundance at each level.
To compare the slope levels, we performed pairwise comparisons using t.ratio to compute the p-value. Subsequently, we classified species as having the highest sensitivity in regions with low environmental suitability or near the edge of the geographic range when the lowest level of the biogeographic factor exhibited the highest slope values. Conversely, when the opposite trend was observed, we classified species as having the highest sensitivity in regions with high environmental suitability or near the core of the geographic range. To carry out these decompositions and achieve the final classification based on their sensitivity response pattern, we utilized the 'emmeans' package in R. This approach allowed us to effectively differentiate species according to their specific sensitivities across their respective geographic ranges.
Effect of bird traits on interspecific variation in species sensitivity response patterns across species geographic rangesTo investigate whether bird traits contribute to interspecific variation in species sensitivity response patterns across species' geographic ranges, we conducted a principal component analysis (PCA). The PCA allowed us to examine whether species with similar trait combinations exhibit similar sensitivities to habitat loss and fragmentation across their geographic ranges. If species share similar principal component scores, it may suggest that they face similar limitations to group membership, as demonstrated by other species with equivalent PCA scores (Summerville et al., 2006). To assess the degree to which sensitivity groups explain trait space variance among species, we employed a permutational multivariate analysis of variance (PERMANOVA) framework, using the adonis function. The PCA and PERMANOVA were conducted using the 'vegan' R package (Oksanen et al., 2019).
ResultsOur study revealed four distinct patterns of population sensitivity to habitat loss, fragmentation, and connectedness across the range of environmental suitability and distance from the range edge (Figs. 2 and 3 and Table S5). The first pattern, observed in 17 species (21% of the total), demonstrated equal sensitivity, where habitat loss and fragmentation had the same influence on species abundance regardless of their biogeographic position or environmental suitability (Fig. 2a). For example, species like Synallaxis ruficapilla and Turdus rufiventris exhibited a consistent decline in abundance along the connectedness index and forest cover gradients, irrespective of their distance from the range edge or environmental suitability.
 Some species exhibit equal responses throughout their range. (b) Other species show higher sensitivity in regions with low environmental suitability or near the range edge. (c) Some species display higher sensitivity in regions with high environmental suitability or near the core of the range. To visualize the marginal effects of the continuous biogeographic metrics (range edge distance and environmental suitability index), we grouped them into three levels, including one above standard deviation (high), mean value (medium), and one standard deviation below the mean value (low). Shaded areas represent 95% confidence intervals. Legend: Log_abundance = log bird species abundance/100net-hours; fragmentation index = proportion of like adjacencies involving the forest class from spatially random distribution; forest cover (%) = proportion of landscape occupied by forest; connectedness index = physical connectedness of forest patches; environmental suitability index = geographic position classified according to environmental suitability (%); nearest distance = distance from the nearest edge of the geographic distribution (or log of distance). (Bird photos: # by de Paula FJ, Synallaxis ruficapilla by Paulo Côrtes, Drymophila ochropyga and Xiphocolaptes albicollis by nickathanas, Tangara sayaca sayaca by quitbanana, Dendrocincla turdina by Gustavo Forreque; all licensed under CC BY-NC-SA 2.0 or CC BY-SA 2.0).")
Response of bird species to habitat loss, fragmentation, and connectedness across their geographic range. (a) Some species exhibit equal responses throughout their range. (b) Other species show higher sensitivity in regions with low environmental suitability or near the range edge. (c) Some species display higher sensitivity in regions with high environmental suitability or near the core of the range. To visualize the marginal effects of the continuous biogeographic metrics (range edge distance and environmental suitability index), we grouped them into three levels, including one above standard deviation (high), mean value (medium), and one standard deviation below the mean value (low). Shaded areas represent 95% confidence intervals.
Legend: Log_abundance = log bird species abundance/100net-hours; fragmentation index = proportion of like adjacencies involving the forest class from spatially random distribution; forest cover (%) = proportion of landscape occupied by forest; connectedness index = physical connectedness of forest patches; environmental suitability index = geographic position classified according to environmental suitability (%); nearest distance = distance from the nearest edge of the geographic distribution (or log of distance).
(Bird photos: # by de Paula FJ, Synallaxis ruficapilla by Paulo Côrtes, Drymophila ochropyga and Xiphocolaptes albicollis by nickathanas, Tangara sayaca sayaca by quitbanana, Dendrocincla turdina by Gustavo Forreque; all licensed under CC BY-NC-SA 2.0 or CC BY-SA 2.0).
, we grouped them into three levels, including one above standard deviation (high), mean value (medium), and one standard deviation below the mean value (low). Shaded areas represent 95% confidence intervals. Legend: Log_abundance = log bird species abundance/100net-hours; forest cover (%) = proportion of landscape occupied by forest; connectedness index = physical connectedness of forest patches. (Bird photos: Elaenia obscura by Ron Knight from Seaford, East Sussex, United Kingdom, Tolmomyias sulphurescens by Erick Houli; all licensed under CC BY 2.0 or CC BY-NC-ND 2.0).")
Response variation of populations across geographic range and environmental suitability levels. Populations in intermediate positions or suitability levels show distinct responses from range extremes or environmental suitability levels. To visualize the marginal effects of continuous biogeographic metrics (range edge distance and environmental suitability index), we grouped them into three levels, including one above standard deviation (high), mean value (medium), and one standard deviation below the mean value (low). Shaded areas represent 95% confidence intervals.
Legend: Log_abundance = log bird species abundance/100net-hours; forest cover (%) = proportion of landscape occupied by forest; connectedness index = physical connectedness of forest patches.
(Bird photos: Elaenia obscura by Ron Knight from Seaford, East Sussex, United Kingdom, Tolmomyias sulphurescens by Erick Houli; all licensed under CC BY 2.0 or CC BY-NC-ND 2.0).
The second pattern, found in 11 species (14% of the total, Table S5), showed the highest sensitivity in populations located at the range edge or in regions with low environmental suitability (Fig. 2b). Species like Drymophila ochropyga and Xiphocolaptes albicollis exhibited the highest decline in abundance with forest cover in areas with the lowest environmental suitability and with fragmentation near the range edge, respectively.
The third pattern, observed in nine species (11% of the total, Table S5), displayed the highest sensitivity in populations located at the core of the range or in regions with high environmental suitability (Fig. 2c). For example, Tangara sayaca showed the strongest influence of fragmentation on abundance at the highest environmental suitability, and Dendrocincla turdina exhibited the strongest effects of connectedness away from the range edge.
The fourth pattern, observed in nine species (approximately 11% of the studied bird species, Table S5), demonstrated that the abundance of populations at both geographic range extremes or environmental suitability levels responded similarly to habitat loss and fragmentation. However, populations in intermediate positions or suitability levels exhibited distinct responses. Some species showed higher sensitivity at intermediate range positions compared to the core and edge range positions, while others displayed lower sensitivity. Species like Elaenia obscura and Tolmomyias sulphurescens exemplify this sensitivity variation within their geographic ranges (Fig. 3). For 43% of species, none of our predictive variables adequately explained their abundance variation (Table S5).
These patterns of population sensitivity to habitat loss and fragmentation reflected different types of interactions between predictive variables (Fig. 4). In the case of equal sensitivity, biogeographic and landscape metrics had independent effects on species abundance (e.g., Philydor atricapillus). However, in the other patterns, there were interactive effects, which could be either synergistic or antagonistic, depending on whether the two metrics acted in the same or opposite directions, respectively (Table 2, Table S5). In synergistic relationships, the effect of habitat loss and fragmentation was intensified depending on the geographic position of the populations along their range or level of environmental suitability. For example, Phaethornis squalidus exhibited a significant decline in abundance with forest cover reduction in regions closest to their range core, whereas the effect was weaker in populations near the range edge. In antagonistic relationships, the effect of habitat loss and fragmentation varied in the response direction depending on the geographic position of the populations. For instance, Myiothlypis flaveola showed a decline in abundance with forest cover decline in regions located at the range edge, but an opposite trend was observed at the range core.
 Additive effects between biogeographical and landscape metrics are observed in some species. (b) In interactive models, the strength and direction of population responses to landscape change vary due to synergistic interactions. (c) In interactive models, the strength and direction of population responses to landscape change vary due to antagonistic interactions. To visualize the marginal effects of continuous biogeographic metrics (range edge distance and environmental suitability index), we grouped them into three levels, including one above standard deviation (high), mean value (medium), and one standard deviation below the mean value (low). Shaded areas represent 95% confidence intervals. Legend: Log_abundance = log bird species abundance/100net-hours; forest cover (%) = proportion of landscape occupied by forest; connectedness index = physical connectedness of forest patches; environmental suitability index = geographic position classified according to environmental suitability (%); nearest distance = distance from the nearest edge of the species’ geographic range (log of distance). (Bird photos: Philydor atricapillus by nickathanas, Phaethornis squalidus by nickathanas, Myiothlypis flaveola by luizmrocha; all licensed under CC BY-NC-SA 2.0 or CC BY-SA 2.0).")
Response of bird species to habitat loss, fragmentation, and connectedness across their geographic range. (a) Additive effects between biogeographical and landscape metrics are observed in some species. (b) In interactive models, the strength and direction of population responses to landscape change vary due to synergistic interactions. (c) In interactive models, the strength and direction of population responses to landscape change vary due to antagonistic interactions. To visualize the marginal effects of continuous biogeographic metrics (range edge distance and environmental suitability index), we grouped them into three levels, including one above standard deviation (high), mean value (medium), and one standard deviation below the mean value (low). Shaded areas represent 95% confidence intervals. Legend: Log_abundance = log bird species abundance/100net-hours; forest cover (%) = proportion of landscape occupied by forest; connectedness index = physical connectedness of forest patches; environmental suitability index = geographic position classified according to environmental suitability (%); nearest distance = distance from the nearest edge of the species’ geographic range (log of distance).
(Bird photos: Philydor atricapillus by nickathanas, Phaethornis squalidus by nickathanas, Myiothlypis flaveola by luizmrocha; all licensed under CC BY-NC-SA 2.0 or CC BY-SA 2.0).
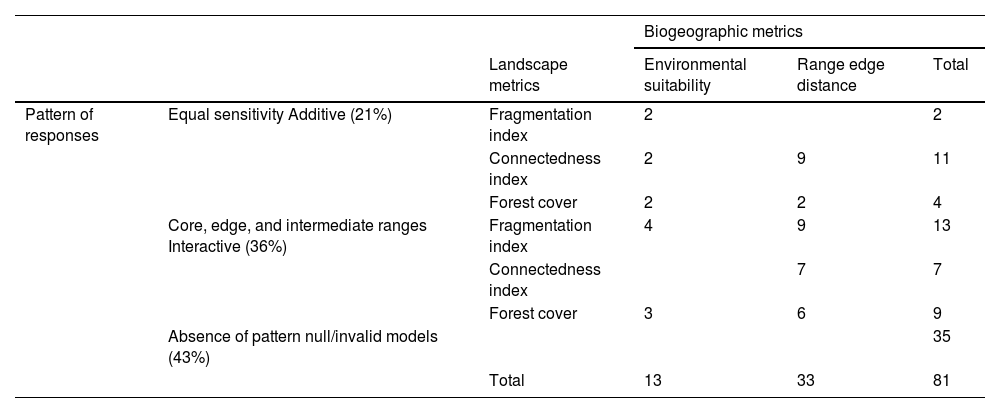
Distinct patterns of population sensitivity to habitat loss, fragmentation, and connectedness Abbreviations: Forest cover (%) = proportion of the landscape occupied by forest class; Connectedness index = measures the physical connectedness of the corresponding patch forests; Fragmentation index = an aggregation index that measures the proportion of like adjacencies involving the forest class from that expected under a spatially random distribution; Environmental suitability index = geographic position of site location classified according to environmental suitability; Range edge distance = distance from the nearest edge of species geographic range. The darker green indicates a higher number of species with this type of relationship than the lighter ones.
| Biogeographic metrics | |||||
|---|---|---|---|---|---|
| Landscape metrics | Environmental suitability | Range edge distance | Total | ||
| Pattern of responses | Equal sensitivity Additive (21%) | Fragmentation index | 2 | 2 | |
| Connectedness index | 2 | 9 | 11 | ||
| Forest cover | 2 | 2 | 4 | ||
| Core, edge, and intermediate ranges Interactive (36%) | Fragmentation index | 4 | 9 | 13 | |
| Connectedness index | 7 | 7 | |||
| Forest cover | 3 | 6 | 9 | ||
| Absence of pattern null/invalid models (43%) | 35 | ||||
| Total | 13 | 33 | 81 | ||
The PCA captured a significant amount of variation in species traits (first and second components accounting for 57.3% of the total variation; Fig. 5). However, the lack of significant differences among the sensitivity response groups suggested that the variation in traits was not strongly associated with sensitivity patterns (PERMANOVA, R² = 0.089, F3,45 = 1.37, p = 0.16; Fig. 5). Instead, there appeared to be more variation in traits within sensitivity groups, which could suggest that other factors beyond these traits are driving the observed sensitivity patterns.
, hand wing index (HWI), number of habitat types used in the species (NH), Extent of occurrence (total range size in km², EO), versatility index (number of ecoregions within the geographic range, VI), median body mass (g, BM) of species traits were present. PCA axes 1 and 2 explained a total of 57.3% of the variation. Response groups: Pattern (1) species were classified as equal sensitivity to habitat loss, fragmentation, and connectedness across the geographic range; Pattern (2) high sensitivity in regions with low environmental suitability or near the edge of the geographic range; Pattern (3) high sensitivity in regions with high environmental suitability or near the core of the geographic range; and Pattern (4) non-significant difference between the lowest and highest biogeographic levels, but had significance between the medium level of pairwise comparisons.")
PCA biplot with confidence ellipses for species’ sensitive response between biogeographic and landscape variables of 46 bird species. The relationship of forest dependence (FD), hand wing index (HWI), number of habitat types used in the species (NH), Extent of occurrence (total range size in km², EO), versatility index (number of ecoregions within the geographic range, VI), median body mass (g, BM) of species traits were present. PCA axes 1 and 2 explained a total of 57.3% of the variation. Response groups: Pattern (1) species were classified as equal sensitivity to habitat loss, fragmentation, and connectedness across the geographic range; Pattern (2) high sensitivity in regions with low environmental suitability or near the edge of the geographic range; Pattern (3) high sensitivity in regions with high environmental suitability or near the core of the geographic range; and Pattern (4) non-significant difference between the lowest and highest biogeographic levels, but had significance between the medium level of pairwise comparisons.
Our study on 81 bird species has shed light on the importance of investigating how populations respond to habitat loss, fragmentation, and connectedness across their geographic ranges. The identification of four distinct sensitivity patterns provides valuable insights into how different populations within a species may be impacted by environmental changes. These patterns include equal sensitivity, higher sensitivity at range edges, higher sensitivity at core ranges, and varying sensitivity in populations at intermediate range positions or suitability levels. Importantly, these patterns could not be explained by dispersal ability, habitat specialization, or geographic range size, suggesting that other factors are at play in driving the observed sensitivity patterns.
The interactions between biogeographic and landscape metrics have a strong influence on species abundances, resulting in either synergistic or antagonistic effects. These interactions change the strength and direction of species' responses to habitat loss and fragmentation depending on their biogeographic position or environmental suitability. While our results provide valuable insights into these interactions, it is essential to acknowledge that they are specific to the dataset and analysis methods used. Further research will be needed to fully understand the complex relationship between species traits and sensitivity to environmental stressors. Our findings underscore the need for conservation strategies that consider the varying sensitivities of different populations within a species. Traditional approaches that assume equal sensitivity across a species' range may not effectively protect vulnerable populations. Instead, tailoring conservation efforts to the specific needs of each population, considering their spatial position and interactions between factors, is crucial to ensure the effective management of biodiversity in the face of ongoing habitat loss and fragmentation.
The variations in genetic diversity and differentiation observed in species across their ranges, as discussed by Henle et al. (2017) and Banks-Leite et al. (2022), are influenced by various factors. These factors include environmental suitability, the ability of species to disperse, and the influence of biotic interactions. Habitat loss and fragmentation can lead to reduced genetic diversity within populations, while biotic interactions indirectly impact genetic variability, differentiation, and population sensitivity across a species' range. A comprehensive understanding of the complex interactions among these factors is essential for predicting the consequences of habitat loss, fragmentation, and range shifts on the genetic diversity and differentiation of species.
Our study did not support the common assumption of a direct link between dispersal capacity and sensitivity pattern. While most species distribution models and predictions of extinction risk assume equal sensitivity to habitat loss and fragmentation across geographic ranges or environmental suitability (Henle et al., 2004; Valladares et al., 2014; Boakes et al., 2018), simulations by Valladares et al. (2014) suggest that equal sensitivity among populations could occur when all populations have the same magnitude of phenotypic plasticity and unlimited dispersal ability, resulting in higher gene flux across the distribution range. The genetic homogeneity observed across the distribution range supports this explanation (Johannesson and André, 2006; Eckstein et al., 2006).
The highest sensitivity of range edge populations (or those in areas with the lowest environmental suitability) may be attributed to less suitable and lower-quality habitat available toward the range edge (Holt and Keitt, 2000, Holt and Keitt, 2005; Hardie and Hutchings, 2010). Under these stress conditions, populations may have lower genetic variability and stronger effects of genetic drift, leading to reduced resilience and increased sensitivity to habitat loss and fragmentation (Sagarin and Gaines, 2006; Henle et al., 2017; Macdonald et al., 2017; Prieto-Ramirez et al., 2020).
On the other hand, the highest sensitivity of core populations may be due to their pre-adaptation to survive in harsh and spatially-temporally stochastic environments. This pre-adaptation is thought to result from selective pressures that vary across geographic ranges or environmental conditions. These pressures arise from trade-offs in resource allocation, conservation, and constraints imposed by resistance mechanisms, as predicted by theoretical models such as those developed by Safriel et al. (1994) and Hoffmann and Blows (1994). Populations at the range edges or in habitats with lower environmental suitability are subject to extreme and variable environmental conditions, which create selection pressures for resistance to these stresses. This results in increased genotypic and phenotypic variation among the populations. These adaptations for resistance may improve the response of species to habitat changes (e.g. Tangara sayaca in Fig. 2c). There is growing evidence of adaptive evolution in sink habitats and genetic differentiation towards the range edge, supporting this explanation. For example, studies by Holt and Keitt (2005), Eckert et al. (2008) and Gaston (2009) have shown that range edge populations can differ in phenotypic characters and genetic structure. In some cases, they exhibit higher levels of individual fitness and phenotypic plasticity than most core populations, as demonstrated by Yakimowski and Eckert (2007) and Valladares et al. (2014).
Habitat loss and fragmentation can have varying effects on environmental stress conditions, depending on the type of interactions (synergistic or antagonistic) and the habitat preferences of species. For some forest specialist species with lower dispersal ability, the decline in abundance due to habitat loss and fragmentation can be synergistic (Warren et al., 2001; Holt and Keitt, 2005). However, for other species, the landscape effect can have opposite directions depending on their biogeographic position or environmental suitability. This seemingly contradictory result can be explained by considering biotic interactions in habitat selection. Sometimes, suboptimal habitats may be the best choice to avoid intra- or interspecific competitors, leading to different responses to habitat loss and fragmentation (Banks-Leite et al., 2022; Jacob et al., 2018). These complexities highlight the need for a nuanced understanding of the interactions between species and their habitats to effectively conserve biodiversity in the face of habitat loss and fragmentation.
Previous studies have attempted to predict which species are most vulnerable to habitat loss and fragmentation by analyzing morphological and biogeographical traits (Henle et al., 2004; Hatfield et al., 2018; Boakes et al., 2018). However, our study found that these traits were not reliable predictors of sensitivity to habitat loss and fragmentation. Future research should explore population-level traits and how they vary across environmental gradients and interact with habitat loss and fragmentation. Additionally, considering trait interactions may provide a more accurate understanding of species' sensitivity responses.
The varying sensitivity response patterns of species to habitat loss, fragmentation, and connectedness have significant implications for conservation strategies. Our findings suggest that one-size-fits-all conservation measures may not be effective for 36% of species due to the interactions between biogeographical and landscape metrics. Protecting and restoring land along the range edge, especially in transition regions, may be crucial for conserving vulnerable populations. Tailoring conservation efforts to each species' specific needs by considering their spatial position and interactions between factors is essential for ensuring the long-term survival of biodiversity in the face of environmental changes.
Limitations and proposed future research directionsOur study delved into the intricate relationship between habitat change and species sensitivity, aiming to provide insights into conservation strategies. To explore this issue, we conducted correlation tests on landscape metrics across various spatial scales (ranging from 500 m to 3 km). Our results revealed consistently high correlations between these metrics, suggesting that certain landscape characteristics maintain relative stability across scales, potentially mitigating the scale effect's impact on our model. However, scale-related implications extend beyond correlations. While our model's performance appears robust to scale, ecological processes often vary with scale, affecting result interpretation and generalizability. Conservation strategies could differ when applied across scales. Future research should address the scale effect by incorporating multiple scales and hierarchical modeling (Jackson and Fahrig, 2015; Moulatlet et al., 2021). In the conservation context, considering scale-related effects is crucial for effective strategies (Martin and Fahrig, 2012). Though our insights are valuable, the scale might influence action prioritization and restoration planning.
Another potential limitation we addressed relates to the selection of data sources for forest cover. Opting for Hansen et al. (2013) over MapBiomas (Project MapBiomas, 2023) could introduce variations in our analysis due to the diverse range of classifications within Hansen's forest definition. Hansen et al. (2013) employ a comprehensive definition of forest, encompassing everything from pristine tropical forests to tree monocultures. In contrast, MapBiomas provides a more nuanced interpretation, encompassing old-growth and secondary vegetation while excluding tree monocultures. This distinction is particularly significant in areas characterized by intricate land-use patterns, such as forest fragments with Eucalyptus-dominated matrices. While our dataset comparison demonstrated a robust correlation (Pearson correlation, r = 0.92, p < 0.0001), suggesting coherence between the sources, we acknowledge the potential influence introduced by this choice. We encourage continued exploration by the scientific community into the consequences of dataset selection on similar analyses. By considering alternative data sources and understanding the implications of varying forest definitions, researchers can enhance their understanding of how these variations might impact the outcomes of landscape-scale assessments.
ConclusionOur study provides valuable insights into the varying sensitivity of bird species to habitat loss and fragmentation across their geographic ranges and environmental suitability. The identification of four distinct sensitivity patterns highlights the complexity of species' responses to environmental changes. Biogeographical and ecomorphological traits were not sufficient predictors of species sensitivity, indicating the importance of investigating population-level traits and trait interactions in future studies. The implications of our findings for conservation strategies are significant. One-size-fits-all approaches may not effectively protect vulnerable populations, as the interactions between biogeographical and landscape metrics can alter the strength and direction of habitat loss and fragmentation effects. To ensure the long-term survival of biodiversity, conservation efforts should be tailored to each species' specific needs, taking into account their spatial position and the synergistic or antagonistic effects of environmental stressors. Targeted protection and restoration efforts in vulnerable areas, particularly in transition regions between ecosystems, are recommended.
Author contributionsThe contributions to the study conception and design were made by Érica Hasui, Alexandre Camargo Martensen, Alexandre Uezu, Rafael Guerra Pimentel, Milton Cezar Ribeiro, and Jean Paul Metzger. Material preparation, data collection, and analysis were performed by Érica Hasui and Rafael Guerra Pimentel, and Milton Cezar Ribeiro. The first draft of the manuscript was written by Érica Hasui, Rafael Guerra Pimentel, and Flavio Nunes Ramos and all authors commented on previous versions of the manuscript. All authors read and approved the final manuscript.
FundingThis study has been mainly supported by Fundação de Amparo à Pesquisa do Estado de São Paulo/São Paulo Research Foundation (FAPESP) and by Conselho Nacional de Desenvolvimento Científico/Brazilian Research Council (CNPq). JPM, EH, ACM, RGP, and MCR were supported by FAPESP (99/05123-4), German BMBF (Federal Ministry of Education and Research), CNPq/BMBF grant (690144/01-6 and 590041/2006-1). EH (151677/2005-0), FNR (306796/2020-1), and JPM (309767/2021-0) were supported by CNPq fellowship.
Ethical approvalOur research does not require ethical approval.
Data availabilityThe datasets generated during and/or analyzed during the current study are available in the support information Table S6. The Table S7 has the description of the fields related to Table S6.
Competing interestsWe have no competing interest.
We thank Sara Mortara and Leandro Tambosi for their great help in statistical procedures and landscape metric calculations. They also made valuable suggestions in the manuscript. We also thank two anonymous reviewers for their valuable comments on the manuscript. This study has been mainly supported by Fundação de Amparo à Pesquisa do Estado de São Paulo/São Paulo Research Foundation (FAPESP) and by Conselho Nacional de Desenvolvimento Científico/Brazilian Research Council (CNPq). JPM, EH, ACM, RGP, and MCR were supported by FAPESP (99/05123-4), German BMBF (Federal Ministry of Education and Research), CNPq/BMBF grant (690144/01-6 and 590041/2006-1). EH (151677/2005-0), FNR (306796/2020-1), and JPM (309767/2021-0) were supported by CNPq fellowship.
The following are Supplementary data to this article:

