


Landscape changes can lead to bee species loss, what impairs proper landscape level pollination processes, impacting both nature conservation and human welfare. Although landscape heterogeneity can rescue bee communities from collapsing, these insects seem sensitive to reduced functional connectivity, hindering pollen transfer among plants. Our objective was to verify which of these two factors, landscape heterogeneity or functional connectivity, can better explain variations of bee abundance and richness in a fragmented Atlantic Forest region. We sampled flower-visiting bees in 12 landscapes with varying heterogeneity and functional connectivity measured using a Functional Ecological Corridors framework. Both richness and abundance were affected by landscape factors, reaching its highest levels at intermediate levels of functional connectivity in highly heterogeneous landscapes, indicating the existence of strong regime shifts in the system. In low-forested landscapes, conservation actions for pollinating bees should focus on implementing diversified environments with high quality which are interspersed among each other and with native vegetation.
Human made landscape changes are among the most important drivers of species extinction, leading to the loss of important ecological processes (Laurance et al., 2002). However, there are still only few studies which try to understand landscape changes effects on key ecological processes, such as seed dispersal and predation (Galetti et al., 2013), herbivory (Banks, 1998) and pollination (Andrieu et al., 2009). Among these processes, animal mediated pollination has been recognized as the one with greater and more direct impact over human populations and wellbeing (Potts et al., 2016). Pollinating insects have major economic value, since at least 35% of worldwide food crops directly depend on them (Klein et al., 2007), annually generating U$ 577,00billion in environmental services (Potts et al., 2016).
The most important pollinating insects are bees, which are directly responsible for the maintenance of native plant diversity, since several plants depend on them to guarantee their reproduction (Ollerton et al., 2011). Nevertheless, these insects are very sensitive to environmental changes, specially to intensive land use and land change (Kennedy et al., 2013; Viana et al., 2012). Increases in landscape changes led to a worldwide decline in bee pollinators richness and abundance, which is even worse in tropical areas, where the proportion of animal pollinated plants is higher, when compared to temperate regions (Ollerton et al., 2011). This decline has severe consequences to natural ecosystems and agricultural production (Carvalheiro et al., 2010; Garibaldi et al., 2013).
Recent studies show that in landscapes with low remaining natural vegetation cover, pollinators richness and abundance, as well as agricultural productivity, may be rescued by high environmental heterogeneity (Kennedy et al., 2013; Moreira et al., 2015; Pryke et al., 2013). More heterogeneous landscapes allow greater resource diversity within the individuals foraging ranges, as well as varying environmental conditions and niche availability which allow a greater amount of interactions between plants and floral visitors (Fabian et al., 2013; Moreira et al., 2015). Landscape simplification has thus been termed as one of the major reasons for the decline of pollinators abundance (Viana et al., 2012).
However, pollinators usually do not perceive their landscapes as binary habitat-non-habitat systems, but use distinct landscape units in different ways and with differential survival costs (Moniem and Holland, 2013). In this sense, landscape heterogeneity should be functionally approached, considering not only landscape composition, but also its configuration and the actual effects of different kinds of environments for each studied species or process (Fahrig et al., 2011). In landscapes that have already been highly changed by human interference, native land cover types are commonly substituted by low quality inhospitable environments that are not accessed by bees. In fact, Kennedy et al. (2013) modeled landscape structure effects on bee communities and suggested that for each 10% increase of high quality habitats, bee abundance must increase about 37%. Since pollinators must move through the landscape to gather needed resources, the quality of different land units may change their flux among patches (Slancarova et al., 2014). These processes can deeply change landscape functional connectivity for pollinators, directly influencing their populations and maybe even hindering pollen transfer and overall pollination effectiveness (Vögeli et al., 2010).
Additionally, some authors even suggest that important extinction thresholds for plant-pollinator interaction networks should occur between 50 and 60% of native vegetation loss (Fortuna et al., 2013; Keitt, 2009). For the Atlantic Forest, there is evidence that crucial regime shifts influencing pollinating bee abundance occur in landscapes with about 40% of remaining forest (Ferreira et al., 2015). Although connectivity must be crucial to maintain proper landscape level pollination in such a forest depleted system, there are still only few empirical studies focusing on this aspect and even less which use a functional approach (Viana et al., 2012). Here, we aimed to evaluate the influence of functional landscape connectivity on the richness and abundance of flower visiting bees in a region with severely fragmented Atlantic Forest, in which remaining patches rarely cover more than 40% of the area. These forests are embedded within several different land use types with varying resources and survival costs for bees.
We hypothesized that flower visiting bee richness and abundance in forest patches should increase with landscape diversity because more different resources might be closely available in those landscapes, increasing foraging efficiency. Additionally, bee richness and abundance on flowers might also increase with functional connectivity, what leads to higher biological fluxes throughout the landscape. Also, we believe that these two landscape factors, heterogeneity and functional connectivity, might jointly increase bee richness and abundance in highly connected heterogeneous landscapes, with homogeneous low connectivity landscapes presenting poorer communities with less individuals. This kind of functional approach will allow better understanding of the human impact on pollination processes at the landscape level, helping to improve landscape management strategies to create better sustainable landscapes where pollinators can be more resilient to environmental changes.
MethodsStudy region and sampling locationsThis study was conducted between Cantareira and Mantiqueira mountain ranges (Fig. 1) in the state of São Paulo, Brazil. This is an Atlantic Forest priority conservation area, since it can serve as an important biodiversity corridor between these two highly forested regions (Cantareira and Mantiqueira). Land cover is very heterogeneous, being originally covered by montane dense ombrophilus forests (Veloso et al., 1991). However, intense anthropogenic pressures converted most of this vegetation into silvicuture, agriculture, cattle fields, suburban real state and dense urban development.
 South America with São Paulo state in dark gray; (B) Position of the study region (square) within São Paulo state; (C) 2km radius sampled landscapes with mapped land cover color legends.")
In this region, we mapped 40 randomly distributed landscapes (circles with 2km radius centralized in forest patches ranging from 15 to 25ha). Using Google satellite images and 1:5000 scale aerial photography we classified land cover of each landscape. Then, based on field verifications we selected 12 landscapes with central forest patches in advanced regrowth stages, making sure that these landscapes formed a gradient of landscape heterogeneity. Bee sampling was then conducted in the central point of each of these landscapes (Fig. 1). To reduce spatial autocorrelation among sample points, the minimum distance between patches was 3km (Zurbuchen et al., 2010). All selected landscapes had less than 40% of forest cover, below which structural landscape thresholds are expected (Andrén, 1994; Metzger and Décamps, 1997), making forest remnants smaller and more isolated from each other. Under such conditions, the spatial arrangement of landscape units shall become crucial for the survival of several native species (Fahrig, 1998), increasing the chances of connectivity and landscape level effects on the remaining biota (Fig. 1). We avoided correlation between forest cover and landscape diversity (p=0.27). Mapping and landscape measures were done using QGis (v1.8.0 and 2.8.2) and Fragstats 4.0.
Biological dataAt each selected forest patch we installed a regular hexagonal plot with 25m sides located at least 50m from any forest edge (modified from Taki and Kevan, 2007). Within each hexagon, we observed all understory flowering plants up to 2m in height for 15min and sampled all observed bee flower visitors using entomological nets. We consecutively repeated this sampling cycle for all flowering plants within the hexagon from 7:00 to 16:00h.
Each hexagon was sampled in four nonconsecutive sunny and warm (21 to 31°C) days, totaling 36 sampling hours per landscape, at the highest peak of understory flower availability in the region (Morelato LPC, personal communication), between October and November of 2014. Sampled bees were marked and individually stored in 92% ethanol. Bees were identified to the most possible specific taxonomic group by specialists and deposited at the Entomological Collection Prof. J.M.F. Camargo (RPSP) at the Biology Department from FFCLRP/USP. Bee richness and abundance were then calculated for each sampled landscape.
Landscape heterogeneity and functional connectivityTo measure landscape diversity and functional connectivity, we generated land cover maps with 10m resolution by manually classifying Google satellite images using the OpenLayers plugin in QGis (http://www.openlayers.org). The landscape surrounding each focal patch was classified into 14 different land units (Table 1) within 2km radii of sampling points. This distance was based on the average foraging distance of most bees (Zurbuchen et al., 2010). Within this radius, the percentage of forest varied from 11% to 39%, including both young and mature forests. The most common land-cover units were Open pastures (12–64%), Pastures with shrubs (4–31%) and Forestry (Eucalyptus; 2–26%). Agriculture, Urban areas and Rural villages were also significantly represented (Fig. 1).
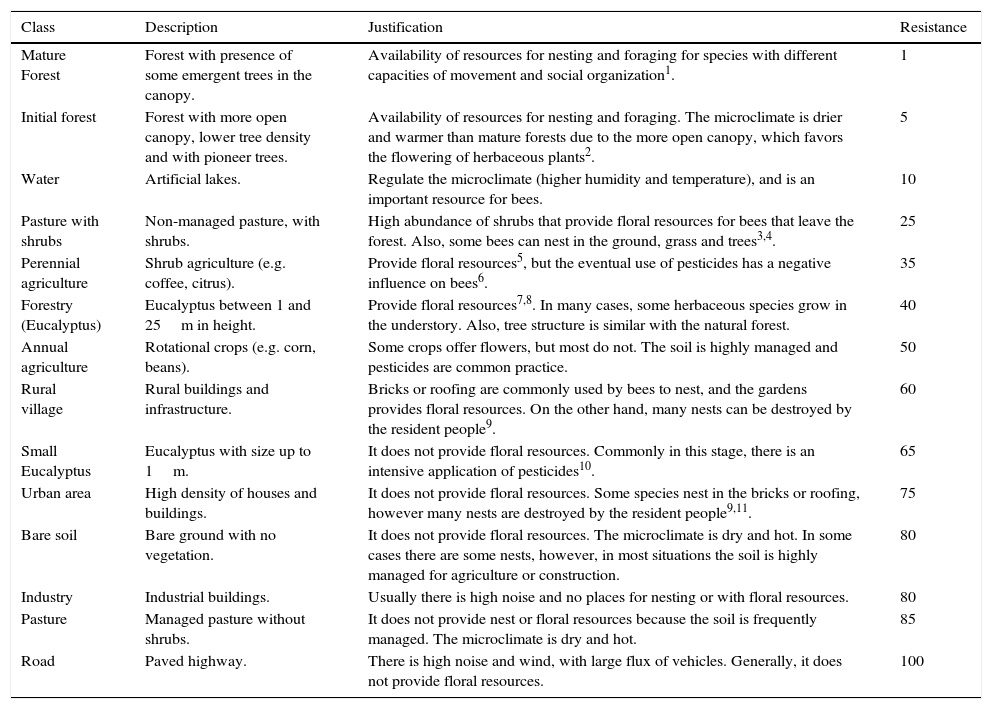
Resistance values attributed for each land cover unit, with specific justifications based on known bee biology and local resource availability.
| Class | Description | Justification | Resistance |
|---|---|---|---|
| Mature Forest | Forest with presence of some emergent trees in the canopy. | Availability of resources for nesting and foraging for species with different capacities of movement and social organization1. | 1 |
| Initial forest | Forest with more open canopy, lower tree density and with pioneer trees. | Availability of resources for nesting and foraging. The microclimate is drier and warmer than mature forests due to the more open canopy, which favors the flowering of herbaceous plants2. | 5 |
| Water | Artificial lakes. | Regulate the microclimate (higher humidity and temperature), and is an important resource for bees. | 10 |
| Pasture with shrubs | Non-managed pasture, with shrubs. | High abundance of shrubs that provide floral resources for bees that leave the forest. Also, some bees can nest in the ground, grass and trees3,4. | 25 |
| Perennial agriculture | Shrub agriculture (e.g. coffee, citrus). | Provide floral resources5, but the eventual use of pesticides has a negative influence on bees6. | 35 |
| Forestry (Eucalyptus) | Eucalyptus between 1 and 25m in height. | Provide floral resources7,8. In many cases, some herbaceous species grow in the understory. Also, tree structure is similar with the natural forest. | 40 |
| Annual agriculture | Rotational crops (e.g. corn, beans). | Some crops offer flowers, but most do not. The soil is highly managed and pesticides are common practice. | 50 |
| Rural village | Rural buildings and infrastructure. | Bricks or roofing are commonly used by bees to nest, and the gardens provides floral resources. On the other hand, many nests can be destroyed by the resident people9. | 60 |
| Small Eucalyptus | Eucalyptus with size up to 1m. | It does not provide floral resources. Commonly in this stage, there is an intensive application of pesticides10. | 65 |
| Urban area | High density of houses and buildings. | It does not provide floral resources. Some species nest in the bricks or roofing, however many nests are destroyed by the resident people9,11. | 75 |
| Bare soil | Bare ground with no vegetation. | It does not provide floral resources. The microclimate is dry and hot. In some cases there are some nests, however, in most situations the soil is highly managed for agriculture or construction. | 80 |
| Industry | Industrial buildings. | Usually there is high noise and no places for nesting or with floral resources. | 80 |
| Pasture | Managed pasture without shrubs. | It does not provide nest or floral resources because the soil is frequently managed. The microclimate is dry and hot. | 85 |
| Road | Paved highway. | There is high noise and wind, with large flux of vehicles. Generally, it does not provide floral resources. | 100 |
Superscript numbers refer to the appropriate bibliography that can be found at Table S1.
We calculated landscape heterogeneity within these landscapes with the Shannon Landscape Diversity Index (SHDI), which equals minus the sum of the total landscape proportion of each land-cover unit multiplied by its natural logarithm. It increases when the number of different land-cover units increases and/or the proportional area of these units becomes more equitable (McGarigal et al., 2012). We used this index because it is sensitive to the occurrence of relatively rare environments, such as riparian forests and dense bushy patches, which could be functionally very important for bees.
In addition to landscape diversity, we also measured Functional Landscape Connectivity within the same 2km radii considering varying functional displacement costs for each landscape unit. We estimated costs based on environmental quality and consequent resistance to foraging movement by assuming that bees will move better through higher quality environments (Viana et al., 2012). This estimation was individually done for each land use and land cover unit in the landscape, using as criteria the resource availability and other characteristics of each unit for these species. To gather the information needed to do this estimation, firstly we did a bibliographical revision about the effects of the type of management (e.g., use of insecticides or soil compaction) and each land-cover unit on bees. With this information, we ranked the land-cover units’ costs for bees, focusing on the most common families registered in the reviewed studies. The cost values were based on comparative estimates of the availability of foraging and nesting resources in each land-cover unit, being 1 for the land-cover unit with more resources and, hence, higher likelihood of having bees moving through it, and 100 for the land-cover unit with less resources, what means lower likelihood of having bees in it. Secondly, we consulted three invited Atlantic Forest bee ecology experts to adjust our literature-based estimates. We gave each expert a table, maps and satellite images describing each land-cover unit. Each expert provided their own cost rank for the land-cover units for bees. Finally, the experts were gathered in a meeting to discuss about all ranks together, resulting in a more robust rank which accurately represents environmental quality as a surrogate to infer movement resistance for bees (Table 1).
For the landscape connectivity estimation, we used the free software package LandScape Corridors (LSCorridors) to simulate functional ecological corridors (Ribeiro et al., 2017). The environmental quality based resistance values shown in Table 1 were attributed to each pixel of the same raster land cover maps used for the heterogeneity measures, generating resistance surfaces over which LSCorridors could simulate multiple-paths corridors through areas with high likelihood of use by bees. Resistance surfaces can be interpreted as maps of the cost a bee would face when moving through each pixel of the landscape. In this way, the sum of the individual resistance values of all pixels used by a simulated bee moving between two points represent the functional cost faced by that bee.
The central points of the focal patches of each mapped landscape were used as sources of simulated bees which should move to 30 surrounding randomized target points in each landscape, creating a least-cost path (Adriaensen et al., 2003) between these points. To avoid simulating paths solely within the focal patch, all randomized points with a distance less than 250m of each source were removed from the analysis. Because there is a random effect each time LSCorridors generates a path, each source-target pair (sampling point to random point) was simulated 20 times. Landscape functional connectivity was calculated using two metrics available in LSCorridors output file: (i) minimum Euclidian distance in meters between the source and target points, and (ii) total cost of the simulated path (sum of all cost values of the pixels used in the path). From this data, we derived for each landscape its Functional Connectivity Index (FCI; Santos, 2014), estimated as:
where “Fc” is the mean functional cost between the source point and all considered surrounding targets and “Ed” is the mean Euclidean distance between the same set of source-target pairs. Thus, the index theoretically can range from 0 when all targets are at the edge of landscapes completely dominated by a low-quality environment (cost value of 100) to 10 when all targets are maximally close to the source with only pixels of the highest environmental quality (cost value of 1) in between. Landscapes in which FCI values are higher can then be interpreted as having higher functional connectivity because of better environmental quality.Data analysis
To evaluate the effects of landscape diversity and functional connectivity on flower visiting bees, we used Generalized Additive Models (GAM) with Poisson probability distributions (Zuur et al., 2009). GAMs use a sequential smoothing parameter that can model multiple response variables in the same model even if their relationships are non-linear, allowing better model interpretation when two explanatory variables are together in the same model (Zuur et al., 2009). In this sense, an additive multiple model already includes possible interactions between explanatory variables, avoiding the need to use parameter inflated interactive models (Zuur et al., 2009). Based on that, we generated for each dependent variable, bee richness or abundance, four different models, which represented our initial hypotheses. These models included as explanatory variables either (1) landscape heterogeneity, (2) functional connectivity, or (3) both variables together in additive models. We also included a (4) null model, which represented a null hypothesis considering random effects of landscape diversity or functional connectivity on bee richness or abundance.
A model selection approach based on second order Akaike's Information Criteria (AICc; Burnham and Anderson, 2002) was used to compare the four competing models for each dependent variable. To interpret the results, we considered both AICc and Akaike weights (wi). AICc uses maximum likelihood estimation to rank the models in a given set according to its parsimony. The model with the lowest AICc has better support and is interpreted as the most plausible in the rank, but models with an AICc difference to the best model (Δi) lower than 2.0 are given equal support. Akaike weights expresses the relative odds for each model of being the best model given the evidence in the set (Burnham and Anderson, 2002; Zuur et al., 2009). All analyses were done in the R program version 2.15.0 using the bbmle and mgcv packages (Bolker and R Development Core Team, 2012; Wood, 2011).
ResultsWe collected 296 individual flower-visiting bees of 59 species. The most abundant species was Plebeia droryana (n=52), followed by the exotic Apis mellifera (n=31), Paratrigona subnuda (n=19) and Paratetrapedia sp4 (n=19). Plebeia droryana was the only species collected in all sampling units and 70% of all A. mellifera were collected in a single patch surrounded by pastures and Eucalyptus. Between sites bee abundance varied from 3 to 76 individuals, and richness from 3 to 25 species.
Both landscape diversity and functional connectivity were important in explaining bee richness and abundance since only little support could be given to the null models (Table 2). For bee richness, the additive model containing both explanatory variables presented a very low AICc in relation to the second ranked model and was strongly supported by wi (close to 100%). Bee abundance also presented better support to the model with two explanatory variables. Although the null model was the second ranked in the set, its AICc value was relatively high, with a weight of evidence about six times lower than the first ranked model, a difference higher than between models degrees of freedom (Table 2). This favors the additive multiple model as the best one describing landscape structure influence over bee abundance.
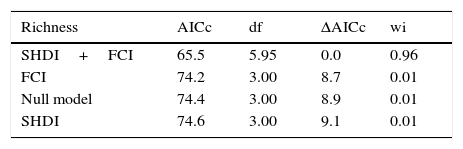
Model selection results for both bee richness and abundance according to the second order Akaike Information Criterion (AICc).
| Richness | AICc | df | ΔAICc | wi |
|---|---|---|---|---|
| SHDI+FCI | 65.5 | 5.95 | 0.0 | 0.96 |
| FCI | 74.2 | 3.00 | 8.7 | 0.01 |
| Null model | 74.4 | 3.00 | 8.9 | 0.01 |
| SHDI | 74.6 | 3.00 | 9.1 | 0.01 |
| Abundance | AICc | df | ΔAICc | wi |
|---|---|---|---|---|
| SHDI+FCI | 103.3 | 5.66 | 0.0 | 0.77 |
| Null model | 107.0 | 3.00 | 3.7 | 0.12 |
| FCI | 108.4 | 3.00 | 5.1 | 0.06 |
| SHDI | 109.2 | 3.00 | 5.9 | 0.04 |
ΔAICc difference to the best model; wi, Akaike's weight; SHDI, Shannon landscape diversity index; FCI, landscape functional connectivity index; Null, null model considering no effects of explanatory variables.
The best models thus indicate that bee richness and abundance are determined by the joint effects of both landscape diversity and functional connectivity in these highly-deforested landscapes. But differently from the monotonic behavior which we initially expected, a graphical analysis of the prediction surfaces given by the best ranked models show an apparent non-linear behavior of bee richness and abundance to landscape structure. Understory flower visiting bees were consistently low in landscapes with both, very low or high functional connectivity, but almost doubled with increases in landscape diversity when functional connectivity values were between 3 and 4 (Fig. 2). So, both bee measures reached their highest peaks at highly heterogeneous landscapes with intermediate levels of functional connectivity of about FCI=3.5, a pattern somewhat different from our initial expectations.
Discussion based on the best selected Generalized Additive Models (GAMs) for both bee richness and abundance relative to Landscape Functional Connectivity (FCI) and Landscape Heterogeneity (SHDI). Dots indicate sampled points used in the GAMs.")
Bee richness and abundance in understory flowers were low when functional connectivity was too high or too low, but varied according to landscape diversity at intermediate functional connectivity values at a rather narrow range. This indicates that the system we observed might be governed by strong regime shifts according to landscape structure (Pardini et al., 2010; Ferreira et al., 2015). To understand what this means, we first need to recall that the permeability values used for the landscape units were attributed greatly based on presumed resource availability at a certain type of environment. In this way, functional connectivity is not only reflecting the landscape ability to facilitate the flux of bees, but also is an indication of overall landscape quality for these insects. Possibly, in places with low functional connectivity, even if environmental heterogeneity is high, the individuals are not able to flow through the landscape, being cloistered in forest patches with low quality surroundings. The cost of moving through the landscape might then become too high and only the most generalist species, such as A. mellifera, which was most abundant only in very low quality impermeable landscapes, may be able to survive.
On the other hand, in highly connected landscapes the higher accessibility to different quality land cover types allow flower visitors to find and use more diversified feeding and nesting resources even outside forested areas (Viana et al., 2012). As a consequence, bees are probably foraging in several different environments across the landscape, being spatially widespread. Since in this case the flowers we observed are competing for bees with a larger amount of other floral resources, high functional connectivity would invariably lead to lower local bee richness and abundance in our samples. This does not mean that the bee community is less diverse or abundant, but might just be more overdispersed in the environments surrounding the focal patches. Studies evaluating flower visiting bees flux across different spatially structured environments are, however, scarce (Viana et al., 2012) and this hypothesis still needs empirical verification.
Nevertheless, we might have found evidence that the non-forested environments can be very important for Atlantic Forest bees. Our results clearly show that landscape diversity is a crucial factor to determine bee diversity on understory forest flowers when combined with intermediate overall functional connectivity. In such landscapes, environmental quality is much more variable and not all available environments can be easily crossed or used by bees. Within this scenario, homogenized landscapes lead to a general lack of resources and low permeability, reducing population sizes and species diversity (Moreira et al., 2015).
However, when permeable environments are not widespread in the landscape, available resources become more spatially structured. In this case, landscapes with higher diversity have better environmental complementarity of feeding and nesting resources within bees foraging ranges, especially in periods of scarcity. Moreira et al. (2015), has found a similar pattern in the Brazilian savannah (Cerrado), where plant-pollinator networks were larger (mostly because of bees) in more diverse landscapes composed by more irregular patches. This leads to higher environmental interspersion, what increases immediate surrounding quality. When functional connectivity around a given forest patch exists, but is somehow limited, higher environmental diversity can generate alternative routes through the landscape, increasing permeability and bee access to forests, where most floral and nesting resources are probably concentrated.
In this study, we considered landscapes with a maximum amount of remaining forests of 40%, most being below forest loss levels known to cause regime shifts for Atlantic Forest bees (Ferreira et al., 2015). In such system, even in the less forested places we found higher richness and abundance in functionally permeable landscapes with high environmental diversity within bees foraging ranges. Kennedy et al. (2013) have also found positive effects of landscape quality measures derived from resource availability for bees, but based on previous studies, with different objectives, sample design and effort.
We are presenting one of the first results about landscape connectivity effects on flower visiting bees which considers not only structural aspects of the landscape, but also a clear functional approach. Our framework weights the importance of each land cover type based on how bees might use or react to it, potentially changing their spatial behavior. We can conclude that, in contexts like ours, the interaction between configuration (affecting connectivity) and quality of the environments (directly linked to resource availability) surrounding the forest patches is relevant for bee richness and abundance on flowers.
A functional approach based on known bee biology is essential to improve our comprehension of the effects of landscape heterogeneity and functional connectivity on bees and possible consequences to pollination processes in regions of intense human activity. Bee friendly landscapes can increase their numbers and diversity on flowers in natural and cropped environments, consequently leading to better delivery of efficient pollination services. So, in landscapes with low forest cover, management efforts should prioritize not only forest conservation and restoration, but also the implementation of diversified environments with better quality (even if they are anthropogenic), interspersed among each other and with native vegetation. This would lead landscapes to higher functional connectivity and better permeability for bees, promoting higher abundance of pollinators with better chances of surviving in various environmental conditions amidst human endeavor.
Conflicts of interestThe authors declare no conflicts of interest.
We thank the FAPESP Project n° 2013/50421-2 and CAPES for financial support and everybody that helped us during fieldwork, especially Rafael Souza Cruz Alves. We gratefully acknowledge the taxonomic support given by Sidnei Mateus, Eduardo Almeida, José Amílcar Tavares Filho and Milton Groppo. We also thank Paula C. Montagnana and Maria J. de Oliveira Campos for the support given to define the cost values for bees.
The following are the supplementary data to this article:

