


Selective logging impacts biodiversity and ecosystem services in forest ecosystems, but we know little about its main drivers in the Atlantic Forest. We investigated selective logging along a chronosequence (mature, late secondary and early secondary forests) in a State Park in Pernambuco, Brazil, and hypothesised that it is driven by variables of supply (forest age, density, richness and biomass of living trees) and access (nearest edge and declivity). Selective logging was described by richness, density and biomass of logged trees. We predicted the relationship of logging to be positive with supply and negative with the distance of access. Logged trees comprised 267 stumps, 55 species and 5.11 Mg.ha-1 in one year, corresponding to 2.8%, 20.8% and 0.37% of living trees density, richness and biomass. Selective logging was the highest in richness in mature forest, influenced by access and forest age. Access influenced higher species removal in the early-secondary forest, despite its lower richness, while the lowest logging values were recorded in the late-secondary forest, regardless of its higher supply than early-secondary forest. Logging occurs in more accessible areas, where tree species exploitation will depend on the available supply. In this scenario, integrated actions for biodiversity and ecosystem services conservation should account for socioeconomic demands, vigilance and control.
Selective logging practised by small-scale loggers in tropical forests are often illegal and not subject to a sustainable forest management plan (Dieter, 2009; Tacconi et al., 2016). Along with deforestation, these harvesting activities happen mostly to meet the growing demands for food, water, wood, medicines, fibre and fuel (Ash et al., 2010). Consequently, over the last decades, with the rapid demographic growth, human needs have led to more extensive changes in forest ecosystems than in any comparable period in history (Hansen et al., 2013; Watson et al., 2016). Contradictorily, the same forests are among the biologically richest and most diverse ecosystems and provide habitat for more than half of the known terrestrial plants and animals in the world (Köhl et al., 2015; Morales-Hidalgo et al., 2015). Forests are also noticeable for their role in providing ecosystem services, which assure the maintenance of ecological functions and guarantee human well-being in space and time (Costanza et al., 2014; Keenan et al., 2015; MEA, 2005).
While it is clear that selective logging hugely affects biodiversity, forest ecosystem services, and ultimately social and economic aspects and human life quality (Díaz et al., 2019), its major impacts and drivers are still weakly comprehended. This is especially true in the tropical domain, where the most significant proportion of forests occur (FAO, 2020). Uncontrolled selective logging is a source of chronic disturbances (Singh, 1998), which impacts tree communities and forest structure, leading to species loss. Trees are logged in a non-random selection, in which several factors influence the decision, such as species identity and density, which can vary according to the category of use. For instance, local communities' dependence on fuelwood provision tends to be a significant factor in species selection (Gonçalves et al., 2016; Sousa et al., 2019). Human groups potentially include dozens of fuelwood species but usually focus on a smaller number (Albuquerque et al., 2017; De Medeiros et al., 2011). The domestic use of wood for fuel is of central concern to forest conservation because it requires more frequent logging due to a demand for a faster replacement in the houses. Data inventoried by De Medeiros et al. (2011) revealed that 92% of the logged tree volume per year in a forest landscape were for fuelwood, mainly concentrated on ten tree species and replaced every 55 days. Identifying the drivers of selective logging and the groups or local communities with the highest demand for use is imperative for developing efficient strategies for conserving forest biodiversity (Gavin and Anderson, 2007). Drivers may include plant availability, as investigated by Gonçalves et al. (2016) and proximity from roads and relief influence, as analysed by Putz et al. (2019). Other required variables include identifying the target species, their role in the forest assemblage and their conservation status since such species can be (or become) rare or threatened (Gan et al., 2016).
Logging also impacts ecosystem services since the practice reduces above-ground carbon stocks and leads to the degradation of water and soil quality (Asner et al., 2005). Selective logging produces a conversion of one type of ecosystem service into another, benefiting the logger at high costs to the forest balance (Rodríguez et al., 2006). For example, unsustainable logging converts the ecosystem service of climate regulation (trees remove the main greenhouse gas CO2 from the atmosphere and stock in tree biomass) into service of provision (biomass will be used as firewood, constructions and other uses). Thus, logging leads to the long-term unavailability of both services. The consequences and synergisms of such conversions, for instance, the impact of fuelwood consumption on biodiversity and carbon stocks maintenance, is still poorly understood (Specht et al., 2015).
Recognised as one of the most extensive tropical forests globally and a significant supplier of ecosystem services, the Brazilian Atlantic Forest (BAF) currently covers 28% of its native extension (Rezende et al., 2018). BAF is a mosaic of primary and secondary forests, is highly fragmented and encloses only 9% of strictly protected areas (IUCN Categories I-IV) (Rezende et al., 2018; Ribeiro et al., 2009). In its northern portion, the most endangered part of the BAF, only 1% of the area is strictly protected (Ribeiro et al., 2009). In areas with restricted use and their surroundings, selective logging is not allowed by the law. Even when forbidden, there are records of chronic uses of forest resources of varying intensities and frequencies (Laurance et al., 2012). Following a global pattern, there is an increase in secondary forest cover in the BAF, which currently plays the role of being a potential repository for biodiversity and ecosystem service provision, although with reduced potential, as they happen to be in critically disturbed landscapes (Arroyo-Rodríguez et al., 2017).
Investigation of selective logging patterns in the BAF usually concentrates on surveys of plant resources, demands, and their socioeconomic drivers (Christo et al., 2012; Da Cunha and De Albuquerque, 2006; De Medeiros et al., 2011; Specht et al., 2015). There is also some information about the impacts on tree assemblages (e.g. Carvalho et al., 2015; Villela et al., 2006) and the influence of plant species availability on the selection (Gonçalves et al., 2016). The influence of access on logging, measured as distance, a focus of research with high relevance in other moist tropical forests (e.g. Putz et al., 2019), has not yet been accessed for BAF. Regarding forest age, when assessed, investigation often follows the post-logging recovery. However, considering the actual expressive number of secondary forests, there is a lack of studies investigating to what extent such secondary patches supply wood through illegal harvesting. There is evidence of this use, but only based on direct assessments from loggers (e.g. Specht et al., 2015) and not using forest data. Therefore, questions to be answered relate the pattern of selective logging in the BAF to its drivers, including access and supply offered by forests at different ages.
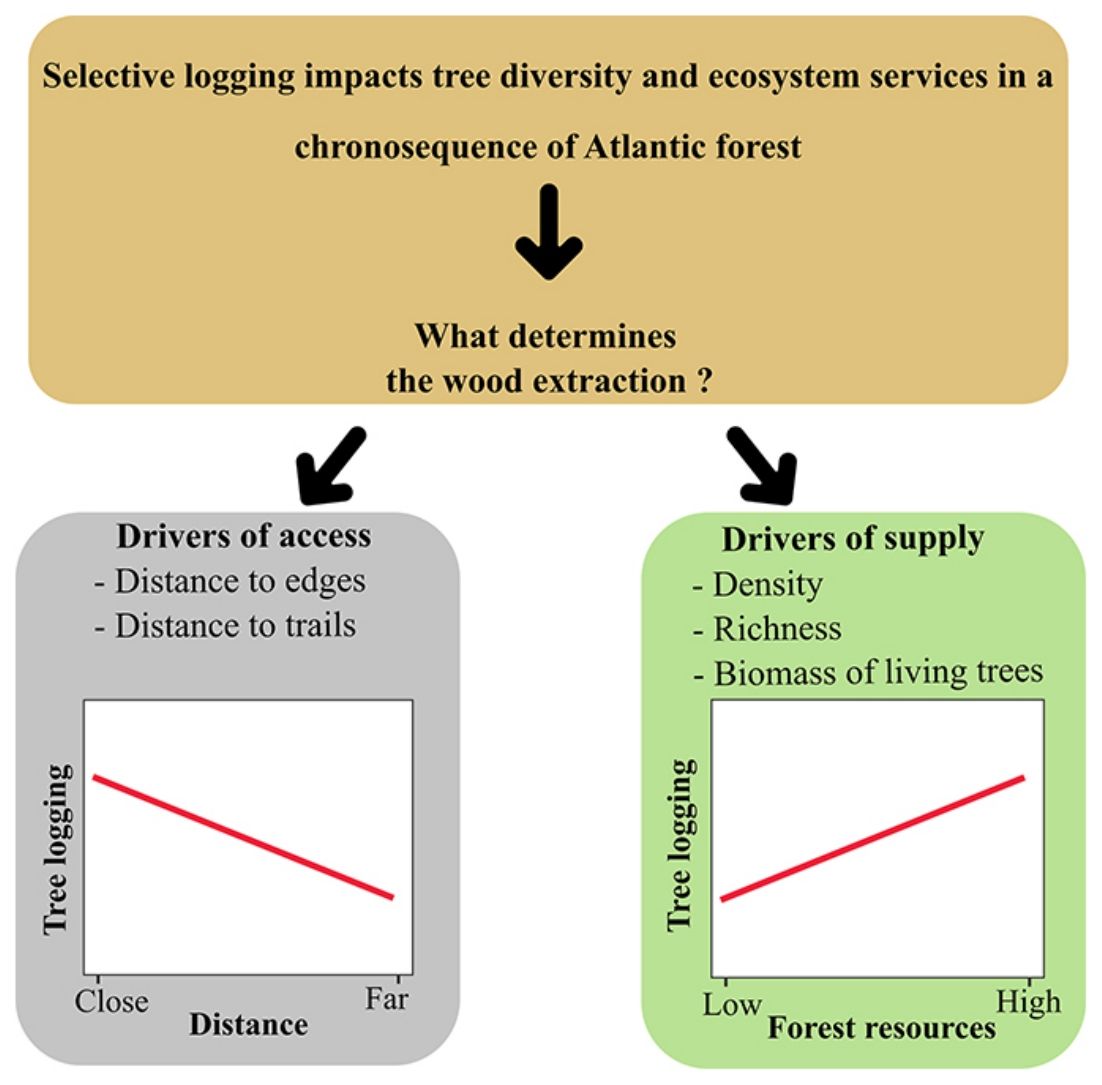
Long-term monitoring programs are excellent opportunities for identifying what drives human populations to illegal logging and the forest resources involved. Since 2013, a Biodiversity Research Program (PPBio) site was set up in an area within the BAF, the Dois Irmãos State Park, for biodiversity inventories, conservation, and monitoring. The area is a mosaic of forest under different succession stages where, although strictly protected, unauthorised selective logging occurs. In this scenario, this research investigates the patterns of illegal logging in a BAF chronosequence and tests the hypothesis that supply and access explain selective logging. We describe logging by density, richness and biomass of logged trees. Drivers of selective logging are of two types: supply variables (forest age, as a proxy for vegetation size, density, richness and biomass of the live assemblage) and access (distance to the nearest edge and declivity). As a prediction, we expect the relationship of logging to be positive with supply and negative with the distance of access; thus, more mature and accessible areas will be the most exploited by the local population.
Material and methodsStudy areaThe study was carried out at the Dois Irmãos State Park (PEDI), a protected area (IUCN Category II), located in Recife, Pernambuco, Brazil (7° 57'22,29" to 8°00'56.4"S, 34°56'0.679" to 34°58'13.63" W). The PEDI covers 1,158.51 ha divided into two portions. One fragment consists of mature forest and covers 384.42 ha; the other comprises 774.09 ha of younger secondary forest in two successional stages (Fig. 1). The chronosequence in the area, defined based on analysis of aerial photographs (1968 and 1981) and satellite images (2015), is defined as: Mature Forest (MF), which reached this condition for at least 60 years; Late Secondary Forest (LSF), with ages ranging from 38 and 50 years; and Early Secondary Forest (ESF) with less than 38 years.
, Recife - Pernambuco, Brazil, and the RAPELD module of the Biodiversity Research Program (PPBio). In highlights, different colours show the sampling area’s structure, according to the chronosequence in the area.")
The climate in the area is classified as As' (hot and humid), according to the Köppen-Geiger classification, with an average monthly temperature above 23 °C and an average annual rainfall of 2,263.4 mm, with a rainy season in the autumn-winter period (Data from the Brazilian National Institute of Meteorology repository, for the period 1981-2010, portal.inmet.gov.br/normais). Predominant soil types in the area are ferralsols, acrisols, and arenosols, according to the Soils of Northeast Survey (Embrapa Solos UEP Recife, solos.uep.cnps.embrapa.br). The most common and abundant tree families in the area are Fabaceae, Lecythidaceae, Anacardiaceae, Melastomataceae and Moraceae, and the most common species are Eschweilera ovata (Cambess.) Mart. ex Miers, Pogonophora schomburgkiana Miers ex Benth, Helicostylis tomentosa (Poepp. & Endl.) Rusby, Chamaecrista ensiformis (Vell.) H.S.Irwin &. Barneby and Thyrsodium spruceanum Benth.
Data collectionIn 2013, a RAPELD (an acronym for Rapid Assessment Surveys - RAP and Long-Term Ecological Research - PELD) module of the Biodiversity Research Program, PPBio (Magnusson et al., 2005) was set up in the area. It consists of 10 plots (250 m × 40 m each) established systematically and following the isolines. In each plot, living trees with a diameter at breast height (DBH) ≥ 5 cm were inventoried, measured and identified (see Castilho et al., 2014; Magnusson et al., 2005). Data were obtained from the ten plots of the module from 2015 to 2018 and are part of the PPBio – PEDI site database (totalling ∼10 ha).
In 2019, all tree stumps remaining from logged trees were marked, and their diameters at the top and heights were measured in all ten plots. For data sampling, each plot was subdivided into 5 sample units of approximately 50 m × 40 m. Stumps were classified according to their decomposition stages in: Stage 1 (recent cuts, with exudate or structures still visibly green and hydrated), Stage 2 (dry wood, loose bark and initial presence of decomposers), and Stage 3 (old cuts, in advanced decomposition). Whenever possible and based on dendrological features, stumps were identified to species level. Scientific names followed Flora do Brasil (Flora do Brasil 2020 under construction – www.floradobrasil.jbrj.gov.br).
Biomass estimation for living trees and lost biomass from logged treesWe estimated above-ground biomass (AGB) of living trees applying the pantropical allometric equation by Pearson et al. (2005) (Eq. 1), which is based on the DBH of trees as the independent variable. This equation was chosen because of its best performance for AGB estimation in the same area among five allometric equations examined by Fonsêca et al. (2020). This procedure estimated how much tree biomass is there for each individual, sample unit, and plot at different forest ages.
where: AGB, above-ground biomass; EXP, exponential; DBH, diameter at breast height (cm); Ln, Neperian logarithm.To estimate the lost biomass of logged trees, since we had the diameter of stumps and not the DBHs, we applied a correction factor to convert the diameters at the level of cuts onto DBH. We sampled 80 living trees in the field to find the correction factor, with diameters ranging from 5.0 to 22.6 cm. We measured tree diameters at the ground level, at the centre of four height classes and 130 cm (DBH). Correction factors calculated and the applied methodology are described in Table S1 in Supplementary information. Height and diameter classes followed the distribution of stumps in the sample of logged trees. After obtaining the estimated DBH for logged trees, we calculated tree AGB of each individual sampled as a stump, applying the same equation by Pearson et al. (2005). Thus, we could estimate how much tree biomass selective logging removed for each individual, sample unit and plot at different forest ages.
Data analysisWe evaluated selective logging (dependent variables) in relation to supply and access (independent variables), all calculated per sample unit (SU) (10 plots × 5 SU per plot). Variables for selective logging included density (number of stumps), richness (number of species) and biomass (Mg) of logged trees. Supply variables were: plot age (three successional stages: MF, LSF and ESF), density (number of individuals), richness, and biomass of living plants (Mg). We describe access as the distance of each SU (centre) direct to the nearest edge (m), the distance of each SU to the nearest trail (m) and declivity, collected in the field, for every SU, with an inclinometer. Predictor variables were standardised to mean 0 and 1 standard deviation, using the method Standardize of the decostand function (R package Vegan, Oksanen et al., 2020).
Firstly, a generalised linear mixed model (GLMM) was performed for testing our hypothesis for each of the three dependent variables and including all independent variables of supply and access. Plots and sample units were considered as random factors, aiming at reducing the pseudo-replication bias. We used the Gaussian distribution in the biomass response model and Poisson distribution for density and richness models. Subsequently, a model simplification procedure was performed using the Akaike Information Criterion (AIC) to retain the best model. This procedure removes non-significative variables (p > 0.05) to enhance model fit and reduce the correlation structure between predictor variables (Zuur et al., 2010). Also, we calculated the explained variance of the fixed effects (R2GLMM(m)) and fixed + random effects (R2GLMM(c)) (Nakagawa and Schielzeth, 2013).
We performed a Moran’s I test based on a distance matrix of sample units to evaluate each model’s spatial autocorrelation’s residuals. In the case of a non-significant result for the Moran's I model for a particular dependent variable, we used the results from GLMM to evaluate its association to the significant predictor variables. In the case of a Moran’s I significant result, revealing a residual’s spatial autocorrelation, we ran a generalised least square (GLS) model that explicitly incorporates correlated errors. We ran the model using different correlation structure classes to model within-group correlation, available in the function gls (package nlme: Pinheiro et al. 2017). Then, we compared the different models (fitted with distinct correlation structure classes) with the Akaike Information Criterion (AIC).
For analyses, we focused only on the stumps in Stages 1 and 2 of decomposition, i.e., more recently logged trees, in order to accommodate in the time frame of removals carried out in 2019, concerning the most recent survey provided by the Biodiversity Research Program (PPBio), in the PEDI site (2015-2018). We performed all analyses using the software R, version 3.6.0 (R Development Core Team, 2019), using the functions lme (Package nlme; Pinheiro et al. 2017) and glmer (Package lme4; Bates et al., 2015).
ResultsWe found 290 stumps in the sample, of which 23 were in stage 3 of decomposition. Thus, our analyses comprised 267 stumps in stage 1 or 2 of decomposition, most of them identified to species and logged within the time frame of one year. We recorded 55 logged species, which account for 20.8% of the 265 species available in the live tree assemblage. Tree logging decreased the live assemblage density by 4.7%, 0.39% and 3.69% and reduced the biomass by 0.38%, 0.17% and 0.5% in MF, LSF and ESF, respectively (see Table S2 in Supplementary information).
Mature forests (MF) were the most harvested areas, with a record of 193 stumps, which made up 78.67% (4.02 Mg.ha-1) of the total logged biomass, distributed in 41 species. Secondly, the early secondary forest (ESF) provided 59 logged trees, accounting for 15.46% (0.79 Mg.ha-1) of harvested biomass from 20 species. Late secondary Forest (LSF) provided 15 logged trees, corresponding to 5.67% (0.29 Mg.ha-1) of the total logged biomass in eight species. Thus, the extraction in MF was 13 times greater than in LRF, which had the lowest extracted density, despite its tree availability 2.4 times higher than in ESF (Table S2). Logged trees were of low diameter at breast height (DBH), the bulkiest reaching 22.6 cm, with average diameters much smaller than the average DBH of available trees in all forest ages (Tables S1 and S2 in Supplementary information).
Among 55 logged species, we recorded only five (Pogonophora schomburgkiana, Eschweilera ovata, Miconia amacurensis, Helicostylis tomentosa and Myrcia guianensis) with more than ten stumps. These five species comprised the most explored in MF (M. amacurensis, P. schomburgkiana and H. tomentosa), in LSF (P. schomburgkiana) and ESF (E. ovata) (Table S3 in Supplementary information).
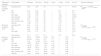
After running the GLMM for the three dependent variables with model simplification (Table S4) and checking each model’s residuals using Moran’s I (Table S5), we found that only species richness had a non-significant Moran’s I test. Based on GLMM results (Table 1), the extracted richness was significantly explained by the age in the chronosequence, revealing a removal of species in MF (z = 2.51, df = 24, p = 0.01) five times bigger than in ESF (z = 2.26 df = 24, p = 0.02), which exhibited the minimal species exploitation. The variable distance to urban areas also revealed that the most distant is the resource, the smallest is the removal of species from the forest (z = −4.81, df = 24, p < 0.01) (Fig. 2). Results for density and biomass of logged trees were not significantly explained by the independent variables when we incorporated spatial structure to the analysis, applying the GLS model (Table S5).
Results of the generalised linear mixed models (GLMM) for the dependent variables density, richness and biomass (logged trees), showing random and fixed effects used (for living tree assemblage).
| Dependent variables | Fixed effects | Estimate | Std. Error | df resid. | t value | z value | Pr(>|t|) | Pr(>|z|) | Variance explained |
|---|---|---|---|---|---|---|---|---|---|
| Density of logged trees | Intercept (LSF) | 0.92 | 0.90 | 20 | — | 1.02 | — | 0.003** | R2GLMM(m) = 0.35R2GLMM(c) = 0.66 |
| MF | 2.03 | 0.84 | 20 | — | 2.41 | — | 0.01* | ||
| ESF | 1.35 | 0.98 | 20 | — | 1.37 | — | 0.17 | ||
| dist_edge | -0.95 | 0.32 | 20 | — | -2.94 | — | 0.003** | ||
| total_biomass | -0.52 | 0.17 | 20 | — | -3.06 | — | 0.002** | ||
| total_density | 0.61 | 0.25 | 20 | — | 2.44 | — | 0.01* | ||
| spp_richness_total | -0.02 | 0.02 | 20 | — | -1.43 | — | 0.15 | ||
| declivity | -0.32 | 0.15 | 20 | — | -2.17 | — | 0.02* | ||
| Richness of logged trees | Intercept (LSF) | 0.48 | 0.34 | 24 | — | 1.42 | — | 0.15 | R2GLMM(m) = 0.26R2GLMM(c) = 0.26 |
| MF | 0.89 | 0.35 | 24 | — | 2.51 | — | 0.01** | ||
| ESF | 0.88 | 0.39 | 24 | — | 2.26 | — | 0.02* | ||
| dist_edge | -0.54 | 0.11 | 24 | — | -4.81 | — | <0.01 *** | ||
| total_density | 0.17 | 0.14 | 24 | — | 1.26 | — | 0.20 | ||
| Biomass of logged trees | Intercept (LSF) | 25.33 | 138.45 | 21.98 | 0.18 | — | 0.85 | — | R2GLMM(m) = 0.19R2GLMM(c) = 0.72 |
| MF | 240.05 | 140.41 | 8.77 | 1.71 | — | 0.12 | — | ||
| ESF | 3.09 | 133.69 | 5.72 | 0.02 | — | 0.98 | — | ||
| dist_trail | -38.97 | 36.30 | 37.08 | -1.07 | — | 0.29 | — | ||
| dist_edge | -54.42 | 5.58 | 7.66 | -0.94 | — | 0.37 | — | ||
| total_biomass | -26.32 | 38.77 | 7.04 | -0.67 | — | 0.50 | — | ||
| total_density | 33.20 | 47.38 | 35.67 | 0.70 | — | 0.48 | — | ||
| spp_richness_total | -0.65 | 3.71 | 34.64 | -0.17 | — | 0.86 | — | ||
| declivity | -8.04 | 23.58 | 39.46 | -0.34 | — | 0.73 | — |
Variable meanings: dist_edge – distance to the nearest edge; dist_trail – distance to the nearest trail; total_biomass – biomass of living trees; total_density – total density of living trees; spp_richness_total – species richness of living trees; MF – Mature Forest; LSF – Late Secondary Forest; ESF – Early Secondary Forest. R2GLMM(m) = marginal R2 or variance explained by fixed effects; R2GLMM(c) = conditional R2 or variance explained by fixed + random effects.
 of logged trees and forest age (a) and distance to the nearest edge (b) in the Dois Irmãos State Park (PEDI), Recife, Pernambuco, Brazil. Predictor variables were standardised before analysis.")
Our study describes the magnitude of selective logging (SL), its impacts and drivers in the Brazilian Atlantic Forest (BAF) as evidenced by the forest. Firstly, we confirmed that SL leads to biodiversity loss, given that 21% of the tree assemblage is being affected. As around 90% of the tree species were harvested with few individuals, there is no consistent local motivation pattern for choosing species. However, the five most collected species (Pogonophora schomburgkiana, Eschweilera ovata, Miconia amacurensis, Helicostylis tomentosa and Myrcia guianensis) are commonly used as fuelwood (Specht et al., 2015), and the first two are also used for construction (De Medeiros et al., 2011). Other species are apparently harvested due to their availability and proximity to forest borders, which implies random chances for many species. However, even for the most common and abundant species, such as E. ovata and P. schomburgkiana, excessive harvesting will possibly lead to declines in their populations.
Selective logging additionally leads to the conversion of ecosystem services of regulation onto provision, at a rate of nearly 3% of trees and 0.4% of biomass affected per year. SL is noticeably a severe chronic disturbance that leads to degradation of forest landscapes and a significant reduction in ecosystem services. However, historical processes of such reductions have not been sufficiently understood (Costanza et al., 2014). However, it is known that recurrent removal of trees may exceed the capacity of forest recovery (Chazdon, 2003) and that all types of disturbances, even on a small scale, have significant consequences for forest succession (Specht et al., 2015; Tabarelli, 2010). Moreover, a current event may lead to a future and delayed loss of ecosystem services from an eventual decomposition of forest resources or tree cuts left behind (Rosa et al., 2016).
Our data provided evidence for two types of drivers for selective logging: forest supply and access. We can draw a general pattern, confirmed for species richness, that people living nearby harvest more in more accessible areas, either of mature or young age. Analysis of the dependent variables tree density and biomass gave us essential information about logging impacts. However, these two variables exhibited a strong spatial autocorrelation that, when taken into account, prevented us from separating the effect of explanatory variables from the spatial dependence between observations, as pointed out by Diniz-Filho et al. (2003). Nevertheless, our findings indicate that access is another crucial explanatory variable for logging, differently from the findings by Gonçalves et al. (2016), who pointed only to availability.
The studied fragment is within a peri-urban landscape, where access is eased by the proximity between forest borders and built areas inhabited by a low-income population. Local people’s demand, for instance, for fuelwood, requires higher amounts of biomass (Albuquerque et al., 2017; De Medeiros et al., 2011). Hence, we must also appreciate the matter from a social viewpoint and consider the possible motivations behind forest exploitation. While selective logging for marketable timber species is a typical pattern in the Amazon (Asner et al., 2005), selective logging for meeting local demands, such as house constructions or fuel, is typical in the BAF (Specht et al., 2015).
Altogether, our data allows for pondering about possible future scenarios under the current circumstances of selective logging. Based on our results, we can estimate that, in ten years, under a constant rate and not considering forest dynamics, logging alone may impact an average of 21% of the tree species, 30% of the stems and 4% of the biomass. As numbers vary along the chronosequence, we foresee a possible impact on 24%, 23% and 5% of the species richness in MF, ESF and LSF, respectively. The loss to logging compromises forest regeneration since logged trees are preferably those of lower diameter. This pattern is also reported by De Medeiros et al. (2011), agrees with the expected logging for meeting local demands and is very likely a consistent pattern in the northern Atlantic Forest, which deserves more investigation.
Although more minor, biomass removal should also be considered, especially in young forests. Such forests are expected to reach, after 20 years, an average of 122 Mg.ha-1 or more (Poorter et al., 2016). In the studied site, biomass reached only an average of 54 Mg.ha-1 and can lose nearly 5% of this AGB in ten years. Such high removal rates affect ecosystem functioning and, in the long term, modify the expected structure for a mature forest. As a consequence, MF may undergo retrogressive succession. At the same time, LSF and ESF may not follow a progressive succession and remain stationary in a plagiosere, i.e., a stage when the plant community is controlled by factors other than climate - in this case, anthropogenic forces (Pickett and McDonnell, 1989). Consequently, human populations in the future will be fated to a biologically impoverished environment (Tabarelli, 2010), in which a homogenised forest will have a decreased capacity to deliver ecosystem services (Arroyo-Rodríguez et al., 2017).
ConclusionThis study uncovered an undergoing process in urban forests, a severe threat but barely noticeable from outside: selective logging. Some lessons were learned: logging strongly impacts biodiversity and ecosystem services; logging delays secondary forests to undergo regeneration and can be prevented through access control and forest edges protection. Besides, some questions are stimulated from our work: what are the motivations of local people for logging? Are there species preferences when harvesting forest trees? What are the demands of local populations and possible alternatives for selective logging?
Forest administration, now with data in hand, must urgently act. Researchers on biodiversity must also move towards increasing our knowledge of this undesirable threat. There are enormous steps towards the sight of an optimistic scenario, which requires integrating biodiversity controlling and socioeconomic measures. It is urgent to build a strategic plan based on partnerships that consider forest sustainability, the increasing rates of the human population, its demands for public services in a situation of growing poverty. Plans must include measures of vigilance and control to avoid deforestation and look for the privations of the local population. The absence of such plans is one of the main obstructions for biodiversity and ecosystem services conservation (Ash et al., 2010; Tacconi et al., 2016; Watson et al., 2016). Actions are particularly imperative for a forest under restrict protection, like the studied park.
FundingThis work was supported by Fundação Grupo Boticário [grant number 1120_20181, Project “Irmãos do Parque”]; and Conselho Nacional de Desenvolvimento Científico e Tecnológico (CNPq/MCTI), Biodiversity Research Program, Brazilian Rainforest Network - PPBio-MA [grant number 457483/2012-1]. We ensure that the project's sponsors did not participate in any component of the project's development and are not involved in the decision to submit this paper for this journal.
Declaration of interestsThe authors declare that they have no known competing financial interests or personal relationships that could have appeared to influence the work reported in this paper.
We thank the Dois Irmãos State Park (PEDI) administration for research permission and the PPBio Mata Atlântica Program (PPBio-MA) for allowing the use of the data. We thank the Federal Rural University of Pernambuco (UFRPE), the Plant Ecology Laboratory and the Post-Graduate Program in Forest Sciences for all assistance and support; the CAPES Foundation, for granting postgraduate scholarships: (Finance Code 001) in Forest Sciences (to JASC; NCF; JSAC; LSR) and in Ethnobiology and Nature Conservation (to RFG); the PET/MEC for the scholarship given to ACBLS; MA Chagas for field assistance, A.G.C. Alves for valuable contributions on the drawing of this research, and two anonymous reviewers, for critically reading and improvement of this manuscript.
The following are Supplementary data to this article:


