Species response to land-use changes are usually assessed by investigating factors affecting distribution, with a single snapshot in time. However, several processes can lead to a same pattern. Focusing on observed, short-term patterns limits our ability to make inferences about ecological processes and responses to environmental change over time. In this study, we assessed changes in occupancy of two primate species in southeastern Brazil, following a major habitat loss due to implementation of a hydroelectric dam. Occupancy was assessed before dam construction and 11 years after, while explicitly accounting for imperfect detection. We assessed the effect of forest patch size and isolation on occupancy and rates of extinction and colonization, driven by landscape modification. Then we calculated occupancy under metapopulation equilibrium and expected time-lags resulting from non-equilibrium. We compared two primate species inhabiting forest patches, the black penciled marmoset Callithrix penicilatta and the black-fronted titi monkey Callicebus nigrifrons, with markedly different ecological characteristics. Those differences may explain why occupancy dynamics were driven by distinct elements. A fast response to habitat changes was observed only for marmoset, an opportunistic species. However, non-equilibrium states and the possibility of time-lag effects were observed for titi monkey, a species dependent on forest habitat. Our analyses support the need to establish long term monitoring and assess system vital rates over time. A single snapshot in time may lead to erroneous interpretations of a species response to habitat alteration.
Appearances can be deceiving. A site that currently hosts high biodiversity may not provide sufficient conditions for long-term persistence of species. Although habitat loss and land-use changes are the main causes of local extinctions in the tropics, species extinction may not be immediate (Hanski, 2013; Hylander and Ehrlén, 2013). When habitat loss is sudden, there may be a time-lag before extinction and colonization dynamics reach a new equilibrium with current habitat distribution – non-equilibrium dynamics (Krauss et al., 2010; Ovaskainen and Hanski, 2002; Tilman et al., 1994). As consequence, sometime after disturbance some species may be found in fragments where persistence is unlikely, even with no further land use change (the so-called “extinction debt”) (Hanski, 2000; Tilman et al., 1994).
A snapshot in time may therefore be a misleading representation of the capacity of a site to sustain biodiversity in long term (Krauss et al., 2010; Metzger et al., 2009; Vellend et al., 2013). Monitoring over time is therefore required for assessing effects of land use changes on local dynamics (Hanski, 2013). One way to monitor species persistence in fragmented landscapes is modeling extinction and colonization rates of habitat patches, using metapopulation theory. Metapopulation models link the proportion of occupied habitat patches to local extinction and colonization rates (Hanski, 1998, 2000). In a monitoring context, the rate of change in proportion of occupied patches is an important indicator of species viability (Ovaskainen and Hanski, 2002). Furthermore, assessing occupancy trends over time also enables focusing on mechanisms underlying site occupancy dynamics (Hylander and Ehrlén, 2013; Kuussaari et al., 2009; MacKenzie et al., 2003).
In this paper, we assessed the main drivers of changes in occupancy of two primate species, the black penciled marmoset Callithrix penicilatta and the black-fronted titi monkey Callicebus nigrifrons. New World marmosets of genus Callithrix are a small-bodied (<500g) group of monkeys that play a unique role in forests of Central and South America, because they are specialized on tree gouging and feeding on gum exudates (Rylands et al., 2009). Marmosets also have high reproductive rates (usually twins, twice a year), early sexual maturity (around one year old), and are relatively short-lived (up to 10 years in wildlife) (Mittermeier et al., 2013; Mustoe et al., 2012).
Marmoset small body size, rapid reproductive rates and systematic exploitation of plant exudates allow them to occupy several habitat types, even relatively inhospitable environments (Rylands et al., 2009). Indeed, black-penciled marmoset is not only able to tolerate habitat fragmentation, but is usually found in disturbed and secondary forests and also edge habitats (Kinzey, 1997; Vilela and Del-claro, 2011), being listed as “Least Concern (LC)” by IUCN Red List (www.iucn.org).
Titi monkeys of genus Callicebus have larger body size (1–2kg) (Roosmalen et al., 2002), slower reproduction rates and longer generation times, compared to marmosets (Kinzey, 1997). Female first birth happens at around 3.7±1.3 years, breeding females give birth to a single offspring annually (Valeggia et al., 1999), and they live up to 25 years (Mittermeier et al., 2013).
Black-fronted titi monkey (C. nigrifrons) originally had a wide distribution in Brazilian Atlantic forest and Cerrado. However, fragmentation and urbanization of forests within its range caused remaining populations to be isolated and generally small (Roosmalen et al., 2002). Due to 20–25% population declines in past 25 years, black-fronted titi monkey is listed as “Near Threatened (NT)” by IUCN Red List.
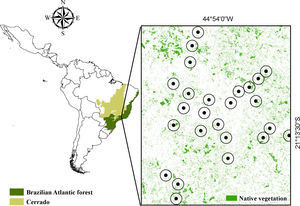
We created a sampling scheme that allowed us to infer the effect of a massive land use change in southeastern Brazil – the implementation of a hydroelectric reservoir (Fig. S1) – on primates’ occupancy, extinction and colonization probabilities. The effect of forest patch size and connectivity on extinction and colonization dynamics was also assessed. We tested the following hypothesis: (1st) time-lags can be found if observed occupancy is different from equilibrium expectations; (2nd) the faster a species responds to environmental disturbances, the less we expect it to exhibit time-lags; (3rd) occupancy is determined by patch size and/or connectivity in a positive relation; (4th) reductions in size and/or connectivity increase extinction and reduce colonization rates.
We created a sampling scheme that allowed us to infer the effect of a massive land use change in southeastern Brazil – the implementation of a hydroelectric reservoir (Fig. S1) – on primates’ occupancy, extinction and colonization probabilities. The effect of forest patch size and connectivity on extinction and colonization dynamics was also assessed. We tested the following hypothesis: (1st) time-lags can be found if observed occupancy is different from equilibrium expectations; (2nd) the faster a species responds to environmental disturbances, the less we expect it to exhibit time-lags; (3rd) occupancy is determined by patch size and/or connectivity in a positive relation; (4th) reductions in size and/or connectivity increase extinction and reduce colonization rates.
Materials and methodsSampling design and occupancy modelsSingle-season occupancy models estimate the probability that a site is occupied by a species during a short time interval, given that species is detected imperfectly (MacKenzie et al., 2002). In a single-season sampling scheme, a number n of sites are repeatedly visited on T sampling occasions. Detection/non-detection of species on each sampling occasion will result in survey histories for each sampled site. For example, ‘110’ indicate that species was detected at first and second occasion, but not at third. A model based on survey histories for each site is performed using probabilistic arguments so that occupancy and detection parameters (Ψ and p) are estimated via maximum-likelihood or Bayesian procedures (MacKenzie et al., 2006).
The simplest way to verify whether a population is in equilibrium with current landscape is to compare occupancy fit to present-day vs past landscape (Kuussaari et al., 2009). Time-lags can then be assumed if species distribution is best described by past rather than present landscape features (Kuussaari et al., 2009). That combination of historical and contemporary data sources has been considered a reliable way to infer about long term effects of habitat disturbances (Kuussaari et al., 2009; Vellend et al., 2013). Therefore, to test for existence of time-lag effects, we modeled current occupancy as function of patch size and connectivity before vs after habitat loss (Fig. 1).
 Forest patches were visited before and 10 years after habitat loss; (2) black-fronted titi monkey and black-penciled marmoset were surveyed on (3) repeated sampling occasions, (4) in order to create detection histories. (5) Covariates (patch size and connectivity) were obtained from Landsat 5TM satellite images at two points in time. (6) Occupancy models were fitted to test different hypothesis. (7) Initial (before habitat loss) size and connectivity were used in both (8) dynamic models, coupled with variations in those metrics, to assess extinction and colonization dynamics; and (9) single-season models, together with final measures (after habitat loss), to assess the fit of current occupancy to current vs past landscape.")
Flowchart of methods and sampling systematic plan. (1) Forest patches were visited before and 10 years after habitat loss; (2) black-fronted titi monkey and black-penciled marmoset were surveyed on (3) repeated sampling occasions, (4) in order to create detection histories. (5) Covariates (patch size and connectivity) were obtained from Landsat 5TM satellite images at two points in time. (6) Occupancy models were fitted to test different hypothesis. (7) Initial (before habitat loss) size and connectivity were used in both (8) dynamic models, coupled with variations in those metrics, to assess extinction and colonization dynamics; and (9) single-season models, together with final measures (after habitat loss), to assess the fit of current occupancy to current vs past landscape.
However, inferring ecological processes (extinction and colonization dynamics) from patterns (site occupancy) may not be reliable because several processes can produce the same pattern (MacKenzie et al., 2003). Observed patterns of landscape occupancy can result from non-equilibrium dynamics and hide decreasing population trends, for example. Therefore, changes in occupancy can only be assessed when monitoring is conducted over time. In that case, multiple-season (dynamic) models allow estimation of time-specific rates of occupancy, and local rates of extinction and colonization, while accounting for imperfect detection (MacKenzie et al., 2003).
Occupancy dynamics can therefore be represented by the following equation:
where Ψt indicates the proportion of sites occupied at time t, and ¿t and γt are the local probabilities of extinction and colonization, respectively. This equation represents a simple model of Markovian chain type, in which the state of a site (occupied or not) at a time (t+1) depends on a previous state at time t (MacKenzie et al., 2006).
We expected that initial occupancy (Ψinitial) would be dependent on landscape characteristics before habitat loss. Therefore, occupancy was considered to be affected by initial patch size and initial connectivity (Supplementary 1). We hypothesized that extinction and colonization probabilities (¿ and γ, respectively) would be driven by variation in those landscape metrics. Therefore, dynamic processes of extinction and colonization were modeled as function of variation in patch size and connectivity. That variation is simply the difference between values of patch size and connectivity before and after habitat loss.
We expected that initial occupancy (Ψinitial) would be dependent on landscape characteristics before habitat loss. Therefore, occupancy was considered to be affected by initial patch size and initial connectivity (Supplementary 1). We hypothesized that extinction and colonization probabilities (¿ and γ, respectively) would be driven by variation in those landscape metrics. Therefore, dynamic processes of extinction and colonization were modeled as function of variation in patch size and connectivity. That variation is simply the difference between values of patch size and connectivity before and after habitat loss.
If local probabilities of extinction and colonization are constant over time, a system described by Markovian model will reach dynamic equilibrium. Occupancy expected in equilibrium is therefore defined by system vital rates (¿ and γ) and can be computed by solving the equation (MacKenzie et al., 2006):

Ultimately, the difference between observed occupancy and that expected at an equilibrium (final) state indicates the proportion of patches expected to undergo extinction/colonization events (Hylander and Ehrlén, 2013). If observed occupancy is higher than equilibrium expectation, the proportion of patches expected to go extinct (the “extinction debt”) can be calculated. Otherwise, the proportion of patches yet to be colonized (the “colonization credit” (Hanski, 2000, 2013)) can also be assessed.
All data collection procedures were conducted under legal approval and consent of Brazilian Federal Authority (IBAMA, process #14083-1). We also followed the guidelines of American Society of Primatologists (ASP) Principles for Ethical Treatment of Non-Human Primates in dealing with wild species sampled in this study.
ResultsThere was a significant reduction in forest fragment size after deforestation of the area destined to Funil hydroelectric dam (t-value=2.47; p<0.05). However, there was an overall increase in connectivity for both titi monkey (t-value=3.84; p<0.05) and marmoset (t-value=4.23; p<0.05).
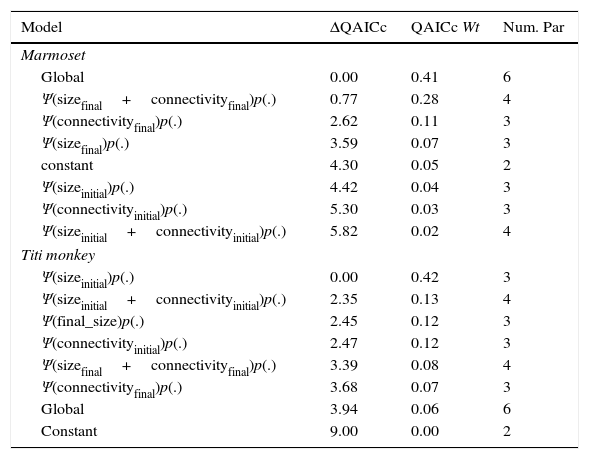
For marmoset, single-season models with current landscape covariates better explained nowadays occupancy than past landscape models (Table 1). Most supported dynamic model indicated by ΔQAICc suggested that extinction events were mainly driven by changes in site connectivity (Table 2). However, the constant model was similarly supported (ΔQAICc<2). Also, the high Akaike's weight of constant model (QAICc Wt=0.24) provides little support for site-specific variation in parameters. Therefore, local occupancy, extinction, and colonization processes of marmoset were not strongly related to any covariates. Further, no covariates had effect on marmoset initial occupancy, extinction probabilities or colonization probabilities (Table 3).
Comparison-of-fit of current occupancy to present vs past landscape features. Best fit of past landscape is an indication of time-lags. The table shows single-season occupancy models for black-fronted titi-monkey and black-tufted marmoset in remnants of the Brazilian Atlantic Forest.
| Model | ΔQAICc | QAICc Wt | Num. Par |
|---|---|---|---|
| Marmoset | |||
| Global | 0.00 | 0.41 | 6 |
| Ψ(sizefinal+connectivityfinal)p(.) | 0.77 | 0.28 | 4 |
| Ψ(connectivityfinal)p(.) | 2.62 | 0.11 | 3 |
| Ψ(sizefinal)p(.) | 3.59 | 0.07 | 3 |
| constant | 4.30 | 0.05 | 2 |
| Ψ(sizeinitial)p(.) | 4.42 | 0.04 | 3 |
| Ψ(connectivityinitial)p(.) | 5.30 | 0.03 | 3 |
| Ψ(sizeinitial+connectivityinitial)p(.) | 5.82 | 0.02 | 4 |
| Titi monkey | |||
| Ψ(sizeinitial)p(.) | 0.00 | 0.42 | 3 |
| Ψ(sizeinitial+connectivityinitial)p(.) | 2.35 | 0.13 | 4 |
| Ψ(final_size)p(.) | 2.45 | 0.12 | 3 |
| Ψ(connectivityinitial)p(.) | 2.47 | 0.12 | 3 |
| Ψ(sizefinal+connectivityfinal)p(.) | 3.39 | 0.08 | 4 |
| Ψ(connectivityfinal)p(.) | 3.68 | 0.07 | 3 |
| Global | 3.94 | 0.06 | 6 |
| Constant | 9.00 | 0.00 | 2 |
The sizeinitial and connectivityinitial are the remnant size and connectivity before flood, sizeinitial+connectivityinitial is the additive effect of remnant size and connectivity before flood. Model structure is the same for covariates after flood.
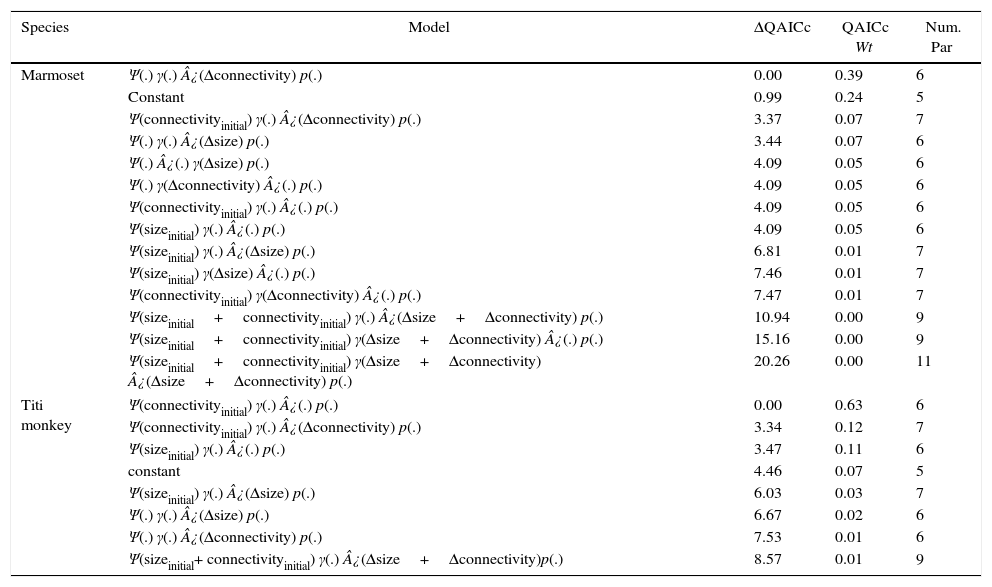
Dynamic occupancy models of forest patches for the black-penciled marmoset and the black-fronted titi monkey.
| Species | Model | ΔQAICc | QAICc Wt | Num. Par |
|---|---|---|---|---|
| Marmoset | Ψ(.) γ(.) ¿(Δconnectivity) p(.) | 0.00 | 0.39 | 6 |
| Constant | 0.99 | 0.24 | 5 | |
| Ψ(connectivityinitial) γ(.) ¿(Δconnectivity) p(.) | 3.37 | 0.07 | 7 | |
| Ψ(.) γ(.) ¿(Δsize) p(.) | 3.44 | 0.07 | 6 | |
| Ψ(.) ¿(.) γ(Δsize) p(.) | 4.09 | 0.05 | 6 | |
| Ψ(.) γ(Δconnectivity) ¿(.) p(.) | 4.09 | 0.05 | 6 | |
| Ψ(connectivityinitial) γ(.) ¿(.) p(.) | 4.09 | 0.05 | 6 | |
| Ψ(sizeinitial) γ(.) ¿(.) p(.) | 4.09 | 0.05 | 6 | |
| Ψ(sizeinitial) γ(.) ¿(Δsize) p(.) | 6.81 | 0.01 | 7 | |
| Ψ(sizeinitial) γ(Δsize) ¿(.) p(.) | 7.46 | 0.01 | 7 | |
| Ψ(connectivityinitial) γ(Δconnectivity) ¿(.) p(.) | 7.47 | 0.01 | 7 | |
| Ψ(sizeinitial+connectivityinitial) γ(.) ¿(Δsize+Δconnectivity) p(.) | 10.94 | 0.00 | 9 | |
| Ψ(sizeinitial+connectivityinitial) γ(Δsize+Δconnectivity) ¿(.) p(.) | 15.16 | 0.00 | 9 | |
| Ψ(sizeinitial+connectivityinitial) γ(Δsize+Δconnectivity) ¿(Δsize+Δconnectivity) p(.) | 20.26 | 0.00 | 11 | |
| Titi monkey | Ψ(connectivityinitial) γ(.) ¿(.) p(.) | 0.00 | 0.63 | 6 |
| Ψ(connectivityinitial) γ(.) ¿(Δconnectivity) p(.) | 3.34 | 0.12 | 7 | |
| Ψ(sizeinitial) γ(.) ¿(.) p(.) | 3.47 | 0.11 | 6 | |
| constant | 4.46 | 0.07 | 5 | |
| Ψ(sizeinitial) γ(.) ¿(Δsize) p(.) | 6.03 | 0.03 | 7 | |
| Ψ(.) γ(.) ¿(Δsize) p(.) | 6.67 | 0.02 | 6 | |
| Ψ(.) γ(.) ¿(Δconnectivity) p(.) | 7.53 | 0.01 | 6 | |
| Ψ(sizeinitial+ connectivityinitial) γ(.) ¿(Δsize+Δconnectivity)p(.) | 8.57 | 0.01 | 9 | |
Psi (Ψ) is initial occupancy and is modeled as function of size and connectivity of focal site at a time previous flood. Epsilon (¿) is extinction probability and gamma (γ) is colonization probability and they were modeled as function of variation in size (Δsize=sizefinal−sizeinitial) and variation in connectivity (Δconnectivity=connectivityfinal−connectivityinitial). Gamma was kept constant for the titi monkey because no previously unoccupied site was colonized. QAICc is the quasi-likelihood Akaike's information criterion corrected for small sample sizes. ΔQAICc is the difference from top-ranking model (in QAICc units). QAICc Wt is the weight of evidence support in favor of a model being the best among a model set.
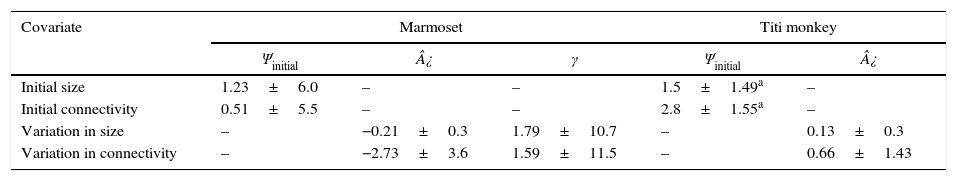
Effect of covariates on occupancy, extinction and colonization probabilities. Model averaged estimates are shown for the effect size of landscape predictors (initial size and connectivity) on occupancy (Ψinitial); and variation in size and connectivity on extinction (¿) and colonization (γ) probabilities, plus their associated standard errors. Colonization probabilities were not estimated for titi monkey because no site was colonized by that species during the sampling period.
Based on model averaged estimates of extinction (¿=0.24±0.18) and colonization probability (γ=0.62±0.41) for marmoset, occupancy expected in equilibrium is 0.72. That value is within those obtained for marmoset observed occupancy at present-day (Ψobs=0.77±0.18). Marmoset occupancy estimates also did not change through time (Ψt=0.81±0.11; Ψt+1=0.83±0.20). Further, Titi monkey current occupancy is still affected by initial forest patch size, as suggested by top-ranking model (Table 1). Most supported model indicated that initial occupancy was strongly affected by initial connectivity (Table 2). Connectivity and size before flooding of reservoir were positively related to initial occupancy, but no other covariate exhibited a strong relationship with extinction probability (Table 3). Extinction probability was low, but differed from zero (¿=0.08±0.07).
Colonization probability for titi monkey could not be modeled because we observed no colonization event. As calculation of metapopulation occupancy expected in equilibrium requires estimation of both extinction and colonization rates, we also could not estimate expected equilibrium values for titi monkey. Titi monkey occupancy estimates slightly decreased within primary sampling periods (Ψt=0.62±0.15; Ψt+1=0.57±0.14).
DiscussionSpecies distribution in a mosaic of forest patches is the ultimate result of extinction and colonization dynamics (Ovaskainen and Hanski, 2002). Those processes are affected by habitat patch size and connectivity and can be time-delayed from habitat degradation (Hanski, 2013; Tilman et al., 1994). We aimed at disentangling the effects of forest patch size and connectivity on occupancy and extinction and colonization probabilities of two primate species, subject to a major habitat loss ten years ago.
Marmoset occupancy seems to be in equilibrium with present-day landscape, because current occupancy is equal to that expected in metapopulation equilibrium. Also, the better fit of marmoset occupancy to present-day landscape illustrates absence of time-lag effects. This corroborates our predictions that time-lag effects should only be observed if occupancy was not in equilibrium with current landscape – 1st hypothesis. Marmoset rapid reproductive rates arise through early sexual maturity and ovulation immediate to postpartum (Mustoe et al., 2012). Also, evolution of multiple litters (twins, twice a year) increases reproductive capacity (Mustoe et al., 2012). Such increased reproductive rate in marmosets, coupled with efficient use of unlimited gum resource, can be related to a faster response to environmental changes. Therefore, observed equilibrium with current landscape and absence of time-lag effects in marmoset occupancy may be related to a fast response to land use changes, as a result of rapid reproductive rates, which supports our 2nd hypothesis.
We found an indication of time-lags for titi monkey, because current occupancy is related to a landscape attribute (forest patch size) dated before a major habitat loss. Moreover, we did not observe any colonization event of previously unoccupied sites. If extinction rate is greater than zero and colonization is zero, the population is expected to decline until entire depletion. That is an overly pessimistic scenario due to our small sample size. However, that may be suggestive of long-term decline in titi monkey local population. We hypothesize that titi monkeys did not colonize any site, despite the increase in landscape connectivity, due to their dependence on canopy structures (Lawler et al., 2006; Norconk, 2007). That canopy dependence may reduce dispersal ability in non-forest matrix and disturbed patches, thus inhibiting colonization events.
The strong effect of initial connectivity on titi monkey occupancy – 3rd hypothesis – may also be a result of a delayed response. Species with long generation times, relatively stable populations and exhibiting apparent low extinction risk, such as titi monkey, are predicted to face highest probability of delayed extinctions/colonizations (Kuussaari et al., 2009). Those transient dynamics may overestimate the conservation status of populations remaining in habitat patches (Kuussaari et al., 2009; Ovaskainen and Hanski, 2002). It may be therefore a negative bias to assume that all remaining species in recently fragmented landscapes have viable populations (Hanski, 2013; Metzger et al., 2009), such as in titi monkey case.
Contrary to our expectations, variation in size and connectivity were not good predictors of extinction and colonization probabilities – 4th hypothesis. Absence of an effect of size and isolation on extinction and colonization parameters is suggestive that drivers of occupancy dynamics for marmoset and titi monkey may be other than landscape-scale processes, as also suggested by other studies (Sales et al., 2015). Extinction and colonization events can be driven by many factors apart from size and connectivity. Local factors, such as species invasions, can impact communities as much as land-use change and more than habitat loss/fragmentation (Simberloff, 2007).
Investigating the influence of local factors such as species interactions, resource distribution and habitat quality on extinction and colonization dynamics is an intriguing extension of our analysis. Use of dynamic occupancy models to assess drivers of extinction and colonization rates, and also to calculate deviance from equilibrium expectation, can also be incorporated in study of other time-lag effects.
Conflicts of interestThe authors declare no conflicts of interest.
We are thankful to all land-owners who allowed us to work in their rural properties. Special thanks are given to Adriano Paglia for providing data on year 2002, and to Renan da Silva Macedo, Rayssa Pedroso, Tiago Carvalho, and Ismael Silva for their valuable help in fieldwork. LPS is financed by CAPES (grant # 00.889.834/0001-08). RL research is funded by CNPq (grants # 308532/2014-7, 479959/2013-7, 407094/2013-0), Conservation International Brazil, and O Boticário Group Foundation for Protection of Nature (PROG_0008_2013).