Most cited
- •
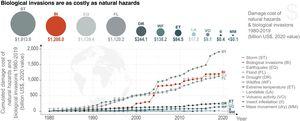
Damage costs from biological invasions and natural hazards are of similar magnitude.
- •
Global biological invasion costs increased by 702% from 1980–1999 to 2000–2019.
- •
Invasion costs increased faster than natural hazard damages over time (1980–2019).
- •
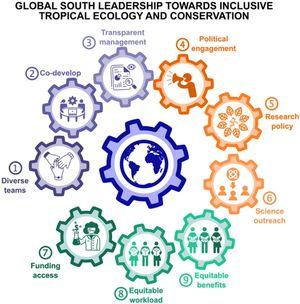
Limited Global South participation and parachute science hampers tropical ecology.
- •
Upgrades in equity, diversity and inclusion rooted in the Global South are essential.
- •
Tropical conservation practices must be led by local researchers and stakeholders.
- •
Recognition of science in the Global South may improve through outreach.
- •
International research must provide equitable workloads and recognition to Global South researchers.
- •
References are key to restoration, especially in highly threatened ecosystems.
- •
Optimal references connect conservation and restoration.
- •
Small remnants that serve as references can lead to landscape-scale benefits.
- •
A detailed habitat classification is needed for adequate protection and restoration.
- •
Ensuring optimal references protection will benefit future restoration initiatives.
- •
Secondary and old-growth subtropical Brazilian Atlantic Forests are acting as carbon sink.
- •
Biodiversity is not related to net carbon change in this region.
- •
Subtropical Brazilian Atlantic Forests should be conserved irrespective to their ages to maintain carbon sink.
- •
Biodiversity and carbon-related processes should be taken as conservation targets.
- •
We evaluated 7 water-related ES in landscapes with different proportions between eucalyptus and natural forests.
- •
There is a threshold close to 20% of forest coverage below which ES supply tends to become unsustainable.
- •
The highest gain to the seven ES occurs in catchments with natural forest cover over 45%.
- •
Erosion control was the service most linked to natural forest decrease.
- •
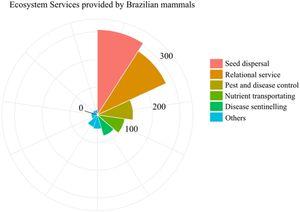
About 82% of Brazilian mammals deliver at least one of the 11 ecosystem services (ES).
- •
About 24% of the species are endemic to Brazil, where 75% them deliver at least one ES.
- •
These ES are at risk, as 57% of the species have lost their ES role are endemic.
- •
ES provision does not mirror the spatial patterns of mammal richness.
- •
The KBA Standards may not be scalable to all biodiversity.
- •
If everywhere can be a Key Biodiversity Area, nowhere is “Key”.
- •
If any area is “Key” the assessment process is solely based on manageability.
- •
Not all invasive grasses would be equally affected by climate change.
- •
Range retractions are projected for some species regardless of the scenario.
- •
We expect species niches to shift to areas not yet occupied.
- •
Arundo donax had the greatest range expansion in the SSP3 and SSP5 scenarios.
- •
Protecting further 6.75% of the Cerrado doubles representation of endemic tetrapods.
- •
Larger priority areas for conservation are concentrated in northern Cerrado.
- •
Small and m edium priority areas are scattered across southern Cerrado.
- •
Our ability to represent endemic terrestrial vertebrates decreased with recent habitat loss.
- •
Habitat loss precludes the representation of tetrapods in large top priority areas.
- •
Estimated ant species richness is higher in the tropical region.
- •
Estimated ant species richness was best explained by annual rainfall and mean temperature.
- •
The direction and effect of abiotic determinants are relative to the zoogeographic realm analyzed, highlighting regional effects.